

Abstract
Aims
To characterize the pharmacokinetics of deferiprone in healthy subjects using a model-based approach and to assess the effect of demographic and physiological factors on drug exposure.
Methods
Data from 55 adult healthy subjects receiving deferiprone (solution 100 mg ml−1) were used for model building purposes. A population pharmacokinetic analysis was performed using nonmem v.7.2. The contribution of gender, age, weight and creatinine clearance (CLcr) on drug disposition was evaluated according to standard forward inclusion, backward deletion procedures. Model selection criteria were based on graphical and statistical summaries.
Results
A one compartment model with first order oral absorption was found to describe best the pharmacokinetics of deferiprone. Simulated exposure values were comparable with previously published data. Mean AUC estimates were 45.8 and 137.4 mg l−1 h, whereas Cmax increased from 17.6 to 26.5 mg l−1 after administration of 25 and 75 mg kg−1 doses, respectively. Gender differences in the apparent volume of distribution (20%) have been identified, which are unlikely to be of clinical relevance. Furthermore, simulation scenarios reveal that dose adjustment is required for patients with reduced CLcr. Doses of 60, 40 and 25 mg kg−1 for patients showing mild, moderate and severe renal impairment are proposed based on CLcr values of 60–89, 30–59 and 15–29 ml min−1, respectively.
Conclusions
Our analysis has enabled the assessment of the impact of gender and CLcr on the pharmacokinetics of deferiprone. Moreover, it provides the basis for dosing recommendations in renal impairment. The implication of these covariates on systemic exposure is currently not available in the prescribing information of deferiprone.
Keywords: deferiprone, dose adjustment, iron overload, population pharmacokinetics, renal impairment, thalassaemia
What is Already Known about this Subject
The pharmacokinetics of deferiprone has been previously investigated in a non-compartmental manner. Deferiprone is rapidly absorbed and shows peak plasma concentrations within 45–60 min of administration. The drug is inactivated by glucuronidation and more than 90% is eliminated within 5 to 6 h of ingestion.
Despite the known contribution of renal clearance to the elimination process, there are no clear recommendations about the dose requirements for patients with renal impairment.
What This Study Adds
Deferiprone exposure has not been previously assessed by population pharmacokinetic methods. In contrast to data from non-compartmental analysis, our results show a statistically significant gender effect on the volume of distribution, which ultimately may impact on peak plasma concentrations.
In addition, simulation scenarios reveal that deferiprone dose adjustment is recommended for patients with reduced creatinine clearance.
Doses of 60, 40 and 25 mg kg−1 for patients showing mild, moderate and severe renal impairment are proposed based on creatinine clearance values of 60–89, 30–59 and 15–29 ml min−1, respectively.
Our analysis also raises the need to consider further evaluation of the pharmacokinetics of deferiprone in toddlers and young children, for whom current dose recommendations are not supported by pharmacokinetic data.
Introduction
Patients with β-thalassaemia and other transfusion-dependent diseases develop iron overload from chronic blood transfusions and require regular continuous iron chelation to prevent potentially fatal iron-related complications 1–5. Deferiprone (DFP) is the most extensively studied oral iron chelator to date. DFP is a hydroxypyridone derivative, which was authorized in Europe in 1999 for the treatment of iron overload in patients with β-thalassaemia major when deferoxamine (DFO) is contraindicated or inadequate.
Despite the wide clinical experience with DFP, its pharmacokinetics has not been fully characterized in patients. In addition, there are still limited experimental data available on DFP in children and no data in children under 6 years of age, where the drug is still used off-label. Thus far, it has been established that when administered orally, DFP is rapidly and completely absorbed. Plasma peak concentrations (Cmax) occur within 1 h of administration. Food reduces its absorption rate without affecting the overall exposure to the drug. In patients with β-thalassaemia, the administration of DFP at doses of 75 mg kg−1 day−1 as a twice daily regimen yields Cmax of 34.6 mg l−1 and area under the plasma concentration−time curve (AUC) of 137.5 mg l−1 h 6,7. On the other hand, food interaction data show that peak serum concentrations reach 17.5 mg l−1 and 11.8 mg l−1 in the fasting and fed state, respectively after a dose of 25 mg kg−1 8. DFP is for the most part inactivated by glucuronidation (>85%) and more than 90% of the drug is removed from plasma within 6 h of ingestion, with an elimination half-life of 1 to 2.5 h in patients affected by β-thalassaemia 5,6,9–14. DFP forms a 3:1 complex with iron, which is removed mainly through the kidneys in a similar manner as for the free parent drug. The area under the curve (AUC) of free DFP in patients shows high inter-individual variability, which may be related to the variation in the therapeutic response 5,10–12.
The impact of demographic and other physiological factors on the exposure of DFP has not been assessed thus far. In addition, the consequences of such factors for the dosing regimen have not been described in the published literature or in the Summary of Product Characteristics, which is issued by the European Medicines Agency after approval of the drug. Moreover, no information on dose adjustment requirements is provided for patients with hepatic or renal impairment. Given the fast renal elimination of the glucuronide metabolite, renal function is expected to play a major role in affecting the overall exposure to the parent drug.
The aim of this analysis was to characterize the DFP pharmacokinetics in healthy subjects using a model-based approach and assess the effect of demographic and physiological factors on drug exposure. Furthermore, it was our endeavour to show the clinical relevance of simulation scenarios to evaluate the impact of renal impairment on drug disposition and, consequently, for the optimization of the dosing regimen in special populations. Moreover, we anticipate that the availability of a population pharmacokinetic model for DFP will facilitate the evaluation of extrapolation of pharmacokinetic data from adults to children. More specifically, it will provide the basis for pharmacokinetic bridging of the dosing regimen for the paediatric population.
Methods
Data
The pharmacokinetics of DFP was evaluated using data collected from two clinical studies, LA20-BA and LA21-BE 15,16, in which healthy subjects received a single dose of 1500 mg of DFP as a 100 mg ml−1 solution. The studies have been conducted in full conformance with the principles of the Declaration of Helsinki and with the local laws and regulations concerning clinical trials. The protocol and the informed consent documents for each study have been formally approved by the relevant research ethics committee of each clinical site. The data were supplied by ApoPharma Inc, Canada and shared within the DEEP consortium (http://www.deep.cvbf.net), a joint international effort under the auspices of the FP7 programme, which is aimed at promoting further understanding of the efficacy and safety of DFP chelation therapy in children.
Both study protocols were approved by the Ethics Committee and all experimental procedures performed according to good clinical practice guidelines. In brief, 55 adult healthy subjects (39 males and 16 females) who had received the active medication were included in the analysis. Blood samples for the evaluation of DFP concentrations were taken before and at the following sampling times after dosing: 0.167, 0.333, 0.5, 0.75, 1, 1.333, 1.5, 1.667, 2, 2.5, 3, 4, 5, 6, 8, 10 and 14 h. On average, 15 samples were collected per subject. Median (range) age (years) and body weight (kg) of the adult population were 39 (19–55) and 72 (52–92), respectively.
Bioanalysis
DFP plasma concentrations were analysed by a validated method previously developed by ApoPharma (Toronto, Canada) using high performance liquid chromatography with ultraviolet detection (HPLC-UV). Extraction of DFP from supernatant was performed after precipitation of plasma proteins by trichloroacetic acid (TCA – 15%) and centrifugation at 10 000 g for 20 min at 4°C. The analytical column used for the analysis was a Hamilton PRP-1 and separation of the chromatogram of interest was achieved using an isocratic mobile phase (pH 7.0). The UV detector was set at 280 nm. In a recent review of the method, calibration, accuracy and precision estimates have been revisited by our group. The analytical range was linear between 3.13 and 800 μm (equivalent to 0.43 to 111 μg ml−1) based on an r2 value greater than 0.98, which was required to accept the standard curve. The lower limit of quantification (LLOQ) was 1 μm (equivalent to 0.14 μg ml−1). Inter- and intra-day accuracy and precision were found to be lower than 10%, i.e. within the predefined validation criteria for the method 17.
Pharmacokinetic modelling
Non-linear mixed effects modelling was performed in nonmem version 7.2 (Icon Development Solutions, USA). Model building criteria included (i) successful minimization, (ii) standard error of estimates, (iii) number of significant digits, (iv) termination of the covariance step, (v) correlation between model parameters and (vi) acceptable gradients at the last iteration.
Fixed and random effects were introduced into the model in a stepwise manner. Inter-individual variability in pharmacokinetic parameters was assumed to be log-normally distributed. A parameter value of an individual i (post hoc value) is therefore given by the following equation:
| equation 1 |
where θTV is the typical value of the parameter in the population and ηi is assumed to be random variable with zero mean and variance ω2.
Residual variability, which comprises measurement and model misspecification, was described with a proportional error model. This means that for the jth observed concentration of the ith individual, the relation:
| equation 2 |
where Fij is the predicted concentration and εij the random variable with mean zero and variance σ2. W is a proportional weighing factor for ε.
Goodness of fit was assessed by graphical methods, including population and individual predicted vs. observed concentrations, conditional weighted residual vs. observed concentrations and time, correlation matrix for fixed vs. random effects, correlation matrix between parameters and covariates and normalized predictive distribution error (NPDE) 18,19. Comparison of hierarchical models was based on the likelihood ratio test. A superior model was also expected to reduce inter-subject variability terms and/or residual error terms.
Covariate analysis
Continuous and categorical covariates were tested during the analysis. The relationship between individual PK parameters (post hoc or conditional estimates) and covariates was explored by graphical methods (plot of each covariate vs. each individual parameter). Relevant demographic covariates (body weight, age, gender, creatinine clearance) were entered one by one into the population model (univariate analysis). After all significant covariates had been entered into the model (forward selection), each covariate was removed (backward elimination), one at a time. The model was run again and the objective function recorded. The likelihood ratio test was used to assess whether the difference in the objective function between the base model and the full (more complex) model was significant. The difference in – 2log likelihood (DOBJF) between the base and the full model is assumed to be approximately χ2 distributed, with degrees of freedom equal to the difference in number of parameters between the two hierarchical models. Because of the exploratory nature of this investigation, for univariate analyses, additional parameters leading to a decrease in the objective function of 3.84 were considered significant (P < 0.05). During the final steps of the model building, only the covariates which resulted in a difference of objective function of at least 7.88 (P < 0.005) were kept in the final model.
Model validation
The validation of the final pharmacokinetic model was based on graphical and statistical methods, including visual predictive checks 15. Given the importance of the validation procedures for the subsequent use of a model for simulation purposes, in this study we have included a wide range of diagnostic methods to assess the accuracy of the parameter estimates and the predictive performance of the model 16. Bootstrap was used to identify bias, stability and accuracy of the parameter estimates (standard errors and confidence intervals). The bootstrap procedures were performed in PsN v3.5.3 (University of Uppsala, Sweden) 20, which automatically generates a series of new data sets by sampling individuals with replacement from the original data pool, fitting the model to each new data set. Subsequently, parameter estimates were used to simulate plasma concentrations in subjects with similar demographic characteristics, dosing regimens and sampling scheme as in the original clinical studies. Mirror plots were also generated to evaluate the variance-covariance structure of the parameters in the model, which is reflected by the degree of similarity between the original fit and the pattern obtained from the fitting of the simulated data sets using the final pharmacokinetic model.
In addition to the graphical analysis, posterior predictive checks were performed using the area under the plasma concentration vs. time curve (AUC) and peak plasma concentration (Cmax) as a measure of model performance. AUC and Cmax values were calculated non-compartmentally by the trapezoidal method from simulations of 1000 data sets with the same demographic characteristics, dosing regimens and sampling scheme as in the original clinical studies.
The distribution of model-predicted AUC and Cmax values is summarized as geometric mean, lower and upper boundaries of the 95% confidence intervals and compared with the findings from non-compartmental analysis in the two clinical studies. Model performance was demonstrated by the location of the original estimates across the predicted distribution (histograms).
Simulation scenarios
Simulations were performed using the final model to assess whether predicted secondary PK parameters, such as AUC and Cmax, would be in line with literature references 7,14,21. Thirty simulated patients (15 males and 15 females) with a mean body weight of 55 kg (SD 8.4) received DFP under the following dosing recommendations: 25 and 75 mg kg−1 day−1.
Furthermore, additional simulation scenarios were evaluated to assess the implications of renal impairment for the pharmacokinetics of DFP in a group of patients with similar demographic characteristics, as described above. Taking into account the correlation between the reduction in creatinine clearance and the severity of renal impairment, three scenarios were considered, including 80, 50 and 25% of the normal clearance values. They were meant to reflect the changes in renal function in mild, moderate and severe impairment, respectively. Simulated patients received 75 mg kg−1 day−1 DFP and their exposure was compared with healthy subjects (reference population). Dosing regimens were adjusted to ensure that DFP exposure similar to the levels observed in the reference population was achieved and maintained irrespective of the degree of renal impairment.
Results
Population pharmacokinetic modelling
The pharmacokinetics of DFP was best described by a one compartment model with first order absorption, lag-time to central compartment and first order elimination. Inter-individual variability (IIV) could be estimated for apparent clearance (CL/F), apparent volume of distribution (V/F), and absorption rate constant (Ka). Residual variability was characterised by a proportional error model with a weighting factor.
During covariate model selection, the effect of age, gender and body weight was tested on relevant pharmacokinetic parameters. Initially when tested separately, significant effects of gender on V/F and body weight on CL/F and V/F were identified and described according to a linear model. However, despite statistical significance and improvement in the goodness-of-fit, the inclusion of body weight on either CL/F or V/F also led to an important reduction in model stability during bootstrapping procedures, which was likely caused by the limited range of the covariate values in the study population. Therefore, only gender on V/F was retained in the final model. This resulted in a better description of the data, subsequently increasing the model performance. An overview of the parameter estimates is presented in Table 1.
Table 1.
Final deferiprone pharmacokinetic model parameter estimates and corresponding bootstrap results
| Parameters | Final model | Bootstrap = 500 runs | |
|---|---|---|---|
| Estimate | Median | CV (%) | |
| CL/F (l h−1) | 30.8 | 30.9 | 3.12 |
| V/F males (l) | 78.4 | 78.53 | 2.39 |
| V/F females (l) | 65.3 | 65.3 | 3.88 |
| Ka (h−1) | 8.2 | 8.73 | 29.2 |
| Lag time (h−1) | 0.146 | 0.145 | 3.93 |
| IIV CL/F | 0.057 (23.87%) | 0.0557 (23.6%) | 17.59 |
| IIVV/F | 0.0278 (16.67%) | 0.0267 (16.34%) | 20.22 |
| Correlation CL-V | 0.0345 | 0.0335 | 20 |
| IIVKa | 0.991 (99.54%) | 1.00 (100%) | 23.8 |
| Error: weighting factor | 2.4 | 2.41 | 15.26 |
| Residual error | 0.00566 (7.52%) | 0.00568 (7.53%) | 25.88 |
CL/F apparent clearance; V/F apparent volume of distribution; Ka absorption rate constant; IIV interindividual variability.
Internal model validation diagnostics were satisfactory. Individual predicted profiles and goodness-of-fit plots revealed that the model provided an adequate and un-biased description of the data, as shown in Figures 1 and S1 (see Supporting Information). In addition, despite a small deviation at the tails of the distribution, NPDE summaries (Figure S2, see Supporting Information) showed that the discrepancy between predicted and observed values could be assumed to be normally distributed.
Figure 1.

Visual predictive check (VPC) and a random selection of individual plots. VPC on the left panel: observed data are plotted using blue circles, the black and red solid lines represent the median and the 5th and 95th percentiles of the simulated data, respectively. The panels on the right show individual plots of four randomly selected patients: observed data are plotted using blue circles, the black solid line represents the population prediction (Pred) and the red solid line represents the individual predictions (IPred)
The predictive performance of the model in subsequent simulations was deemed critical to achieve the objective of our analysis. To this purpose, mirror plots were used to assess whether the variance and covariance structures have been well characterized. Lastly, the median parameter estimates from the bootstrap analysis were found to be in close agreement with the results observed during the original fitting. Results from the bootstrap analysis are presented in Table 1. Overall these diagnostic techniques confirm that the final model is suitable for the purposes of data simulation.
Simulation scenarios
First an attempt was made to perform external validation of the model by deriving secondary parameters (AUC and Cmax) and comparing model-predicted estimates with literature references 7,14,21. As shown in Figure 2, reference values lay within the distribution of simulated AUC and Cmax, for which the mean and 90% CI were 45.80 (44.42, 47.17) mg l−1 h and 17.67 (17.13, 18.20) mg l−1, respectively after administration of a single oral dose of 25 mg kg−1 DFP and 137.40 (133.27, 141.52) mg l−1 h and 26.50 (25.70, 27.29) mg l−1, respectively after administration of 75 mg kg−1 day−1 dose as a twice daily regimen. Despite the gender effect on the volume of distribution, no significant differences were observed when comparing Cmax values. This may be explained by the limited number of females in our analysis as well as by the differences in the DFP formulation used in past protocols.
Figure 2.

Comparison of secondary PK parameters (Cmax and AUC) with literature reference values. Predicted DFP exposure expressed as Cmax and AUC for adult patients receiving 25 mg kg−1 as a single dose and 75 mg kg−1 day−1 twice daily. The dashed black lines depict the mean simulated values, whereas the solid coloured lines depict published results 7,14,17. Percent of total indicates the percentage of cases for each beam of 100 simulations with 55 patients in each simulated trial
As the population available for the analysis was limited to healthy subjects, the impact of another important covariate could not be estimated during the fitting procedures, namely, the role of glomerular filtration as determined by the changes in creatinine clearance. Therefore a simulation-based approach was used to quantify the implications of renal impairment for the disposition of DFP. Systemic exposure expressed as AUC was simulated for three scenarios representing mild, moderate and severe impairment and compared with the estimates obtained for subjects with normal renal function. It is evident from Figure 3 that over-exposure occurred when comparing the three sub-populations receiving 75 mg kg−1 day−1 DFP with the reference data, particularly in the case of moderate and severe impairment. As shown in Figure 4, dose adjustments should be considered to ensure that DFP exposure is maintained at the desired levels for all three scenarios. The implications of reduced renal function for the dose rationale are depicted in Figure 5, which shows mean systemic exposure to DFP, expressed in terms of AUC vs. dose for varying levels of renal impairment under the assumption of first order pharmacokinetics in this population. Doses of 60, 40 and 25 mg kg−1 for patients showing mild, moderate and severe renal impairment are proposed based on creatinine clearance values of 60–89, 30–59 and 15–29 ml min−1, respectively. An overview of these recommendations is summarized in Table 2.
Figure 3.
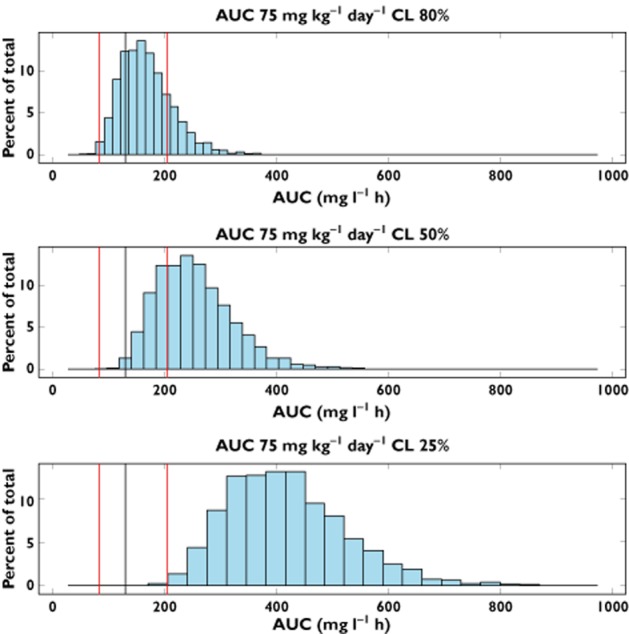
AUC distributions in patients showing a reduction in total clearance. Predicted DFP exposure expressed as AUC for adult patients receiving 75 mg kg−1 day−1 and presenting 80%, 50% and 25% of the total clearance relative to the reference population, respectively. The black line represents the median of the reference population (i.e. normal renal function), whereas the red lines represent 5th and 95th percentiles of the same reference population. Percent of total indicates the percentage of cases for each beam of 100 simulations with 55 patients in each simulated trial
Figure 4.

Model-based dosing recommendations for DPF in renally impaired patients. AUC distributions in patients showing reduced DFP elimination, corresponding to 80, 50 and 25% of total clearance observed in patients with normal renal function. Predicted DFP exposure for adult patients receiving the adjusted dosing recommendation based on the severity of renal impairment. The black line represents the median of the reference population (i.e. normal renal function), whereas the red lines represent 5th and 95th percentiles of the same reference population. Percent of total indicates the percentage of cases for each beam of 100 simulations with 55 patients in each simulated trial
Figure 5.

Changes in the relationship between dose vs. exposure to deferiprone due to renal impairment. The open circles represent the reference population with normal renal function. The open triangles, filled circles and filled triangles represent mild (80%), moderate (50%) and severe (25%) renal impairment, respectively
Table 2.
Dosing recommendations for deferiprone in patients with varying degrees of renal impairment
| Scenarios | Degree of impairment | CLcr (ml min−1) | Current dosing recommendations (mg kg−1 day−1) | Proposed dosing recommendations (mg kg−1 day−1) |
|---|---|---|---|---|
| 80% of total clearance | Mild | 60–89 | 75 | 60 |
| 50% of total clearance | Moderate | 30–59 | 75 | 40 |
| 25% of total clearance | Severe | 15–29 | 75 | 25 |
Discussion
As generally known, variability in pharmacokinetics can significantly affect the outcome of a given therapeutic intervention. Therefore, full optimization of the therapeutic regimen cannot be achieved without taking inter-individual variability into account. This is particularly important in chronic diseases, which can be inborn or develop and progress over a long span of life. In these circumstances, factors such as co-morbidities, co-medication and compliance need to be added to the (patho)physiological changes that are known to occur during the natural course of disease. The use of model-based approaches to define the dose rationale and personalize dosing regimens for subgroups of patients and special populations has therefore become an invaluable tool in therapeutics, as it allows characterization and quantification of the contribution of different sources of variability to the pharmacokinetic profile of a drug in individual patients. In fact, despite the continuous emphasis on the need for evidence-based clinical and regulatory decisions, modelling and simulation is becoming an essential component of evidence synthesis, which ultimately underpins decisions and recommendations 22–24. As shown in the current investigation, the relevance of model-based approaches can be even larger when data availability is limited, as is the case of transfusion dependent diseases and other pathologies associated with renal and hepatic impairment.
Deferiprone pharmacokinetics
With this analysis we show how population pharmacokinetics can be used to explore the implications of different sources of variability on the exposure of the oral iron chelator DFP. The estimates of the main parameters of interest (Table 1) were in line with previously published results 6,7,10–13,21,25–27. As shown in Figure 2, similar agreement was also observed for the secondary PK parameters (AUC and Cmax). By contrast, no gender differences have been identified in previous studies. In this respect, our analysis illustrates the importance of parametric methods for accurate evaluation of covariate effects. We have estimated the gender effect on the apparent volume of distribution, which causes V/F values to be higher in males than in females, respectively (i.e. 78.4 vs. 65.3 l, a 20% difference between the two groups). Such a difference is likely to have minor or no clinical implications, if one assumes that overall exposure (AUC) rather than peak concentration (Cmax) determines treatment response.
Dosing recommendations in patients with renal impairment
Considering the lack of details in the label of DFP regarding the dose rationale for special populations, it was of interest to us to provide insight into dosing recommendations for patients with renal impairment, which occurs as a co-morbidity in thalassaemia. Given that, independently of the metabolic rate, 90% of the total drug (free, metabolized and iron-complex) is excreted in the urine within 5 to 6 h of ingestion, we have assumed that renal impairment would be clinically more relevant, as compared with hepatic impairment. We have selected a discrete number of scenarios to describe different levels of impairment (mild, moderate and severe). As could be anticipated for any drug with primary renal elimination 28,29, the use of the standard recommended dose of 75 mg kg−1 day−1 leads to overexposure to DFP, especially when clearance is reduced beyond 50% of the normal range. Taking into account the DFP concentrations associated with effective response, dosing regimens are proposed for the three sub-populations allowing exposure to remain comparable with values observed in patients with normal renal function.
Personalized regimens
As discussed above, model-based approaches can be critical for therapeutic decisions when limited evidence is available. This is certainly the case for transfusion dependent diseases, especially when considering young paediatric patients, for whom limited or no data exist and the use of DFP is still off label.
Our analysis represents the first attempt to synthesize current knowledge on the pharmacokinetics of DFP and subsequently optimize the dosing regimen in special populations. In addition to renal impairment, we envisage the use of this model for the optimization of clinical trial design in children. It is worth mentioning that optimization of the protocol design may enable the use of smaller cohorts as well as a considerable reduction in the burden associated with sampling procedures thanks to sparse sampling techniques.
Limitations and assumptions
Given that the model has been developed on data collected in healthy subjects, questions arise about the relevance of the parameter estimates for the target patient population. As shown in Figure 2, simulated AUC and Cmax values were comparable with published data obtained in patients treated with DFP. These findings appear to contrast with the data obtained by Limenta et al. in splenectomized patients 14. On the other hand, no major differences were observed in the work carried out by Stobie et al. 21, who compared the pharmacokinetics of DFP in healthy subjects with patients affected by β-thalassaemia. Their investigation shows only a slight difference in the apparent volume of distribution between the two groups, but the results were found not to be statistically significant 6,21.
We have to acknowledge that a lower mean Cmax was observed when comparing simulated data and reference data at 75 mg kg−1 day−1 twice daily. This difference could, however, be caused by different factors, including differences in absorption, bioavailability or drug distribution. Irrespective of the cause, we anticipate that such differences are unlikely to have clinical implications. It is accepted that overall systemic exposure, as expressed by AUC, is the primary determinant of the response. AUC values were comparable between the two groups. Although changes in haemodynamics and vascular permeability are known to occur in patients with transfusion-dependent haemoglobinopathies, we believe that such differences will not be clinically relevant for the overall disposition properties of DFP.
In conclusion, our analysis has allowed the identification of the effect of gender on the volume of distribution of DFP. In conjunction with simulation scenarios, we have shown that reductions in creatinine clearance are likely to cause major changes in systemic exposure to DFP. A new dosing regimen is proposed for patients with renal impairment to ensure comparable drug exposure in this special population.
Competing Interests
All authors have completed the Unified Competing Interest form at http://www.icmje.org/coi_disclosure.pdf (available on request from the corresponding author) and declare FB had financial support from the DEEP consortium (sponsored by the European Union). There are no financial relationships with any organizations that might have an interest in the submitted work in the previous 3 years and no other relationships or activities that could appear to have influenced the submitted work.
This contribution is part of the DEferiprone Evaluation in Paediatrics (DEEP) consortium, supported by the FP7 Framework Research Program ‘HEALTH-2010.4.2-1: Off-patent medicines for children’.
Supporting Information
Additional Supporting Information may be found in the online version of this article at the publisher's web-site:
Figure S1 Goodness-of-fit. Left upper panel shows the population prediction (PRED) vs. observed concentration values (DV). Right upper panel shows individual predictions (IPRE) vs. observed concentration values (DV). Left lower panel shows conditional weighted residuals (CWRES) vs. population predictions (PRED). Right lower panel shows conditional weighted residuals (CWRES) vs. time (TIME). Solid line represents the identity line
Figure S2 Normalized prediction distribution errors
References
- Clegg JB, Higgs DR, Gibbons R, Old JM, Olivery FN, Swee Lay T, Weatherall DJ, Wood WG. The pathophysiology of the thalassaemias. In: Gibbons R, Higgs DR, Old JM, Olivieri NF, Swee Lay T, Wood WG, editors. The Thalassaemia Syndromes. 4th edn. Oxford: Blackwell Science; 2001. pp. 192–236. [Google Scholar]
- Cunningham MJ, Macklin EA, Neufeld EJ, Cohen AR. Thalassemia Clinical Research Network. Complications of beta-thalassemia major in North America. Blood. 2004;104:34–39. doi: 10.1182/blood-2003-09-3167. [DOI] [PubMed] [Google Scholar]
- Borgna-Pignatti C, Cappellini MD, De Stefano P, Del Vecchio GC, Forni GL, Gamberini MR, Ghilardi R, Origa R, Piga A, Romeo MA, Zhao H, Cnaan A. Survival and complications in thalassemia. Ann N Y Acad Sci. 2005;1054:40–47. doi: 10.1196/annals.1345.006. [DOI] [PubMed] [Google Scholar]
- Borgna-Pignatti C, Cappellini MD, De Stefano P, Del Vecchio GC, Forni GL, Gamberini MR, Ghilardi R, Piga A, Romeo MA, Zhao H, Cnaan A. Cardiac morbidity and mortality in deferoxamine- or deferiprone-treated patients with thalassemia major. Blood. 2006;107:3733–3737. doi: 10.1182/blood-2005-07-2933. [DOI] [PubMed] [Google Scholar]
- Galanello R, Campus S. Deferiprone chelation therapy for thalassemia major. Acta Haematol. 2009;122:155–164. doi: 10.1159/000243800. [DOI] [PubMed] [Google Scholar]
- Barman Balfour JA, Foster RH. Deferiprone: a review of its clinical potential in iron overload in beta-thalassaemia major and other transfusion-dependent diseases. Drugs. 1999;58:553–578. doi: 10.2165/00003495-199958030-00021. [DOI] [PubMed] [Google Scholar]
- Fassos FF, Klein J, Fernandes D, Matsui D, Olivieri NF, Koren G. The pharmacokinetics and pharmacodynamics of the oral iron chelator deferiprone (L1) in relation to hemoglobin levels. Int J Clin Pharmacol Ther. 1996;34:288–292. [PubMed] [Google Scholar]
- European Medicines Agency. 2013. Deferiprone Summary of Product Characteristics. Available at http://www.ema.europa.eu/docs/en_GB/document_library/EPAR_-_Product_Information/human/000236/WC500022050.pdf (last accessed 20 January 2014)
- Benoit-Biancamano MO, Connelly J, Villeneuve L, Caron P, Guillemette C. Deferiprone glucuronidation by human tissues and recombinant UDP glucuronosyltransferase 1A6: an in vitro investigation of genetic and splice variants. Drug Metab Dispos. 2009;37:322–329. doi: 10.1124/dmd.108.023101. [DOI] [PubMed] [Google Scholar]
- Diav-citrin O, Koren G. Oral iron chelation with deferiprone. New Front Pediat Drug Ther. 1997;44:235–247. doi: 10.1016/s0031-3955(05)70471-5. [DOI] [PubMed] [Google Scholar]
- Hoffbrand AV, Cohen A, Hershko C. Role of deferiprone in chelation therapy for transfusional iron overload. Blood. 2003;102:17–24. doi: 10.1182/blood-2002-06-1867. [DOI] [PubMed] [Google Scholar]
- Hoffbrand AV. Deferiprone therapy for transfusional iron overload. Best Pract Res Clin Haematol. 2005;18:299–317. doi: 10.1016/j.beha.2004.08.026. [DOI] [PubMed] [Google Scholar]
- Limenta LMG, Jirasomprasert T, Tankanitlert J, Svasti S, Wilairat P, Chantharaksri U, Fucharoen S, Morales NP. UGT1A6 genotype-related pharmacokinetics of deferiprone (L1) in healthy volunteers. Br J Clin Pharmacol. 2008;65:908–916. doi: 10.1111/j.1365-2125.2008.03103.x. [DOI] [PMC free article] [PubMed] [Google Scholar]
- Limenta LMG, Jirasomprasert T, Jittangprasert P, Wilairat P, Yamanont P, Chantharaksri U, Fucharoen S, Morales NP. Pharmacokinetics of deferiprone in patients with beta-thalassemia. Clin Pharmacokinet. 2011;50:41–50. doi: 10.2165/11536630-000000000-00000. [DOI] [PubMed] [Google Scholar]
- Apotex Research Inc. 2005. Clinical study report LA20-BA: an open label, single-dose, three-way crossover bioavailability study of deferiprone tablets (Ferriprox) and deferiprone solution under fasting and fed conditions.
- ApoPharma Inc. 2005. Clinical study report LA21-BE. Randomized, open label, comparative, twoway crossover bioavailability study of deferiprone oral solution and Ferriprox (deferiprone) tablets under fasting conditions.
- Bellanti F, Della Pasqua O. 2011. Internal report: analytical procedure for the determination of deferiprone in human plasma by HPLC.
- Hooker AC, Staatz CE, Karlsson MO. Conditional weighted residuals (CWRES): a model diagnostic for the FOCE method. Pharm Res. 2007;24:2187–2197. doi: 10.1007/s11095-007-9361-x. [DOI] [PubMed] [Google Scholar]
- Comets E, Brendel K, Mentré F. Computing normalised prediction distribution errors to evaluate nonlinear mixed-effect models: the npde add-on package for R. Comput Methods Programs Biomed. 2008;90:154–166. doi: 10.1016/j.cmpb.2007.12.002. [DOI] [PubMed] [Google Scholar]
- Lindbom L, Ribbing J, Jonsson EN. Perl-speaks-nonmem (PsN) – a Perl module for nonmem related programming. Comput Methods Programs Biomed. 2004;75:85–94. doi: 10.1016/j.cmpb.2003.11.003. [DOI] [PubMed] [Google Scholar]
- Stobie S, Tyberg J, Matsui D, Fernandes D, Klein J, Olivieri N, Bentur Y, Koren G. Comparison of the pharmacokinetics of 1,2-dimethyl-3-hydroxypyrid-4-one (L1) in healthy volunteers, with and without co-administration of ferrous sulfate, to thalassemia patients. Int J Clin Pharmacol Ther Toxicol. 1993;31:602–605. [PubMed] [Google Scholar]
- Bellanti F, Della Pasqua O. Modelling and simulation as research tools in paediatric drug development. Eur J Clin Pharmacol. 2011;67(Suppl 1):75–86. doi: 10.1007/s00228-010-0974-3. [DOI] [PMC free article] [PubMed] [Google Scholar]
- Manolis E, Osman TE, Herold R, Koenig F, Tomasi P, Vamvakas S, Raymond AS. Role of modeling and simulation in pediatric investigation plans. Paed Anaesth. 2011;21:214–221. doi: 10.1111/j.1460-9592.2011.03523.x. [DOI] [PubMed] [Google Scholar]
- Manolis E, Pons G. Proposals for model-based paediatric medicinal development within the current European Union regulatory framework. Br J Clin Pharmacol. 2009;68:493–501. doi: 10.1111/j.1365-2125.2009.03484.x. [DOI] [PMC free article] [PubMed] [Google Scholar]
- Al-Refaie FN, Sheppard LN, Nortey P, Wonke B, Hoffbrand AV. Pharmacokinetics of the oral iron chelator deferiprone (L1) in patients with iron overload. Br J Haematol. 1995;89:403–408. doi: 10.1111/j.1365-2141.1995.tb03318.x. [DOI] [PubMed] [Google Scholar]
- Matsui D, Klein J, Hermann C, Grunau V, McClelland R, Chung DS, Louis P, Oliviery N, Koren G. Relationship between the pharmacokinetics and iron excretion pharmacodynamics of the new oral iron chelator 1,2-dimethyl-3-hydroxypyrid-4-one in patients with thalassemia. Clin Pharmacol Ther. 1991;50:294–298. doi: 10.1038/clpt.1991.139. [DOI] [PubMed] [Google Scholar]
- Rodrat S, Yamanont P, Tankanitlert J, Chantraraksri U, Fucharoen S, Morales NP. Comparison of pharmacokinetics and urinary iron excretion of two single doses of deferiprone in β-thalassemia/hemoglobin E patients. Pharmacology. 2012;90:88–94. doi: 10.1159/000339658. [DOI] [PubMed] [Google Scholar]
- Renal Impairment Working Group. 1998. U.S. Department of Health and Human Services. Food and Drug Administration. Guidance for Industry Pharmacokinetics in Patients with Impaired Renal Function – Study Design, Data Analysis, and Impact on Dosing and Labeling. Available at http://www.fda.gov/downloads/Drugs/…/Guidances/UCM204959.pdf (last accessed 20 January 2014)
- Efficacy Working Party. Committee for medicinal products for human use (CHMP). European Medicines Agency. 2004. Note for guidance on the evaluation of the pharmacokinetics of medicinal products in patients with impaired renal function. Available at http://www.ema.europa.eu/docs/en_GB/document_library/Scientific_guideline/2009/09/WC500003123.pdf (last accessed 20 January 2014) [DOI] [PubMed]
Associated Data
This section collects any data citations, data availability statements, or supplementary materials included in this article.
Supplementary Materials
Figure S1 Goodness-of-fit. Left upper panel shows the population prediction (PRED) vs. observed concentration values (DV). Right upper panel shows individual predictions (IPRE) vs. observed concentration values (DV). Left lower panel shows conditional weighted residuals (CWRES) vs. population predictions (PRED). Right lower panel shows conditional weighted residuals (CWRES) vs. time (TIME). Solid line represents the identity line
Figure S2 Normalized prediction distribution errors