

Abstract
Background
Telomeres are tandem repeats of sequences present at the end of the chromosomes that maintain chromosomal integrity. After repeated cell division, telomeres shorten to a critical level, triggering replicative senescence or apoptosis, which is a key determinant of cellular ageing. Short telomeres also contribute to genome instability and are a hallmark of many cancers. There are several methods for estimating telomere length (TL) from extracted DNA samples. Southern blot is accurate but requires a large quantity of DNA and is expensive. qPCR is cost-effective and requires a small quantity of DNA and is therefore widely used for large-scale epidemiological studies; however, typically requires triplicates. We describe a novel multiplexed probe-based non-PCR method for TL measurement.
Methods
A small amount of DNA (∼50ng) is hybridized to telomere repeat sequence-specific probes (T) and a reference single gene probes (R). T and R signals are detected from a single reaction well containing the same input DNA. Branching DNA technology is used to amplify the signal which is detected by Luminex technology.
Results
The intra- and inter-assay CV (∼3% and ∼5% respectively) shows the precision of the new assay and the measurements from single well correlated well with traditional single-plex qPCR run in triplicate (r=0.7 to 0.8). The assay was also validated in an independent set of samples using Southern blot (r=0.74).
Conclusion
We describe a novel assay for TL assessment using Luminex platform.
Impact
This may offer an alternative cost-efficient way to study TL in extracted DNA samples.
Keywords: Telomere length assay, Luminex, QuantiGene Plex chemistry
Introduction
Telomeres are tandem repeat sequences (TTAGGG) present at the end of chromosomes and are responsible for protecting chromosomal integrity[1]. After repeated cell divisions, telomeres shorten to a critical level, triggering replicative senescence or apoptosis, which is key determinant of cellular aging[2]. Cancer cells maintain short and stable telomeres, often by activating telomerase, enabling uncontrolled proliferation[3]. Critically short telomere length (TL) contributes to genome instability and carcinogenesis[4-6]. TL is shorter in leukocytes of patients with chronic heart failure, atherosclerotic disease[7] and myocardial infarction[8] and Non Hodgkin lymphoma[9]. A meta-analysis also suggests association of TL and risk for various cancer types[10]. Currently available methods for TL measurement are discussed by Aubert et al[11]. In 1990 Harley et al. measured fibroblast telomere by Southern blot[2] and subsequently Kimura et al established a standard protocol[12]. Other methods used are quantitative fluorescence in situ hybridization (Q-FSH) was developed by Lansdrop et al in 1996[13]. Cawthon et al, in 2002 developed qPCR method for simple, rapid, and high-throughput measurement of TL[14]. In 2009 Richard Cawthon improved the assay by multiplexing to reduce variation[15]. In 2011, O'Collaghan et al developed another modification of the qPCR method to measure absolute TL[16]. Mainly because of cost-efficiency and low DNA requirements, most large-scale studies use the qPCR method for telomere measurement. In this paper, we describe a novel probe-based non-PCR assay for TL assessment using QuantiGene plex (QGP) chemistry on Luminex platform.
Material and Methods
Genomic DNA was extracted from whole blood of 70 adults and six children using FlexiGene DNA kit (Qiagen).
We used Affymetrix-Panomics QuantiGene Plex (QGP) chemistry for a DNA copy number assay using custom designed probes to measure abundance of the telomere repeat sequence on Luminex platform. The principle of the assay is described elsewhere (http://www.panomics.com/products/dna-copy-number/dna-multiplex-assay/how-it-works). In summary, fluorescent Luminex microbeads with capture probes (CP) are used to capture DNA molecules. For the each DNA target, two target-specific probe sets are designed (see figure-1): (a) Capture extenders (CE) and (b) Label extenders (LE) and blocker (BL) probes. CE has two parts - one part is complementary to the CP sequence on the bead and the other part is complementary to the target DNA sequence that is interrogated. LE has two parts - one is complementary to the target DNA sequence and the other is complimentary to the “pre-amplifier”. The target-specific regions of CE, LE and BL hybridize to contiguous sequences of the target DNA. The preamplifier binds with multiple biotinylated amplifiers. Each amplifier provides multiple hybridization sites for biotinylated label probes that bind Streptavidin R-Phycoerythrin (SAPE) producing fluorescent signals. The signal intensities from the luminex bead and the conjugated SAPE are read on a Luminex 200 instrument. The signal is reported as median fluorescent intensity (MFI) and is proportional to the number of target sequences in the sample. This assay allows multiplexing up to 33 DNA targets in a single well. The probes (both CE and LE) for the telomeric region were designed to target the repeats “TTAGGG”. The 24-mer probe was targeted against 4 repeats – “TTAGGGTTAGGGTTAGGGTTAGGG”. For reference single gene, we used ALK which showed very stable copy number (CN=2) in all the DNA samples detected by oligonucleotide based microarray SNP chips for our previous study (data not shown).
Figure 1.
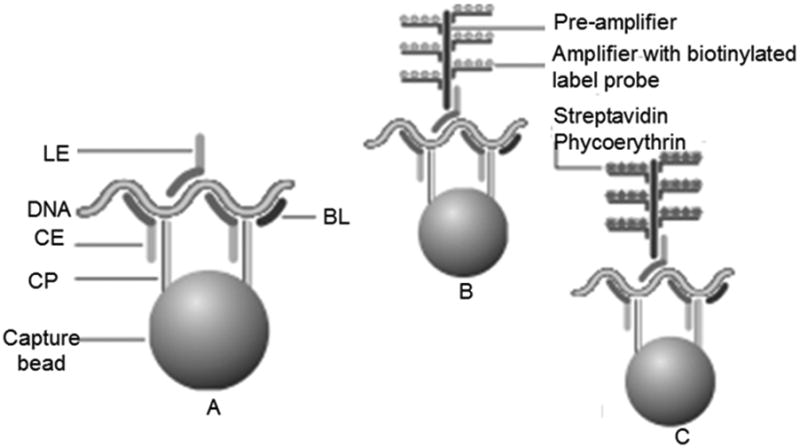
Schematic diagram for the QGP assay. Modified from http://www.panomics.com/products/dna-copy-number/dna-multiplex-assay/how-it-works CP: capture probe; CE: capture extender; LE: label extender; BL: blocking probe. (A) hybridization step: luminex bead capturing the target DNA sequence with the sequence-specific probes; (B) addition of preamplifiers and amplifiers; (C) binding of Streptavidin R-Phycoerythrin (SAPE) producing fluorescent signals.
Assay Optimization
As per manufacture's protocol for the QGP DNA-plex assay, the samples need to be sonicated to get the fragment size up to 500 base pair to improve hybridization efficiency. We faced several technical issues with sonication: (1) With Misonix XL-2000 Sonicator with 1/8 inch probe fragmenting the DNA samples one by one in a single tube is a tedious job for large sample size and require 2-3 times more DNA due to evaporation during sonication; (2) When we tried to fragment DNA in a plate in Episonic Bioprocessor the fragmentation size varied depending on the location of the sample in the plate; (3) Fragmentation improved the signal intensity for the reference gene but it reduced the signal intensity for telomere perhaps due to preferential fragmentation of telomeric region (data not shown). As telomere is the region of interest for this assay, we modified the assay by omitting DNA fragmentation. To improve the signal from reference gene, we increased the number of target-specific probes (CE and LE) to hybridize over a larger span of genomic regions.
Protocol
We used a control DNA as a standard (400ng, 200ng, 100ng, 50ng, 25ng, 12.5ng and 6.25ng per well) in triplicates with background wells. In Plate-A, we ran 30 unique samples and each DNA was used twice, at 50ng and 100ng per well. In Plate-B, the same 30 samples were run after 2 weeks but with 50ng/well and 25ng/well. In Plate-C, we ran independent set of 23 samples in triplicates at varying input ∼50ng-100ng/well and similarly another set of 23 samples were run in Plate-D.
DNA samples were diluted to 1.25ng/μl. Then the 40 ul sample was mixed with 18 μL Lysis mixture, 5 μL Probe set, and 5 μL of 2.5M NaOH. The mix was incubated for 30 minutes at room temperature followed by neutralization by 12 μl buffer provided in the kit. The bead mix was made for 96 well plate (per well Nuclease free water 1.8 μl, Lysis mixture 15 μl, Blocking reagent 2 μl, Proteinase K 0.2 μl and Capture Beads 1μl) and dispensed in the hybridization plate. The sample mix was added to the hybridization plate and was put on a shaking incubator for 20 hours at 54°C.
The following day, the plate was taken out of the incubator and after a quick spin the whole content was transferred to magnetic separator plate and put on a magnetic washer bed. After 5 minutes, the supernatant was dumped, and the plate was washed three times with the freshly prepared wash buffer. Then 100 μl preamplifier (36 μl preamplifier in 12 ml diluent) was added per well and the plate was incubated for 1 hour at 50°C.
The plate was washed on a magnetic washer bed three times with wash buffer. Then 100 μl of amplifier (36 μl amplifier in 12 ml diluent) was added per well and incubated for 1 hour at 50°C. After similar wash, 100 μl of label probe (36 μl Label probe in 12 ml of diluent) was added, and the plate was incubation again in a similar fashion. The next step was to bind the sample with SAPE. After a similar wash, 100 μl SAPE (36 ul SAPE in 12 ml diluent) was added to each well. The plate was then incubated in a shaker incubator at 600 rpm for 30 min at room temperature. After the binding was done, the plate was washed as before and SAPE buffer was added. After shaking the plate for 3 minutes at room temperature, the plate was read on a Luminex200 reader.
Statistical Analysis
The raw intensity data from Luminex instrument was processed using the Exponent software to generate the median fluorescent intensity (MFI) data. The MFI values were imported into the Miliplex Analyst software to generate a standard curve using the 5-parametric logistic (5PL) curve[17, 18].
For standard qPCR, we followed Cawthon's method [14]. For qPCR index of a given sample, the standard delta delta CT method was used and then expressed as % of the same control DNA sample run in the same plate. The same control DNA was also used for QGP assay. For validation with Southern blot in an independent set of DNA samples, we used the measurements from previously published paper by Aviv et. al [19] using standard Southern blot protocol established earlier by the same group [12]. Coefficient of variation (cv%) was calculated using standard formula: standard deviation/mean.
Results
The standard curves using the MFI data (figure-2) show the linear range for both telomere and reference gene (ALK) probe. We expressed the relative TL in two ways: (a) Telomere Quantity Index (TQI) - ratio of quantity of DNA measured by Telomere probe and by Reference gene probe and (b) Telomere Intensity Index (TII) (described later). For each sample the quantity of DNA in each well is calculated against a standard curve from a “control DNA sample” that is run for each plate. Therefore, the TQI represents TL in a sample relative to the “control DNA” and this measured ratio is supposed to account for plate-to-plate variation in intensity measurement. For the TII, we first make the telomere probe intensity correction for quantity of input DNA (measured by the probe for the reference gene) and then the mathematically corrected intensity of the sample is compared to that of the “control DNA sample” run in each plate. Therefore, this normalization also should account for plate-to-plate variation.
Figure 2.
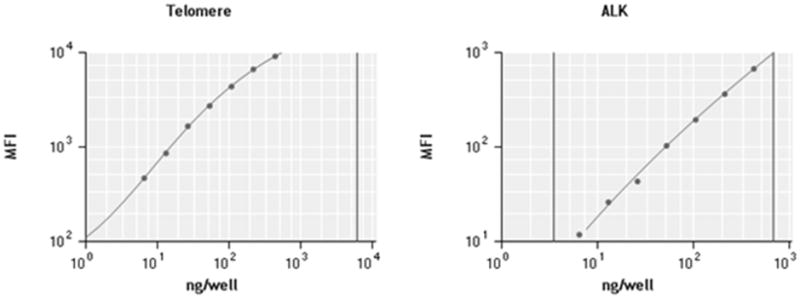
Standard curve for telomere (on the left) and reference gene-ALK (on the right). X-axis represents DNA in ng/well and y-axis represents the median fluorescent intensity (MFI)
How does the assay work compared to standard qPCR method?
Table-1 shows the correlation between the QuantiGene assay (run in single well) and standard qPCR method (mean from triplicates) using the published primer set[14]. The assay did not work in only one well in plate A (with ∼100 ng input DNA) and one well in plate B (with ∼50 ng input DNA) due to technical failure with low bead count and/or low input DNA. Both the measurements (TQI and TII) of the QuantiGene assay from different settings correlated well with the qPCR data (correlation coefficient “r” from 0.70 to 0.83) except the TQI from 25ng input DNA (r=0.5697). Figure-3 shows that the assay correctly detects longer TL in children DNA samples compared to adult DNA.
Table 1. Correlation between QGP assay and qPCR.
| Plate | Input DNA | QGP measurement | qPCR measurement | Correlation coefficient r |
|---|---|---|---|---|
| Plate-A | 50ng (n=30) | TQI | qPCR Index | 0.7086 |
| 100ng (n=29) | TQI | qPCR Index | 0.8068 | |
| Plate-B | 50ng (n=29) | TQI | qPCR Index | 0.7060 |
| 25ng (n=30) | TQI | qPCR Index | 0.5697 | |
| Plate-A | 50ng (n=30) | TII | qPCR Index | 0.7461 |
| 100ng (n=29) | TII | qPCR Index | 0.8257 | |
| Plate-B | 50ng (n=29) | TII | qPCR Index | 0.7378 |
| 25ng (n=30) | TII | qPCR Index | 0.7161 |
TQI: Telomere Quantity Index; TII: Telomere Intensity Index
Figure 3.
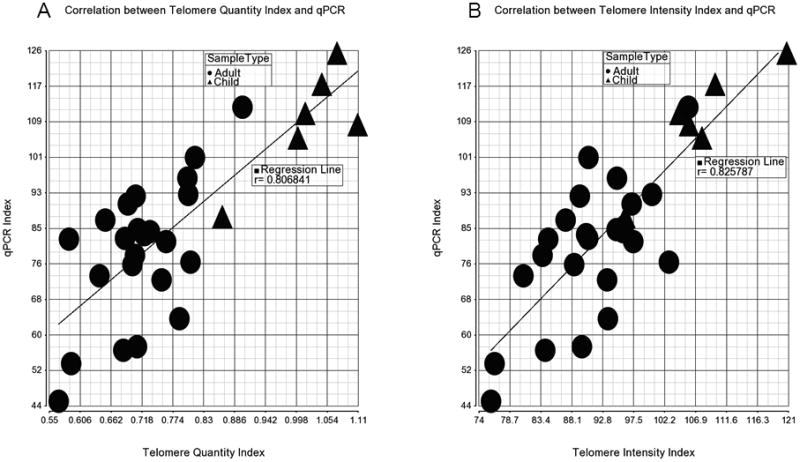
Correlation of the QGP assay measurements (telomere quantity index on the left and telomere intensity index on the right) with conventional single-plex qPCR index.
How does the assay work with different input amount of DNA?
We have compared the single measurements from input of ∼50 ng/well and ∼100 ng/well in the same plate (plate A) from 29 unique samples. The geometric mean of intra-plate CV (between ∼50ng and ∼100ng input DNA) for TQI and TII were 3.03% and 6.52% respectively. (see Table-2)
Table 2.
Precision of the QGP assay for telomere length measurement.
| QGP: comparison between | Geometric Mean | Arithmatic Mean | Median | |
|---|---|---|---|---|
| 50ng vs100ng input | cv% of TQI | 3.03 | 4.63 | 3.43 |
| cv% of TII | 6.52 | 8.11 | 8.45 | |
| InterPlate 50ng input | cv% of TQI | 4.97 | 6.40 | 5.12 |
| cv% of TII | 2.93 | 4.48 | 4.19 | |
| IntraPlate | cv% of TQI | 5.96 | 7.07 | 6.92 |
| cv% of TII | 3.77 | 5.02 | 4.98 |
Inter-plate variation for the assay
We compared the single measurements from ∼50 ng input DNA from two different plates (plate A and plate B run more than two weeks apart) for 29 unique samples. The geometric mean of inter-plate CV for TQI and TII were 4.97% and 2.93% respectively (see Table-2).
Intra-plate variation among the triplicates
To assess the precision of the assay, we tested the results from triplicates (in the same plate) of independent set of 46 unique samples. This time the DNA samples were not normalized to achieve similar concentration for all samples to get uniform input quantity. Triplicates of 23 samples were accommodated in Plate-C and triplicates of other 23 samples were run in Plate-D. The geometric mean of intra-plate CV of the triplicates for TQI and TII were 5.96% and 3.77% respectively (see Table-2).
From the calculated DNA input amount in each well using the reference gene probe, we could measure the CV of pipetting accuracy (as the DNA sample is the same, the variation in quantity is supposed to be due to the variation in volume pipetted in the triplicate wells for each sample). It was interesting to note that the geometric mean CV for pipeting accuracy was 6.92% (see supplementary figure 1A). It may be noted that this variation in pipetting volume could potentially affect the traditional single-plex qPCR result as the telomere and reference gene are amplified in different wells.
Is the correlation between QuantiGene assay and qPCR reproducible in different set of samples?
From the triplicates, we calculated the mean of TQI for each of this second independent set of 46 unique samples and correlated with qPCR results. Almost similar level of correlation (r=0.69) was seen without plate-effect (see supplementary figure 1B) as we found in case of results from single well measurement and qPCR in the first set of 29 samples.
How does the assay work compared to multiplex qPCR method?
The assay showed reasonable correlation (r=0.55, see supplementary figure 2A) to the multiplexed qPCR invented by Cawthon RM [15].
How does the assay work compared to the gold standard Southern blot method?
We carried out the newly developed QGP assay for TL measurement twice on an independent set of 50 DNA samples (shipped from Steven Hunt's laboratory) in a blinded way. The same DNA samples were used by Aviv et al in their comparative study published in 2011 [19]. Our assay showed strong correlation of Telomere Intensity Index (mean of two measurements) with the Southern blot analysis of the length of the terminal restriction fragments (TRF) of chromosomes (also mean of two measurements; r=0.74, see suppl. Figure 2B). The details of the study will be presented in a different paper focusing on blinded comparison between the QGP and the Southern Blots, in a similar way as described by Aviv et. al where they compared qPCR and Southern blots [19].
Discussion
The conventional single-plex qPCR assay[14] for TL measures telomere (T) signals and single copy reference gene (R) signals in separate wells, in comparison to a reference sample, to yield relative T/R ratios that are proportional to average TL. Therefore variation in the amount of DNA in T and R well can potentially contribute to inaccurate T/R. This issue was resolved in multiplex qPCR invented by Richard Cawthon [15]. We have developed a telomere repeat-specific probe-based, non-PCR multiplexing assay where the telomere probe (T) and reference gene probe (R) are detected simultaneously by Luminex-based technology from the same well. In this assay we avoid PCR amplification where the T and R probes are on magnetic beads and the intensity from the probes is amplified by branching DNA technology. The median fluorescent intensity is measured from a minimum of 100 beads. Regarding throughput, a total of 69 DNA samples can be processed in a single 96-well plate (standards and control samples would take the remaining wells) and 4 such plates (276 samples) can be easily processed in a week. As this is not a PCR- based assay, it is free of PCR amplification biases. Like Q-FISH and Flow-FISH, another major advantage of this assay is the specificity of the CE and LE probes to the telomeric repeats, avoiding measurement of the non-canonical sub-telomeric region that confounds the southern blot method [11, 12]. Regarding limitation, the assay may not work for fragmented DNA samples and may be inaccurate with lower than 50 ng of total DNA per sample.
In the present study, our method correlates well with the widely-used qPCR measurement as well as southern blot method. Intra-plate CV is low and therefore unlike qPCR, triplicates are not essential for this assay. The inter-plate CV% is reasonable for precision. Compared to the Southern blot assay (requiring 3 micro gram of high quality DNA), TL can be assayed from just 50 ng of DNA using our method. Reagent cost per sample is significantly lower than Southern blot and comparable to qPCR. Luminex technology has been used for quite some time for various applications, such as quantification of RNA levels; however, to our knowledge we are the first to use QGP chemistry for TL measurement using this Luminex platform. This novel assay for TL assessment offers an alternative cost-efficient strategy to study TL. In the future, integrating measurements of synthetic oligonucleotides or cell line DNA with known TL can enable absolute quantification of TL using this technology.
Supplementary Material
Acknowledgments
Financial Support and Acknowledgement: The work was supported by R01ES020506 (Brandon Pierce) and R01CA107431 (Habibul Ahsan). This paper is subject to the NIH Public Access Policy. The authors would like to thank Dr. Yunqing Ma from Panomics-Affymetrix, for his help in assay development, Dr. Joseph Graziano of Columbia University, New York for providing the children DNA samples, Dr. Abraham Aviv of University of Medicine and Dentistry of New Jersey for sharing the southern blot data of his previous publication, and to Dr. Steven C Hunt from Cardiovascular Genetics Division of University of Utah School of Medicine, Salt Lake City, Utah for providing the fifty DNA samples for validation of the assay.
Footnotes
Conflicts of Interest: There are no conflicts of interest to disclose.
References
- 1.Blackburn EH. Structure and function of telomeres. Nature. 1991;350:569–73. doi: 10.1038/350569a0. [DOI] [PubMed] [Google Scholar]
- 2.Harley CB, Futcher AB, Greider CW. Telomeres shorten during ageing of human fibroblasts. Nature. 1990;345:458–60. doi: 10.1038/345458a0. [DOI] [PubMed] [Google Scholar]
- 3.Oh BK, Kim YJ, Park C, Park YN. Up-regulation of telomere-binding proteins, TRF1, TRF2, and TIN2 is related to telomere shortening during human multistep hepatocarcinogenesis. Am J Pathol. 2005;166:73–80. doi: 10.1016/S0002-9440(10)62233-X. [DOI] [PMC free article] [PubMed] [Google Scholar]
- 4.Boardman LA, Johnson RA, Viker KB, Hafner KA, Jenkins RB, Riegert-Johnson DL, et al. Correlation of chromosomal instability, telomere length and telomere maintenance in microsatellite stable rectal cancer: a molecular subclass of rectal cancer. PLoS One. 2013;8:e80015. doi: 10.1371/journal.pone.0080015. [DOI] [PMC free article] [PubMed] [Google Scholar]
- 5.Zhang Y, Shen J, Ming W, Lee YP, Santella RM. Telomere length in hepatocellular carcinoma and paired adjacent non-tumor tissues by quantitative PCR. Cancer Invest. 2007;25:668–77. doi: 10.1080/07357900701561024. [DOI] [PubMed] [Google Scholar]
- 6.O'Sullivan RJ, Karlseder J. Telomeres: protecting chromosomes against genome instability. Nat Rev Mol Cell Biol. 2010;11:171–81. doi: 10.1038/nrm2848. [DOI] [PMC free article] [PubMed] [Google Scholar]
- 7.van der Harst P, van der Steege G, de Boer RA, Voors AA, Hall AS, Mulder MJ, et al. Telomere length of circulating leukocytes is decreased in patients with chronic heart failure. J Am Coll Cardiol. 2007;49:1459–64. doi: 10.1016/j.jacc.2007.01.027. [DOI] [PubMed] [Google Scholar]
- 8.Zee RY, Michaud SE, Germer S, Ridker PM. Association of shorter mean telomere length with risk of incident myocardial infarction: a prospective, nested case-control approach. Clin Chim Acta. 2009;403:139–41. doi: 10.1016/j.cca.2009.02.004. [DOI] [PMC free article] [PubMed] [Google Scholar]
- 9.Widmann TA, Herrmann M, Taha N, Konig J, Pfreundschuh M. Short telomeres in aggressive non-Hodgkin's lymphoma as a risk factor in lymphomagenesis. Exp Hematol. 2007;35:939–46. doi: 10.1016/j.exphem.2007.03.009. [DOI] [PubMed] [Google Scholar]
- 10.Wentzensen IM, Mirabello L, Pfeiffer RM, Savage SA. The association of telomere length and cancer: a meta-analysis. Cancer Epidemiol Biomarkers Prev. 2011;20:1238–50. doi: 10.1158/1055-9965.EPI-11-0005. [DOI] [PMC free article] [PubMed] [Google Scholar]
- 11.Aubert G, Hills M, Lansdorp PM. Telomere length measurement-caveats and a critical assessment of the available technologies and tools. Mutat Res. 2012;730:59–67. doi: 10.1016/j.mrfmmm.2011.04.003. [DOI] [PMC free article] [PubMed] [Google Scholar]
- 12.Kimura M, Stone RC, Hunt SC, Skurnick J, Lu X, Cao X, et al. Measurement of telomere length by the Southern blot analysis of terminal restriction fragment lengths. Nat Protoc. 2010;5:1596–607. doi: 10.1038/nprot.2010.124. [DOI] [PubMed] [Google Scholar]
- 13.Lansdorp PM, Verwoerd NP, van de Rijke FM, Dragowska V, Little MT, Dirks RW, et al. Heterogeneity in telomere length of human chromosomes. Hum Mol Genet. 1996;5:685–91. doi: 10.1093/hmg/5.5.685. [DOI] [PubMed] [Google Scholar]
- 14.Cawthon RM. Telomere measurement by quantitative PCR. Nucleic Acids Res. 2002;30:e47. doi: 10.1093/nar/30.10.e47. [DOI] [PMC free article] [PubMed] [Google Scholar]
- 15.Cawthon RM. Telomere length measurement by a novel monochrome multiplex quantitative PCR method. Nucleic Acids Res. 2009;37:e21. doi: 10.1093/nar/gkn1027. [DOI] [PMC free article] [PubMed] [Google Scholar]
- 16.O'Callaghan NJ, Fenech M. A quantitative PCR method for measuring absolute telomere length. Biol Proced Online. 2011;13:3. doi: 10.1186/1480-9222-13-3. [DOI] [PMC free article] [PubMed] [Google Scholar]
- 17.Gottschalk PG, Dunn JR. The five-parameter logistic: a characterization and comparison with the four-parameter logistic. Anal Biochem. 2005;343:54–65. doi: 10.1016/j.ab.2005.04.035. [DOI] [PubMed] [Google Scholar]
- 18.Ricketts JH, Head GA. A five-parameter logistic equation for investigating asymmetry of curvature in baroreflex studies. Am J Physiol. 1999;277:R441–54. doi: 10.1152/ajpregu.1999.277.2.R441. [DOI] [PubMed] [Google Scholar]
- 19.Aviv A, Hunt SC, Lin J, Cao X, Kimura M, Blackburn E. Impartial comparative analysis of measurement of leukocyte telomere length/DNA content by Southern blots and qPCR. Nucleic Acids Res. 2011;39:e134. doi: 10.1093/nar/gkr634. [DOI] [PMC free article] [PubMed] [Google Scholar]
Associated Data
This section collects any data citations, data availability statements, or supplementary materials included in this article.