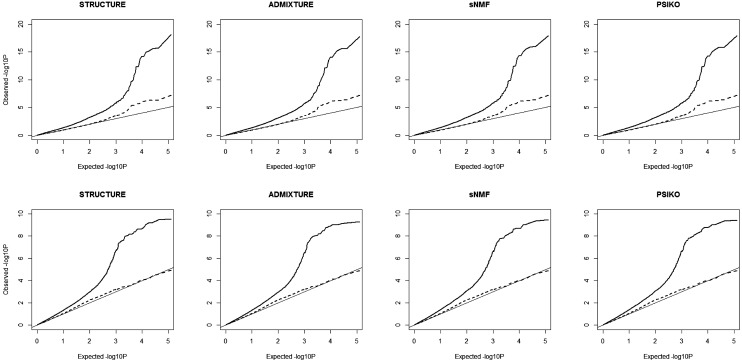
Figure 4.
QQ plots illustrating population structure corrections using the four methods in genome-wide association studies (GWAS) analysis of two traits in the 84 lines Brassica napus panel, erucic acid (A) and seed glucosinolate content (B). The expected −log10 P (x-axis) are plotted against those observed (y-axis) from either a general linear model (solid lines) using population structure correction only and a mixed linear model (dashed lines) with population structure and relatedness corrections. The diagonal line is a guide for the perfect fit to the expected −log10 P-values.

