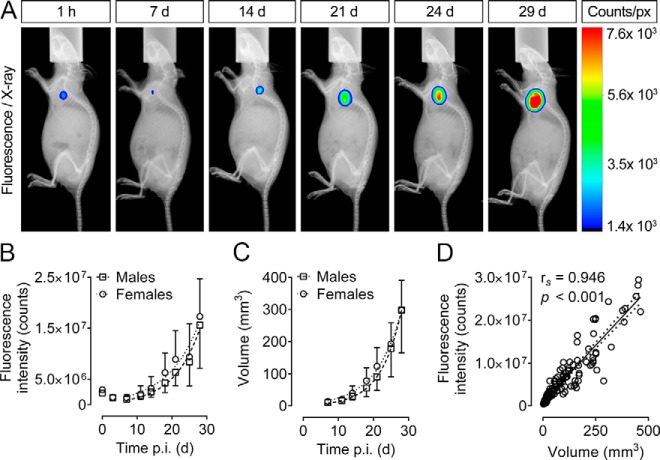
Figure 2.
Progression of sc tumors in male and female nude mice after sc injection of 2 × 10⁶ MPC-mCherry cells. A, Overlays of x-ray and fluorescence images (λEx/Em = 600/700 nm) of a representative animal at 1 h to 29 d post injection. B, Tumor fluorescence intensities in vivo over time. C, Tumor volumes over time; data are presented as mean ± SD, (male animals, n = 10; female animals, n = 10). D, Correlation analysis between tumor volume and tumor fluorescence intensity; n = 20; confidence interval, 95%; number of XY pairs, 136; p.i., post injection; px, pixel.

