Introduction
Advanced magnetic resonance imaging (MRI) techniques such as MR spectroscopy (MRS), diffusion and perfusion MRI allow for a diverse range of multidimensional information regarding brain tumour physiology to be obtained in addition to the traditional anatomical images [1, 2]. While it is well documented that MRI of rodent brain tumor models also plays an important role in the basic research and drug discovery process of new brain tumor therapies [3–6], the role animal models have played in translating these methodologies is rarely discussed in such reviews. Even in consensus reports [7, 8] outlining the pathway to validation of these techniques the use of animal models is given scant regard. This is despite the fact that the use of rodent cancer models to test advanced MRI techniques predates [9] and was integral to the development of clinical MRI. It is the aim of this review to highlight just how integral pre-clinical imaging is to the discovery, development and validation of advanced MRI techniques for imaging brain neoplasms.
From almost the moment MRI was commercially available, the potential for it to be become an indispensable tool central to the multidisciplinary planning of individualized brain tumour patient management was recognized [10]. The inherent high resolution and exquisite soft tissue contrast of MRI allows Radiologists, Pathologists, Neurosurgeons, Neuro-oncologists and Radiation Oncologists to gain an understanding of the three dimensional morphological problem they are faced with on a patient by patient basis. Paralleling this, many in the research community (clinical and basic science) have been exploring the role “advanced MRI” techniques may play in investigating the structural, functional and metabolic nature of the brain tumor micro-environment. This has been brought about by a desire by clinical researchers and pharmaceutical companies to have access to early and non-invasive biological information that can predict outcome and/or quantify therapeutic efficacy. While there are others, the most common and most developed techniques can be classified into three main categories:
Magnetic Resonance Spectroscopy (MRS) for quantifying cell metabolites.
Perfusion MRI for quantifying tissue hemodynamics (blood volume, flow and vessel permeability).
Diffusion MRI for quantifying tissue structure and microenvironment (cell density and white matter tractography).
These technologies are currently being investigated as biomarkers for early diagnosis, for predicting outcome in response to specific therapies and to monitor therapeutic efficacy. The pathway to clinical and regulatory acceptance of MRI biomarkers is not entirely transparent. A biomarker needs to find a niche role in improving patient outcome and/or reducing costs in a clinical setting. For utilization in the drug discovery process a biomarker needs to significantly improve a clinical trial of a new therapy either by quantifying efficacy, aiding in patient selection, or helping with “go or no go” decisions. Demonstrating this is not trivial and goes beyond clinical or scientific studies. However, what is necessary is that before a biomarker can be accepted as a “surrogate marker” it must go through a process of validation and qualification [11] through numerous scientific and clinical studies. In terms of validating biomarkers as surrogate endpoints in oncology research and drug discovery it is necessary to establish strong scientific evidence of the biological mechanism involved, acceptable analytical characteristics (sensitivity, specificity, reproducibility and accuracy), and clinical feasibility [12]. Just like new therapeutic agents must be shown to improve the outcome of patients through regulated clinical trials, ultimately for acceptance much of this validation must occur in the clinical setting by correlating biomarkers with clinical outcome. This process is extremely expensive, time consuming, and it is often not ethical or possible to quantify image biomarker standardisation and robustness through repeatability and dose dependent experiments on patients alone.
To this end, pre-clinical imaging of brain tumour animal models has and will for some time play a vital role in the validation of numerous MRI biomarkers. It is the intention of this review to demonstrate by example how and why pre-clinical imaging is important to the validation of and our fundamental understanding of each imaging biomarker. While it is not possible to cover all potential brain tumour imaging biomarkers, it is hoped that by covering diffusion MRI, perfusion MRI and MRS it is possible to show the immense impact of preclinical imaging, across all four classes of biomarker, on the translation from biomarker concept to a clinically useful surrogate endpoint.
Magnetic Resonance Spectroscopy
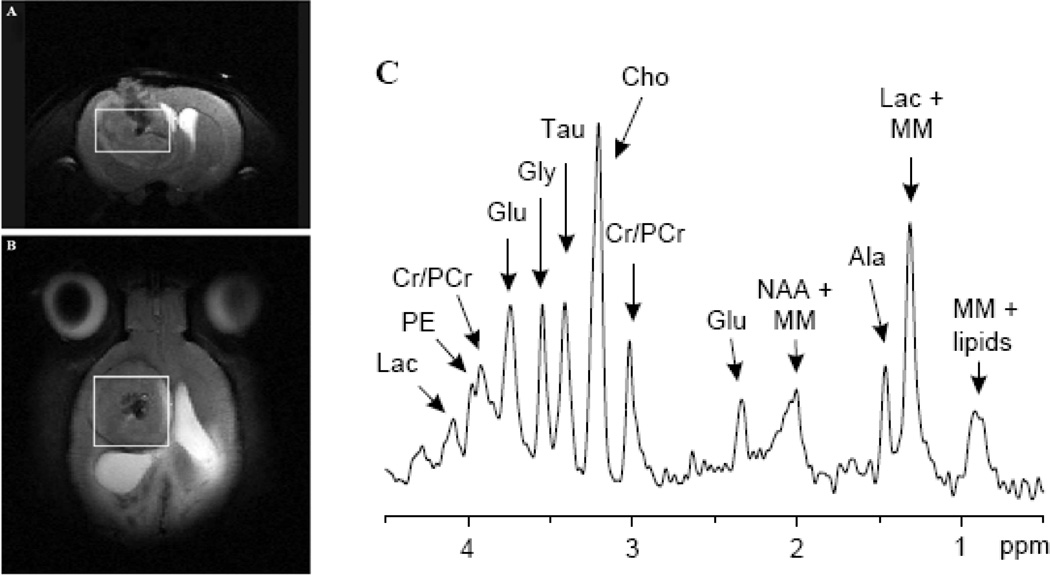
In vivo MRS is an MR technique that allows for the detection of cellular metabolites whose protons have different magnetic resonance frequencies from the surrounding water protons [13]. The MRS data is acquired from either large single voxels localized by traditional MRI images (Fig. 1 a and b) or from multiple voxels similar to traditional MR images. The data is usually presented in the form of a spectrum (Fig. 1c). Each peak represents the relative abundance of protons with different resonant frequencies caused by differences in their local magnetic field. The unique chemical structure of various metabolites results in differing local magnetic fields experienced by their protons and thus resulting in a unique ‘finger print’ like MRS signature. Since MRS can be acquired from both human and rodent tumors it can be an excellent translational research tool/biomarker for quantification and imaging of tumor metabolism.
Fig. 1. Proton MRS of a 9L gliosarcoma in the rat brain acquired using a 9.4 T MRI scanner.
The location of the MRS voxel is shown on the coronal (A) and axial (B) T2 weighted images. (C) The MRS spectrum showing the metabolic signature of this brain tumor model including: Lactate (Lac), phosphorylethanolamine(PE), Creatine (Cr), Phospho- Creatine (PCr), Glutamate (Glu), Glycine (Gly), Taurine (Tau), Choline (Cho), N-Acetyl Aspartate (NAA), macromolecule (MM). Courtesy of Garwood et al. [19]
Investigation of brain tumor metabolism by MRS is one of the oldest clinical research applications of MR and predates [14–16] the availability of clinical MRI scanners. Initially phosphorous MRS was the most widely used technique as it allowed for the quantification of high energy phosphate metabolism [16] as a biomarker of tumor hypoxia [14]. However, since the introduction of clinical scanners, proton MRS has become the most popular MRS technique as it allows for assessment of tumor metabolites using standard clinical MRI scanners and radiofrequency coils. Preceding the publication of the first clinical MRS results [17] was a MRS study of the well characterized C6 rat glioma model by Remy et al. 18]. In this study the authors were able to resolve several different MRS resonance peaks, identifying five different metabolites: N-actyl aspartate (NAA), lactate, lipid, choline (cho) and creatine (cr). Although it is now possible to quantify more than ten important tumor metabolites (Fig. 1) with modern MRI scanners [19], these original five MRS biomarkers are still the most commonly quantified. In addition to identifying these MRS peaks, this early study showed that the relative lactate, lipid and cho signals increased, while NAA and cr decreased with increasing tumor burden. This established a link between MRS and tumor biology thereby demonstrating that MRS had the potential to become an important non-invasive biomarker of tumor malignancy. Shortly thereafter, early clinical results [17, 20] showed that tumors had significantly different metabolic profiles compared to healthy brain tissue when measured by MRS. However, these significant differences between benign and malignant tumors was not universal [20]. This prompted animal studies of various rodent brain tumor models [21–24] to investigate the biological phenomena that was being quantified by MRS. As a result of these studies it was identified that MRS measures of tumor metabolism were extremely heterogeneous [21], and brain tumors were overall lower metabolism compared to normal brain tissue contralateral to the tumor [22]. This correlated with decreased tumor metabolism independently measured by bioluminescent quantification of tumor ATP, lactate and glucose distributions [22]. Paralleling the clinical results it was shown that the MRS tumor metabolic profile was unable to differentiate different types of tumor models [24] or stage of development [22].
Despite the lack of specificity of MRS to predict tumor grade, these early animal experiments showed that MRS was still a potentially important biomarker because it had the ability to quantify tumor metabolic progression and/or therapeutically induced change in tumor metabolism. In a 9L gliosarcoma model it was shown that MRS could reproducibly quantify decreased tumor metabolism associated with an efficacious cytotoxic agent [23].
Diffusion MRI
Diffusion MRI is an application of MRI that allows for the quantification and imaging of the random Brownian motion of water molecules within the cellular or tissue microenvironment [25]. At first inspection this may not seem like an important biophysical property that could aid in the assessment of malignant brain tumors. However, it is emerging as a very important imaging biomarker of therapeutic efficacy [26], tumor invasion [27–29] and for tracking white matter fibre connectivity [30]. The reason is that the cellular environment causes this diffusion to be restricted by amongst other things cell membranes, and thus diffusion MRI can be utilized as a measure of cellular status and cytoacrchitecture [31].
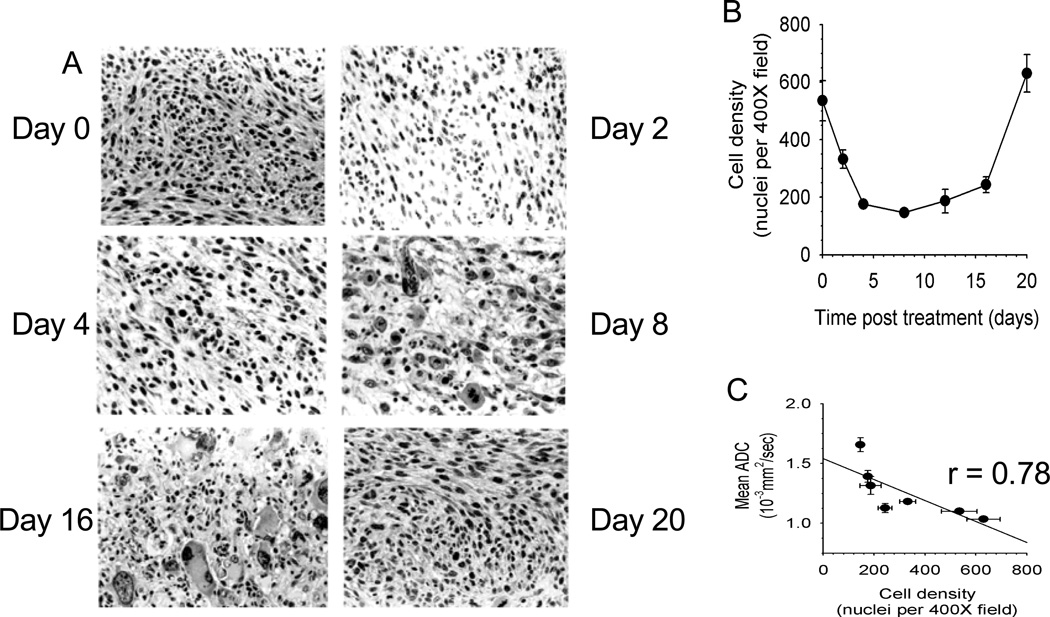
While diffusion weighted MRI is often used clinically, the diffusion process can also be quantified by calculating the apparent diffusion coefficient (ADC) which when determined on a voxel-wise basis can generate a quantitative image. In such representations of ADC the membrane dense gray and white matter is hypo-intense compared to the cerebrospinal fluid. Analogous to MRS, it was the results of ADC measurements [32] of rodent brain tumours that demonstrated that diffusion MRI was a potential early biomarker of therapeutic efficacy. This change in ADC was then subsequently shown (Fig. 2) to correlate with increased extracellular space and predict volumetric tumor shrinkage in a 9L gliosarcoma model receiving 1,3-bis(2-chloroethyl)-1-nitrosourea (BCNU: 13.3 mg/kg) treatment [33]. In a more thorough follow-up study a dose dependent assessment of ADC change was performed in this rodent/chemotherapy model in parallel with clinical feasibility studies of the potential for ADC change to predict patient response to chemo/radiation therapy [34]. From these results it was shown empirically that ADC was negatively correlated with cell density, and that ADC increased and cell density decreased significantly in a dose dependent manner prior to changes in volumetric reduction in tumor size. Interestingly, tumor progression following therapy caused by repopulating tumor cells also caused a substantial decrease in ADC before volumetric progression was measurable.
Fig. 2. Correlation of diffusion MRI changes with histopathological changes in a 9L brain tumor model treated with BCNU chemotherapy.
(a) Haematoxylin and Eosin stained histology slides showing a decrease in cell density four days following chemotherapy. As the tumor repopulates, an increase in cell dencity at day 16 is observed (b) A plot of cell density as a function of time post-therapy. (c) Correlation of ADC as a function of tumor cell density. When changes in MR diffusion (mean ADC) are plotted against cell density at each of the time points, a significant correlation is observed, demonstrating that mean ADC is a quantitative surrogate for cell density. Courtesy of Chenevert et al. [34]
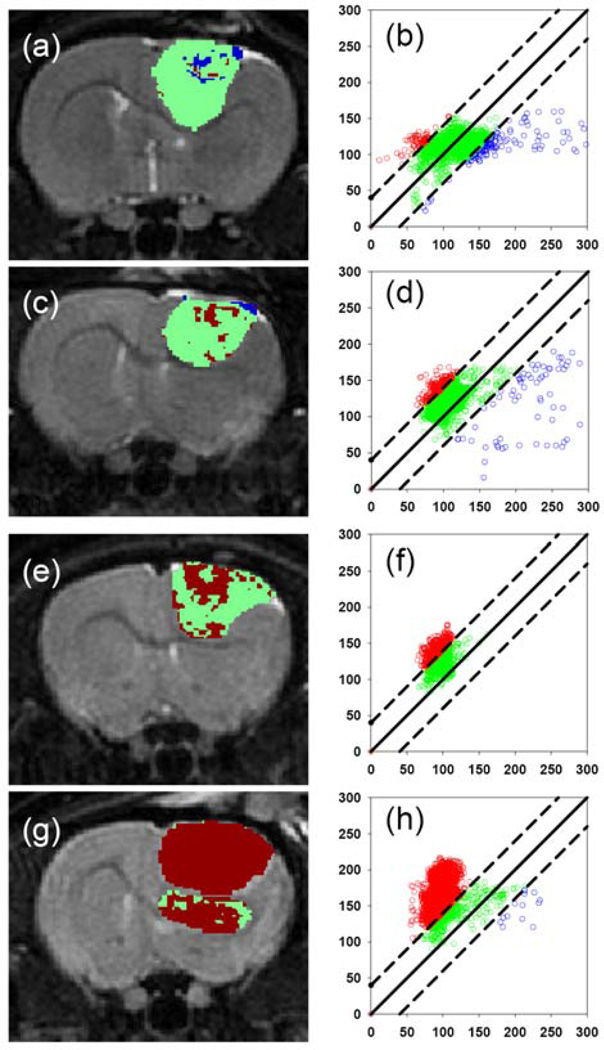
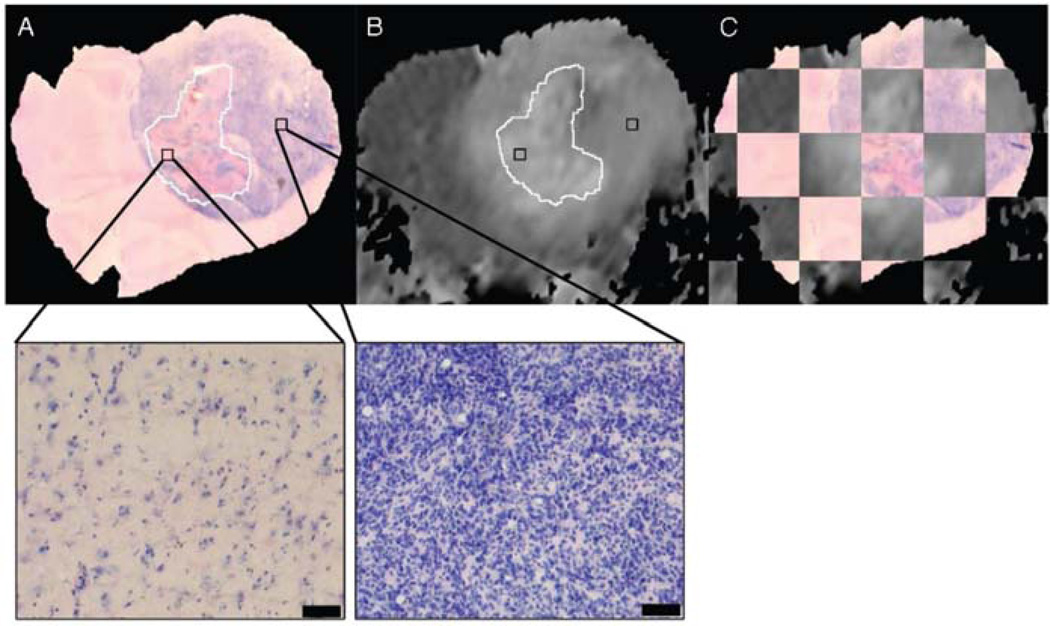
Although these initial results did prove promising, there were still several hurdles to overcome in order to clinically translate diffusion MRI as a biomarker for therapeutic efficacy. The heterogeneity of changes in ADC in human tumors compared to experimental rodent tumors was such that simple changes in mean ADC were not predictive of therapeutic efficacy and outcome. To overcome the inherent heterogeneity of changes in ADC in the clinical setting, the functional diffusion mapping (fDM) was developed as an alternated to mean ADC calculations [35]. The calculation of fDM maps requires image registration of serial ADC maps acquired pre-therapy and during chemo/radiation therapy followed by segmentation of the overlapping tumor mass into regions of positive (red), negative (blue) and negligible (green) change in ADC (Fig. 3). Although the initial publication of fDM was applied to clinical cases and showed excellent correlation with patient outcome, it was not possible to prove that these regional changes in ADC actually predicted regional changes in cellular density. Thus fDM imaging of rodent brain tumor models [36] was important to show that fDM was reproducible; correlating linearly with survival and chemotherapeutic dose. In addition, the use of animal brain tumor models and sophisticated image registration techniques are able to show that these ADC changes also correlate with regional differences in cell density [36, 37] (Fig. 4).
Fig. 3.
Functional diffusion mapping of a 9L brain tumor model treated with BCNU chemotherapy. The panel shows examples of FDM maps and corresponding FDM plots following a 0 (a and b), 0.5 (c and d), 1 (d and e) and 2×LD10 (f and g) doses of BCNU. These results demonstrated the quantitative nature of diffusion MRI since a dose dependent increase in tumor cell kill correlated with an increase in the number of voxels that had positive change in diffusion (red) compared to pre-treatment values. Courtesy of Moffat et al. [36].
Fig. 4.
Co-registration of in-vivo diffusion MRI with histology showing that the heterogeneity of ADC within tumors correlates with the heterogeneity of cell density. (A) 10x image of a Haematoxylin and Eosin stained histology slide. (B) corresponding co-registered in-vivo ADC image. (C) Checkerboard visualisation of the accuracy of the co-registration procedure. (D) 40x image of the same histology slide showing that the hyper intense ADC regions correspond to the low cellular dense necrotic regions. Courtesy of Meyer et al. [37]
The highly ordered cellular environment of white matter causes the ADC to be dependent on the relative angle of the white matter tracts to the diffusion encoding gradients. This angular dependence of ADC is called diffusion anisotropy and was quantified by Chenevert et al.25]. Subsequently it was shown that this angular dependence could be used to quantify the local diffusion anisotropy and direction of white matter fiber tracts [38] using diffusion tensor imaging (DTI). It was thus proposed and shown that [39] quantification of diffusion anisotropy could be used to image the infiltration brain tumors into the surrounding white matter. Although rodent models have significantly different white matter architecture to humans, the ability to correlate DTI metrics with histopathology in these models is essential for validation and determination of which metrics more closely reflect the underlying cellular architecture [40–42]. In recent years the use of DTI to track white matter fibers (DTI tractography) [43] has also been proposed as an important clinical tool for planning neurosurgical procedures near eloquent areas of the brain [30]. If this is to become a validated tool for pre-surgical and/or intra-operative planning of tumor resection then correlation with histopathology as well as cortical stimulation is imperative. While cortical stimulation experiments can be performed in clinical studies, rodent imaging is being used to correlate DTI tractography with histopatholgy [44]. This study by Asunama et al. 44] has shown that although tractography does not necessarily provide an accurate neuronal fibre map, tractography does reflect the direction and neural connections around invading gliomas.
Perfusion MRI
The abnormal vascular microenvironment, that includes a compromised blood brain barrier, hyper-vascular proliferation and tumor cell invasiveness, is a hallmark of malignant brain tumors [45]. Vascular recruitment and neoangiogenesis is thought to be integral to the malignant nature of high grade primary gliomas as well as metastatic brain tumors. Strictly speaking perfusion imaging should be defined as an imaging technique for acquiring spatial maps of tissue blood flow per unit of tissue mass. However, perfusion MRI has become synonymous with quantification of not only cerebral blood flow (CBF) but also blood volume (CBV) and blood vessel permeability (Ktrans). Each of these perfusion parameters has been proposed for some time as an important imaging biomarker that may enable non-invasive imaging of tumor malignancy, tumor progression and for quantification of therapeutic efficacy of antiangiogenic pharmaceuticals [46, 47]. While studies correlating these perfusion metrics with outcome are obviously important for clinical translation [48], much of our current understanding of the biological basis of changes in tumor perfusion is derived from rodent studies.
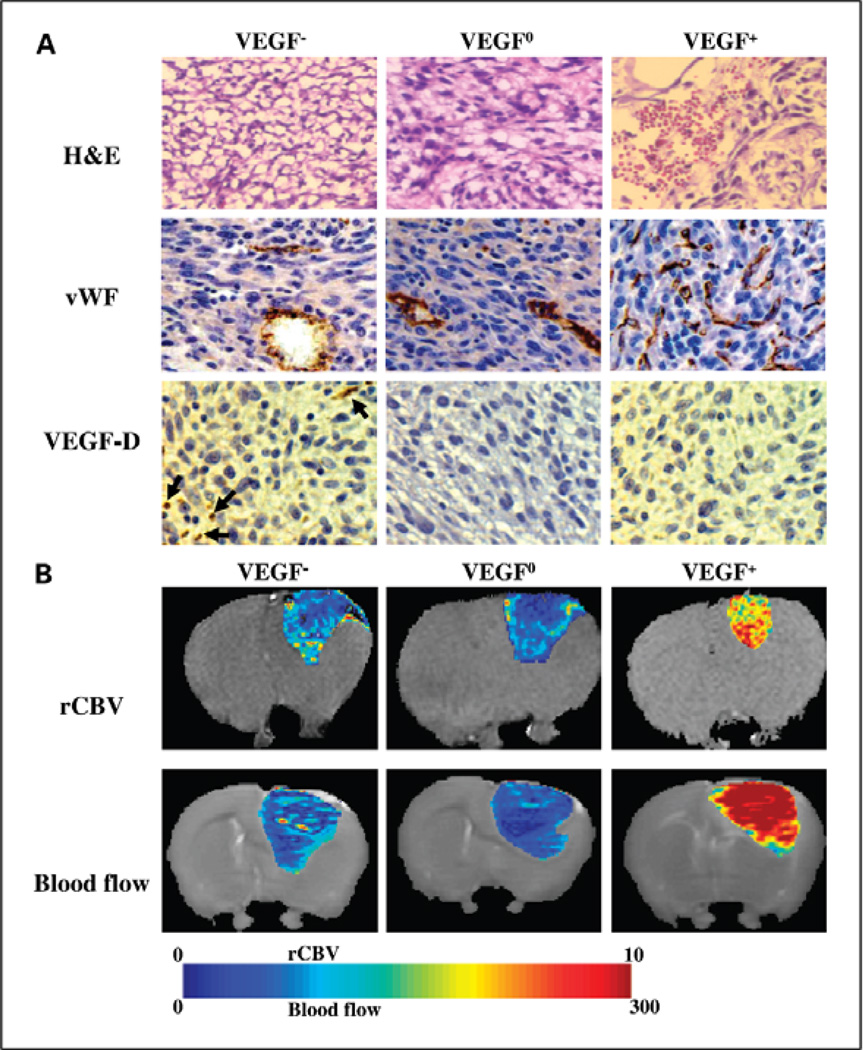
The ability to quantify perfusion using 133Xe single photon emission tomography predates perfusion MRI but the technique was limited due to a significantly lower resolution compared to MRI. Steen et al. [49] demonstrated that blood flow to tumors became less efficient with increasing tumor size and level of oedematous tissue. This work was later replicated using a perfusion MRI technique to quantify blood flow [50]. A benefit of studying perfusion MRI in rodent brain tumor models, apart from the ability to correlate resulting changes with histopathology, is that it is now possible to systematically alter the expression of key vascular growth factors and thereby providing unique insight into changes in perfusion induced during tumor neoangiogenesis. In a recent study [51] the 9L glioscarcoma model was genetically altered to both over and under express vascular endothelial growth factor A (VEGF-A). Perfusion MRI of this model was able to quantify the heterogeneity of the tumor vascular environment which was histopathologically validated. It is interesting to note that histopathologically confirmed perfusion MRI was able to show that while VEGF-A over expressing tumors had an expected increase in vascular volume and blood flow, tumors wherein VEGF-A expression was inhibited had an initial lag in tumor growth but ultimately their vascular volume was not significantly altered and actually had a greater tumor blood flow (Fig. 5). These model systems provided a unique insight into the concept of “vascular normalization” and led to the identification of alternate vascular growth factors that compensate for the loss of VEGF-A expression.
Fig. 5.
Perfusion imaging of three different genetic variants of the 9L gliosarcoma model. In this study tumor xenografts of VEGF-A over-expressing (VEGF+), under-expressing (VEGF-) and wild-type (VEGF-0) 9L gliosarcoma cells were resected and histologically analyzed (A) Haematoxylin and Eosin (H&E) stained , immunohistochemically stained for Von Willabrand Factor (vWF) and Vascular Growth Factor -DVEGF-D. (B) Tumor specific perfusion were determined using MRI. Blood volume (rCBV) and blood flow were calculated and presented as heat maps. This study demonstrated that although suppression of VEGF-A production in the VEGF- tumors slowed tumor growth initially, blood flow was higher and blood volume was similar to tumors with wild-type expression of VEGF-A. These studies led to the identification of VEGF-D over-expression in the VEGF- tumors that resulted in restoration of angiogenic activity. Courtesy of Moffat et al. [51]
In summary, perfusion MRI of rodent brain tumor models has shown that the different perfusion metrics of blood volume, flow and permeability provide unique and independent quantitative measures of blood vessel function. In addition, when tumor angiogenesis is modulated, changes in these perfusion biomarkers are correlated with changes in the vascular morphology. These results suggest that perfusion MRI may provide important reproducible endpoints for evaluating the effect of anti-angiogenic or anti-vascular therapies on blood vessel function.
Summary
The use of advanced MRI biomarkers such as spectroscopy, diffusion and perfusion are vitally important in brain tumour research as they allow for non-invasive, three dimensional quantification of important molecular and cellular phenomena without the use of ionizing radiation. The non-invasiveness of these techniques allows for ethical repeat measurements to assess therapeutic response in clinical trials of new therapies without adverse effects on patients. Despite this, clinical translation and FDA acceptance of these techniques requires a process of validation as a surrogate endpoint. Part of this validation process requires scientific evidence of a clear biological link between the biomarkers and the biological phenomena they are supposed to measure. This evidence is almost impossible to obtain clinically and as such what is known about these biological linkages comes predominantly from imaging studies of animal brain tumour models.
While this review was not exhaustive in its discussion of all MRI biomarkers nor can we fully predict which of these will find application in research and clinical management of brain tumors, it is clearly demonstrated that MRI of animal models is and will for some time be vitally important in the translation of the ever evolving MRI biomarkers and their quantitative analysis.
Acknowledgments
Funding Support: Dr Moffat would like to acknowledge the funding support of the Australian NHMRC (#454790 and #566992), and the Radiation Oncology Branch of the Department of Health and Aging (Australian Government, #509322). Prof’s Rehemtulla and Galbán would like to acknowledge the funding support of the NIH (P50CA093990, PO1CA085878 and U24CA083099).
Footnotes
Publisher's Disclaimer: This is a PDF file of an unedited manuscript that has been accepted for publication. As a service to our customers we are providing this early version of the manuscript. The manuscript will undergo copyediting, typesetting, and review of the resulting proof before it is published in its final citable form. Please note that during the production process errors may be discovered which could affect the content, and all legal disclaimers that apply to the journal pertain.
References
- 1.Young GS. Advanced MRI of adult brain tumors. Neurol Clin. 2007;25(4):947–973. doi: 10.1016/j.ncl.2007.07.010. viii. [DOI] [PubMed] [Google Scholar]
- 2.Jenkinson MD, et al. Advanced MRI in the management of adult gliomas. Br J Neurosurg. 2007;21(6):550–561. doi: 10.1080/02688690701642020. [DOI] [PubMed] [Google Scholar]
- 3.Rudin M, et al. In vivo magnetic resonance methods in pharmaceutical research: current status and perspectives. NMR Biomed. 1999;12(2):69–97. doi: 10.1002/(sici)1099-1492(199904)12:2<69::aid-nbm548>3.0.co;2-d. [DOI] [PubMed] [Google Scholar]
- 4.Galbraith SM. MR in oncology drug development. NMR Biomed. 2006;19(6):681–689. doi: 10.1002/nbm.1093. [DOI] [PubMed] [Google Scholar]
- 5.Ross BD, et al. Use of Magnetic Resonance Imaging (MRI) for Evaluation Treatment Response. In: Holland EC, editor. Mouse models of human cancer. Hoboken, NJ: Wiley-Liss; 2004. [Google Scholar]
- 6.Koo V, Hamilton PW, Williamson K. Non-invasive in vivo imaging in small animal research. Cell Oncol. 2006;28(4):127–139. doi: 10.1155/2006/245619. [DOI] [PMC free article] [PubMed] [Google Scholar]
- 7.Evelhoch J, et al. Expanding the use of magnetic resonance in the assessment of tumor response to therapy: workshop report. Cancer Res. 2005;65(16):7041–7044. doi: 10.1158/0008-5472.CAN-05-0674. [DOI] [PubMed] [Google Scholar]
- 8.Padhani AR, et al. Diffusion-weighted magnetic resonance imaging as a cancer biomarker: consensus and recommendations. Neoplasia. 2009;11(2):102–125. doi: 10.1593/neo.81328. [DOI] [PMC free article] [PubMed] [Google Scholar]
- 9.Frey HE, et al. Proton spin-lattice relaxation studies of nonmalignant tissues of tumorous mice. J Natl Cancer Inst. 1972;49(3):903–906. [PubMed] [Google Scholar]
- 10.Hawkes RC, et al. Nuclear magnetic resonance (NMR) tomography of the brain: a preliminary clinical assessment with demonstration of pathology. J Comput Assist Tomogr. 1980;4(5):577–586. doi: 10.1097/00004728-198010000-00001. [DOI] [PubMed] [Google Scholar]
- 11.Katz R. Biomarkers and surrogate markers: an FDA perspective. NeuroRx. 2004;1(2):189–195. doi: 10.1602/neurorx.1.2.189. [DOI] [PMC free article] [PubMed] [Google Scholar]
- 12.Kelloff GJ, Sigman CC. New science-based endpoints to accelerate oncology drug development. Eur J Cancer. 2005;41(4):491–501. doi: 10.1016/j.ejca.2004.12.006. [DOI] [PubMed] [Google Scholar]
- 13.Aisen AM, Chenevert TL. MR spectroscopy: clinical perspective. Radiology. 1989;173(3):593–599. doi: 10.1148/radiology.173.3.2682768. [DOI] [PubMed] [Google Scholar]
- 14.Chapman JD. The detection and measurement of hypoxic cells in solid tumors. Cancer. 1984;54(11):2441–2449. doi: 10.1002/1097-0142(19841201)54:11<2441::aid-cncr2820541122>3.0.co;2-s. [DOI] [PubMed] [Google Scholar]
- 15.Evanochko WT, Ng TC, Glickson JD. Application of in vivo NMR spectroscopy to cancer. Magn Reson Med. 1984;1(4):508–534. doi: 10.1002/mrm.1910010410. [DOI] [PubMed] [Google Scholar]
- 16.Koeze TH, et al. In vivo nuclear magnetic resonance spectroscopy of a transplanted brain tumour. Br J Cancer. 1984;49(3):357–361. doi: 10.1038/bjc.1984.56. [DOI] [PMC free article] [PubMed] [Google Scholar]
- 17.Bruhn H, et al. Noninvasive differentiation of tumors with use of localized H-1 MR spectroscopy in vivo: initial experience in patients with cerebral tumors. Radiology. 1989;172(2):541–548. doi: 10.1148/radiology.172.2.2748837. [DOI] [PubMed] [Google Scholar]
- 18.Remy C, et al. In vivo 1H NMR spectroscopy of an intracerebral glioma in the rat. Magn Reson Med. 1989;9(3):395–401. doi: 10.1002/mrm.1910090312. [DOI] [PubMed] [Google Scholar]
- 19.Pfeuffer J, et al. Detection of intracellular lactate with localized diffusion {1H-13C}-spectroscopy in rat glioma in vivo. Journal of Magnetic Resonance. 2005;177(1):129–138. doi: 10.1016/j.jmr.2005.07.010. [DOI] [PubMed] [Google Scholar]
- 20.Demaerel P, et al. Localized 1H NMR spectroscopy in fifty cases of newly diagnosed intracranial tumors. J Comput Assist Tomogr. 1991;15(1):67–76. doi: 10.1097/00004728-199101000-00009. [DOI] [PubMed] [Google Scholar]
- 21.van Vaals JJ, et al. Non-invasive in vivo localized 1H spectroscopy of human astrocytoma implanted in rat brain: regional differences followed in time. NMR Biomed. 1991;4(3):125–132. doi: 10.1002/nbm.1940040303. [DOI] [PubMed] [Google Scholar]
- 22.Gyngell ML, et al. Localized proton NMR spectroscopy of experimental gliomas in rat brain in vivo. NMR Biomed. 1992;5(6):335–340. doi: 10.1002/nbm.1940050603. [DOI] [PubMed] [Google Scholar]
- 23.Ross BD, et al. Spatially localized in vivo 1H magnetic resonance spectroscopy of an intracerebral rat glioma. Magn Reson Med. 1992;23(1):96–108. doi: 10.1002/mrm.1910230111. [DOI] [PubMed] [Google Scholar]
- 24.Gyngell ML, et al. Proton MR spectroscopy of experimental brain tumors in vivo. Acta Neurochir Suppl (Wien) 1994;60:350–352. doi: 10.1007/978-3-7091-9334-1_94. [DOI] [PubMed] [Google Scholar]
- 25.Chenevert TL, Brunberg JA, Pipe JG. Anisotropic diffusion in human white matter: demonstration with MR techniques in vivo. Radiology. 1990;177(2):401–405. doi: 10.1148/radiology.177.2.2217776. [DOI] [PubMed] [Google Scholar]
- 26.Chenevert TL, et al. Diffusion MRI: a new strategy for assessment of cancer therapeutic efficacy. Mol Imaging. 2002;1(4):336–343. doi: 10.1162/15353500200221482. [DOI] [PubMed] [Google Scholar]
- 27.Price SJ, et al. Diffusion tensor imaging of brain tumours at 3T: a potential tool for assessing white matter tract invasion? Clin Radiol. 2003;58(6):455–462. doi: 10.1016/s0009-9260(03)00115-6. [DOI] [PubMed] [Google Scholar]
- 28.Lu S, et al. Diffusion-tensor MR imaging of intracranial neoplasia and associated peritumoral edema: introduction of the tumor infiltration index. Radiology. 2004;232(1):221–228. doi: 10.1148/radiol.2321030653. [DOI] [PubMed] [Google Scholar]
- 29.Wang W, Steward CE, Desmond PM. Diffusion tensor imaging in glioblastoma multiforme and brain metastases: the role of p, q, L, and fractional anisotropy. AJNR Am J Neuroradiol. 2009;30(1):203–208. doi: 10.3174/ajnr.A1303. [DOI] [PMC free article] [PubMed] [Google Scholar]
- 30.Holodny AI, Ollenschlager M. Diffusion imaging in brain tumors. Neuroimaging Clin N Am. 2002;12(1):107–124. doi: 10.1016/s1052-5149(03)00072-8. x. [DOI] [PubMed] [Google Scholar]
- 31.Chenevert TL, Sundgren PC, Ross BD. Diffusion imaging: insight to cell status and cytoarchitecture. Neuroimaging Clin N Am. 2006;16(4):619–632. doi: 10.1016/j.nic.2006.06.005. viii-ix. [DOI] [PubMed] [Google Scholar]
- 32.Ross BD, et al. Magnetic resonance imaging and spectroscopy: application to experimental neuro-oncology. Q Magn Reson Biol Med Phys. 1994;1:89–106. [PMC free article] [PubMed] [Google Scholar]
- 33.Chenevert TL, McKeever PE, Ross BD. Monitoring early response of experimental brain tumors to therapy using diffusion magnetic resonance imaging. Clin Cancer Res. 1997;3(9):1457–1466. [PubMed] [Google Scholar]
- 34.Chenevert TL, et al. Diffusion magnetic resonance imaging: an early surrogate marker of therapeutic efficacy in brain tumors. J Natl Cancer Inst. 2000;92(24):2029–2036. doi: 10.1093/jnci/92.24.2029. [DOI] [PubMed] [Google Scholar]
- 35.Moffat BA, et al. Functional diffusion map: a noninvasive MRI biomarker for early stratification of clinical brain tumor response. Proc Natl Acad Sci U S A. 2005;102(15):5524–5529. doi: 10.1073/pnas.0501532102. [DOI] [PMC free article] [PubMed] [Google Scholar]
- 36.Moffat BA, et al. The functional diffusion map: an imaging biomarker for the early prediction of cancer treatment outcome. Neoplasia. 2006;8(4):259–267. doi: 10.1593/neo.05844. [DOI] [PMC free article] [PubMed] [Google Scholar]
- 37.Meyer CR, et al. A methodology for registration of a histological slide and in vivo MRI volume based on optimizing mutual information. Mol Imaging. 2006;5(1):16–23. [PMC free article] [PubMed] [Google Scholar]
- 38.Basser PJ, Mattiello J, LeBihan D. Estimation of the effective self-diffusion tensor from the NMR spin echo. J Magn Reson B. 1994;103(3):247–254. doi: 10.1006/jmrb.1994.1037. [DOI] [PubMed] [Google Scholar]
- 39.Brunberg JA, et al. In vivo MR determination of water diffusion coefficients and diffusion anisotropy: correlation with structural alteration in gliomas of the cerebral hemispheres. AJNR Am J Neuroradiol. 1995;16(2):361–371. [PMC free article] [PubMed] [Google Scholar]
- 40.Inglis BA, et al. Diffusion tensor MR imaging and comparative histology of glioma engrafted in the rat spinal cord. AJNR Am J Neuroradiol. 1999;20(4):713–716. [PMC free article] [PubMed] [Google Scholar]
- 41.Kim S, et al. Diffusion tensor MRI in rat models of invasive and well-demarcated brain tumors. NMR Biomed. 2008;21(3):208–216. doi: 10.1002/nbm.1183. [DOI] [PubMed] [Google Scholar]
- 42.Lope-Piedrafita S, et al. Longitudinal diffusion tensor imaging in a rat brain glioma model. NMR Biomed. 2008;21(8):799–808. doi: 10.1002/nbm.1256. [DOI] [PMC free article] [PubMed] [Google Scholar]
- 43.Basser PJ, et al. In vivo fiber tractography using DT-MRI data. Magn Reson Med. 2000;44(4):625–632. doi: 10.1002/1522-2594(200010)44:4<625::aid-mrm17>3.0.co;2-o. [DOI] [PubMed] [Google Scholar]
- 44.Asanuma T, et al. Diffusion tensor imaging and fiber tractography of C6 rat glioma. J Magn Reson Imaging. 2008;28(3):566–573. doi: 10.1002/jmri.21473. [DOI] [PubMed] [Google Scholar]
- 45.Vajkoczy P, Menger MD. Vascular microenvironment in gliomas. J Neurooncol. 2000;50(1–2):99–108. doi: 10.1023/a:1006474832189. [DOI] [PubMed] [Google Scholar]
- 46.Barrett T, et al. MRI of tumor angiogenesis. J Magn Reson Imaging. 2007;26(2):235–249. doi: 10.1002/jmri.20991. [DOI] [PubMed] [Google Scholar]
- 47.Batchelor TT, et al. AZD2171, a pan-VEGF receptor tyrosine kinase inhibitor, normalizes tumor vasculature and alleviates edema in glioblastoma patients. Cancer Cell. 2007;11(1):83–95. doi: 10.1016/j.ccr.2006.11.021. [DOI] [PMC free article] [PubMed] [Google Scholar]
- 48.Law M, et al. Gliomas: predicting time to progression or survival with cerebral blood volume measurements at dynamic susceptibility-weighted contrast-enhanced perfusion MR imaging. Radiology. 2008;247(2):490–498. doi: 10.1148/radiol.2472070898. [DOI] [PMC free article] [PubMed] [Google Scholar]
- 49.Steen RG, Kromhout-Schiro S, Graham MM. Relationship of perfusion to edema in the 9L gliosarcoma. J Neurooncol. 1993;16(1):81–87. doi: 10.1007/BF01324839. [DOI] [PubMed] [Google Scholar]
- 50.Moffat BA, et al. Continuous arterial spin labeling using a train of adiabatic inversion pulses. J Magn Reson Imaging. 2005;21(3):290–296. doi: 10.1002/jmri.20268. [DOI] [PubMed] [Google Scholar]
- 51.Moffat BA, et al. Inhibition of vascular endothelial growth factor (VEGF)-A causes a paradoxical increase in tumor blood flow and up-regulation of VEGF-D. Clin Cancer Res. 2006;12(5):1525–1532. doi: 10.1158/1078-0432.CCR-05-1408. [DOI] [PubMed] [Google Scholar]


