

Abstract
Vertebrate brains of even moderate size are composed of astronomically large numbers of neurons and show a great degree of individual variability at the microscopic scale. This variation is presumably the result of phenotypic plasticity and individual experience. At a larger scale, however, relatively stable species-typical spatial patterns are observed in neuronal architecture, e.g., the spatial distributions of somata and axonal projection patterns, probably the result of a genetically encoded developmental program. The mesoscopic scale of analysis of brain architecture is the transitional point between a microscopic scale where individual variation is prominent and the macroscopic level where a stable, species-typical neural architecture is observed. The empirical existence of this scale, implicit in neuroanatomical atlases, combined with advances in computational resources, makes studying the circuit architecture of entire brains a practical task. A methodology has previously been proposed that employs a shotgun-like grid-based approach to systematically cover entire brain volumes with injections of neuronal tracers. This methodology is being employed to obtain mesoscale circuit maps in mouse and should be applicable to other vertebrate taxa. The resulting large data sets raise issues of data representation, analysis, and interpretation, which must be resolved. Even for data representation the challenges are nontrivial: the conventional approach using regional connectivity matrices fails to capture the collateral branching patterns of projection neurons. Future success of this promising research enterprise depends on the integration of previous neuroanatomical knowledge, partly through the development of suitable computational tools that encapsulate such expertise.
So, oft in theologic wars
The disputants, I ween,
Rail on in utter ignorance
Of what each other mean,
And prate about an Elephant
Not one of them has seen!(John Godfrey Saxe, The Blind Men and the Elephant, 1873)
The need to study entire brains is widely felt. Philosophers of neuroscience are concerned about the mereological fallacy, the attribution to a part a property of the whole (Bennett and Hacker, 2003); neuroscientists fret about the rapid proliferation of information about detailed aspects of the nervous system (Brenner, 2008) without adequate integration of that information into a coherent framework (Grillner, 2014). Nevertheless, the superficial complexity of entire brains of even modest size, when quantified in terms of elementary components, is both daunting and empirically inaccessible. Exhaustive measurement of all activity or complete determination of all microstructure remains wishful thinking, except for quite small nervous systems. Even if such measurements were made possible, this only postpones the real problem: one could as easily get lost in the detail of a virtual elephant instantiated in a large data set, as one could in the local empirical study of a physical one.
What is to be done? The history of physics provides a clue to this conundrum. Physicists have made progress by realizing that natural phenomena can be studied productively at different levels or scales of analysis. As P.W. Anderson wrote in 1972, rejecting a hierarchical account of physical theory, “Surely there are more levels of organization between human ethology and DNA than there are between DNA and quantum electrodynamics, and each level can require a whole new conceptual structure” (Anderson, 1972). Self-consistent theoretical treatments at intermediate levels of organization are the bedrock of modern physics (Zinn-Justin, 2007). Abstraction into levels of organization is also important for modern engineering, a well-known example of which is the layered architecture of the Internet (http://tools.ietf.org/html/rfc1122). In neurobiology, epistemic pluralism has also been fruitful: Freud, Pavlov, Skinner, Tinbergen, Lorenz, and others made fundamental progress at the psychological and behavioral levels without having to resort to neurophysiological or neuroanatomical detail.
The basic idea behind the mesoscopic scale (“mesoscale”) approach to studying neural circuit architecture (Bohland et al., 2009b) is that there exists a productive intermediate level of description and analysis suitable for entire brains. This approach derives support from classical neuroanatomical research, as instantiated in brain atlases with named brain regions (Brodmann and Gary, 2006), and in the division into “brain systems” that can be found in textbooks. The new ingredients in this approach are the ability to computationally analyze digital microscopic data sets for whole brains, and the systematic spatial coverage of whole brains using a grid of tracer injections. This Perspective summarizes the rationale and potential utility of the mesoscale approach to whole-brain circuit architecture.
A salient point in this Perspective is the inadequacy of regional connectivity matrices in capturing the full structural information present at the mesoscale, and the corresponding importance of retrograde tracer injections. As illustrated in Figure 2, such matrices conceptually fail to represent the tree-like collateral branching patterns of axons (Ramón y Cajal, 1995) that are common to projecting neurons. A better representation should retain information about the major branching patterns, which is likely to be important for brain function. The branching patterns of the axons of individual neurons on a brain-wide scale can be determined by single neuron tracing (Johnson et al., 2000), but this is a laborious method that is difficult to scale up given the numbers involved. Double-labeling studies using two injections of fluorescent retrograde tracers at efferent locations can be used to derive information about collateral branches (van der Kooy et al., 1978). It is argued here that information about the branching patterns can also be derived computationally by combining whole-brain data sets of single anterograde and retrograde tracer injections placed on a grid.
Figure 2. The Failure of Regional Connectivity Matrices to Capture Information about Collateral Branching Patterns, and the Utility of Retrograde Tracer Injections in Revealing Information about Such Collateral Branches.
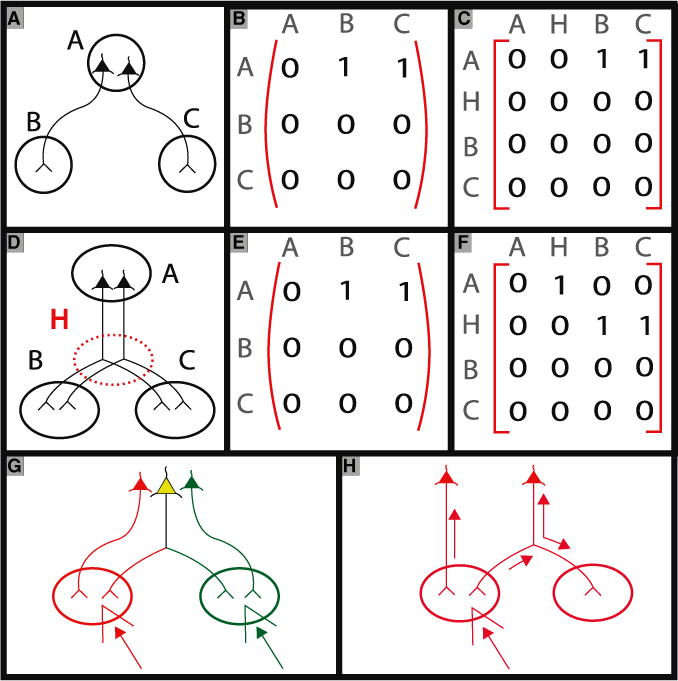
The two neuronal configurations in (A) and (D) both correspond to the same regional connectivity matrix (B and E). Nevertheless, these configurations are neurobiologically different: in (D), individual neurons from region A send branches to both regions B and C, ensuring synchrony between signals sent from the neuronal somata in A to targets in B and C. The difference can be characterized by adding a hidden node H to the connectivity matrices that represent the branch point (C and F). Double retrograde injections with two fluorescent tracers with different colors injected into the target regions, can unambiguously identify neurons sending collateral branches to regions B and C (G). A single retrograde injection into region B, if it fills the entire neuron (requiring both retrograde and anterograde transport at the branch point), can also reveal collateral branches (H).
It is generally true that neuroanatomical data sets provide partial information and that an inverse problem has to be solved in order to obtain the interesting underlying structure. Traditionally, this inverse problem has been solved within the cognitive space of individual neuroanatomists, who piece together information from several data sets using a set of skills and knowledge acquired over a lifetime of study. The interesting challenge for the future is to computationally instantiate the cognitive strategies employed by expert practitioners when interpreting a data set, constructing a Virtual Neuroanatomist, so to speak. The current computational approaches to the whole-brain imaging data (Helmstaedter and Mitra, 2012) are fundamentally lacking in this regard. Although popular, the descriptive statistical measures derived from graph theory that have been used so far to analyze and characterize regional connectivity matrices (Bullmore and Sporns, 2009) are unlikely to yield deep neurobiological insights. A second and related challenge is to integrate the rich body of knowledge from the prior literature and methods to systematically compare the previous knowledge with the information generated by the new data sets. Without such an effort at scholarship, which in the past has also been carried out within the brains of expert neuroanatomists who are increasingly in short supply, the main problem of integrating information into knowledge will not be addressed.
Structure versus Dynamics: Is Neuroanatomy Useful?
Before discussing the specifics of the mesoscale approach, it is useful to consider the value of neuroanatomical research in general. Neuroanatomy, a foundational discipline in neuroscience, has languished in recent decades. The current renaissance in neuroanatomical research is driven by automation and the ability to store and manipulate the large data sets resulting from digital microscopy (Mitra et al, 2013). However, principled arguments are sometimes offered against the utility of purely structural information about the nervous system, the putative domain of neuroanatomical research. The reconstructed circuit of C. elegans nervous system (Ward et al., 1975) is sometimes held up as emblematic of the failure of a purely neuroanatomic approach, the idea being that comprehensive activity measurements (Alivisatos et al., 2012) are compulsory in order to derive insight into the dynamics of the nervous system and the behavior of organisms. If neuroanatomical structure is fundamentally inadequate in principle to help us understand nervous system function, a fortiori mesoscale circuit mapping cannot be expected to yield much insight.
This line of argument, however, ignores the history of neuroanatomical research. No serious neuroanatomist would study nervous system structure without a keen awareness and appreciation of its dynamics. Cajal formulated two fundamental dynamical principles about nervous systems, namely the law of dynamic polarization (Ramón y Cajal, 1891) (propagation of signals from the dendritic toward axonal compartments of the neuronal tree) and the presence of growth cones as a dynamical developmental mechanism for neuronal structure (Ramón y Cajal, 1890), based on neuroanatomical observations. Darwin postulated the evolutionary process as giving rise to species by observing current phylogenetic diversity, without having observed the phylogenetic tree unfolding over geological timescales. Modern astronomy is making important dynamical inferences about the early universe based on current observations of the spatial structure of the cosmic microwave background (Ade et al., 2014). Developmental dynamics may be studied directly by studying the mesoscale connectivity at different ages. The dynamics of brain evolution may be inferred by comparing mesoscale circuit architecture across species in a similar fashion as evolutionary dynamics may be inferred from comparative genomics. It is also possible that insight about electrophysiological dynamics of the nervous system may be drawn from the contextualized study of neuroanatomical structure.
Circuit Architecture Is the Analog of Laws of Motion
A principled argument may be advanced about the necessity of neuroanatomical structure to understanding nervous system dynamics. In linguistics there is the well-known performance-competence distinction (Chomsky, 1965): the actual set of sentences uttered by a speaker constitutes performance, whereas the speaker has an underlying competence or capability that characterizes the structure of sentences that the speaker may in principle utter. The observed linguistic behavior and, correspondingly, electrophysiological dynamics is contingent on initial conditions and environmental inputs, with linguistic competence and correspondingly neuroanatomical circuitry determining the dynamical laws.
The study of neuroanatomical circuitry therefore captures the space of possible dynamics and behaviors of the nervous system in a well-defined theoretical sense. A further question is that of scale, namely whether this encapsulation of the system dynamics can meaningfully occur at the mesoscale, without the full microcircuit-level information. This is an open theoretical question to be resolved through future research, but there are multiple indications that indeed such encapsulation is possible. The classical lesion studies that gave rise to the idea of functional localization in the brain (Broca, 1861), the elicitation of highly specific behaviors through the electrical stimulation of specific brain regions (Hess, 1956), as well as the more contemporary analog using optogenetic methods (Fenno et al., 2011) that may provide cell-type specificity but nevertheless synchronously stimulates large numbers of neurons in a given brain region, all indicate that there is a behaviorally meaningful level of analysis of brain circuitry that does not need to address single neurons. This is adequate indication that mesoscale circuit architecture is a neurobiologically valid target of study.
Small Brains versus Big Brains
A related argument that can be addressed is about the relative merits of studying small and large brains. While all organisms are interesting to study in their own right, an argument is often advanced comparing the C. elegans nervous system to the hydrogen atom in quantum mechanics. The implication is perhaps that research should proceed serially from the study and understanding of small nervous systems to larger ones. The analogy between small nervous systems and the hydrogen atom is however fallacious. In a well-defined mathematical sense, the electronic structure of the atoms of different elements may be constructed starting with the excited states of the hydrogen atom as basis functions. In this sense, once one has studied the excited states of the hydrogen atom, one has gained a good understanding of the entire periodic table.
In contrast, it may paradoxically be true that larger brains exhibit organizational simplicities compared with smaller ones: there may be a “precipitation” or “crystallization” of functional subsystems with special roles, each of which may be studied in relative isolation. The neuroanatomy of the primate visual system may be taken as an example. This is similar in spirit to Krogh’s principle (Krogh, 1929) in neuroethology, in which understanding is gained from a study of adaptations arising from extreme specialization. Such special adaptations are more likely to occur in large rather than small nervous systems. It is also to be noted that the quantum mechanical understanding of the hydrogen atom followed, rather than preceded, the organization of elements into the periodic table. A counter analogy may be drawn that the comparative neuroanatomical method, applied across phylogenetic taxa, might produce the analog of the periodic table, which could then lead to conceptual breakthroughs. The comparative argument would indicate that the study of bigger brains should proceed in parallel with that of smaller brains, and the mesoscale approach is meant to make such comparative study practically possible.
In fact, a similar argument may be applied to the hydrogen atom example: the quantum mechanical understanding of the electronic structure of the hydrogen atom is of limited help in the practice of chemistry. Much of chemistry depends on empirical rules and effective mathematical models not derived from first principles quantum mechanical arguments. The “C. elegans argument against neuroanatomy” may instead be an argument against practicing neuroanatomy without recourse to the comparative method, demonstrating the limitations of focusing exclusively on a single species (and even on a single individual from that species). Rather than conclude from the C. elegans example that the study of neuroanatomy is uninformative, one might alternatively conclude that studying the nervous system of C. elegans may not be a good way to understand neuroanatomical principles.
The Mesocircuit as a Knowledge Integration Framework
Apart from theoretical motivations, there is also an important pragmatic reason for mesoscale circuit mapping for the neuroscience community. A persistent problem in the neuroscience community is the lack of integration of knowledge, arising partly from the complexity of the nervous system but also in part from the lack of coherence arising from highly contingent experimentation that may hinder cumulation of knowledge across laboratories or efforts. The stability of neuroanatomical knowledge is particularly satisfying in this regard: Cajal’s drawings of neurons remain as useful and valid today as they were a hundred years ago, reflecting an objectively stable phenomenological basis. It can be plausibly argued therefore that whole-brain mesocircuits can provide a basis for indexing neurobiological information, in the same way that whole genomes have provided unified indices for cell biological information or genetic analysis.
What Is Mesoscale Circuit Mapping?
Mesoscopic Scale in Physics: Transition from Microscopic to Bulk Phenomena
The designation “mesoscopic scale,” though recently utilized in the neuroanatomical literature to delineate an approach to brain-wide circuit mapping (Bohland et al., 2009b), has an established usage in condensed matter physics. Mesoscopic physics deals with an intermediate scale between the microscopic, atomic scale dominated by statistical fluctuations and a macroscopic scale suitable for bulk descriptions in the thermodynamic limit. An important related idea is coarse graining: that is to say, the existence of a length scale such that properties averaged over this length scale reduces or eliminates the microscopic atomic fluctuations, allowing for effective descriptions at larger length scales. Such a procedure is utilized, for example, in defining effective parameters for macroscopic Maxwell’s equations in the presence of matter (Jackson, 1999). The mesoscopic scale in physics marks the transition from the microscopic to the macroscopic scale, where one observes “bulk” or thermodynamic phenomena.
Mesoscale in Neuroanatomy: Transition from Individual Variations to Species Typicality
The motivation behind defining a mesoscopic scale in mapping brain circuits is similar but with some important conceptual distinctions. At the microscopic scale, one observes individual neuronal somata and dendritic/axonal branching patterns, with any given location in the brain usually containing a diversity of cell types. As one moves from one point in brain space to the next, the specific microscopic details will change; however, for small enough displacements, one would still observe an environment that is statistically similar, in displaying the same types of somata and neuronal processes distributed in statistically similar spatial patterns. For larger displacements (for example, when crossing over from one brain compartment to another but also when moving significantly along a smooth gradient), these local microscopic patterns would be different. The mesoscopic scale is the transitional length scale: large enough to smooth out the microscopic variations but small enough to retain enough resolution to capture variations corresponding to different neuroanatomical compartments or cytoarchitectonic gradients (Figure 1). Brains are not homogeneous in space, so this scale may generally be expected to vary from one brain region to another.
Figure 1. The Mesoscale as a Transitional Scale between a Microscopic Scale where Large Interindividual Differences Exist, to a Larger Scale where a Species-Typical Pattern that Is Relatively Stable across Individuals Is Observed.
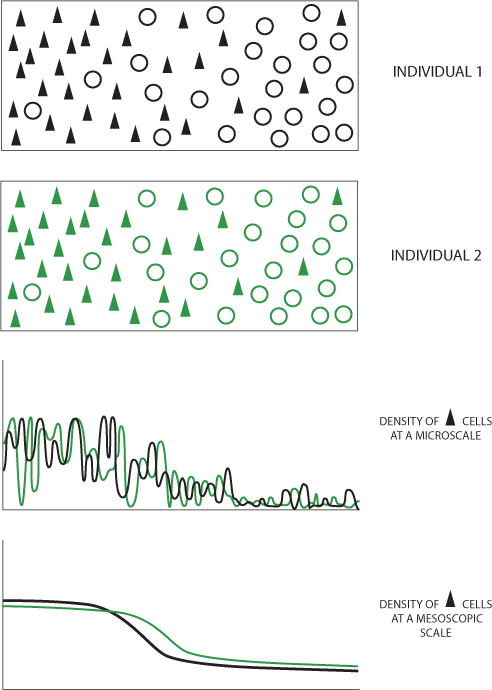
The two schematic illustrations of distributions of neuronal somata represent two individuals, showing a transition between two brain regions (denoted in black and green) with differing densities of the neurons symbolized as filled triangles. At the microscale (top plot), the schematized density shows variations with large variations between individuals. At the mesoscopic scale (bottom plot), a smoother density is obtained that is relatively stable across individuals and shows a species-typical structure.
In the physics case, the mesoscopic scale marks a transition to bulk/thermodynamic phenomena. In the neuroanatomical case, however, the salient biological idea is that of individual variation versus species typicality. For the larger brains relevant to mesoscale mapping, one expects certain microscopic details to vary strongly between individuals, corresponding either to individual experience-dependent effects (memory) or to random effects during the formation of the circuitry. These fluctuations are not encoded in the species genome. However, as a glance at any neurohistological section or a brain atlas will show, there is also a scale at which the cytoarchitecture shows a species-typical “reference” pattern, around which the individual variation may be studied. This spatial pattern, reflected in neuroanatomical reference atlases, is presumably encoded in some way in the species genome. The mesoscopic scale marks the transition from the microscale subjected to strong individual variation, to a larger scale corresponding to species-typical neuroanatomical reference atlases. In fact, this procedure provides an empirical definition of the mesoscopic scale.
It is not a priori obvious that coarse graining is permitted or useful for brain circuits: it is certainly true that information is lost in any coarse-graining procedure and, unlike in physics, this lost information may have critical biological significance (for example, the detailed contents of memories stored as patterns of synaptic weights). However, the question is not whether important neurobiological information is lost, but whether important neurobiological information is retained after such coarse graining. The hypothesis is that indeed such information is retained. The place theory that associates “function” to specific brain regions remains one of the most robust foundational ideas in neuroscience, and Brodmann’s regional map of cortex remains one of the most reproduced figures in 20th century neuroscience. Further, the usage of an intermediate length scale is not an endorsement of a random statistical model of the microcircuit (cf. Peter’s rule [Braitenberg and Schüz, 1998]). As an analogy, encapsulation into black boxes is a widely used engineering idea, but this in no way implies that the interiors of the boxes are featureless.
Relation to Regions Defined in Brain Atlases
One simple operational definition of the neuroanatomical meoscale could be in terms of regions delineated in classical histological atlases (Swanson, 2004). However, this definition needs refinement for two reasons: first, the classical neurohistological atlases disagree, giving rise to a concordance problem (Bohland et al., 2009a), which is exacerbated by corresponding disagreements in nomenclature. Second, the methodology traditionally used to draw the corresponding regional boundaries is visual examination by experts; this methodology has been grafted on to the more contemporary data sets using volumetric morphing methods that use elastic deformations to superpose an expert atlas on to the digital brain volumes (Hawrylycz et al., 2011). This approach however negates an important advantage of having whole-brain histological data sets in the first place, namely the possibility of objectively determining the boundaries of the regions in terms of digitized histological data. It is to be hoped that future analysis will rectify this important defect. Third, summarizing connectivity data in terms of connections between nodes defined by regions in neuroanatomical atlases is problematic because it loses spatial information and negates a major advantage of having the whole-brain data sets. Thus, the mesoscale approach retains spatial information but employs a coarse graining that aims to reveal the species-typical aspects of the mesocircuit.
The existence of the classical hand-drawn atlases that summarize expert neuroanatomical knowledge of observations and the literature does point to the existence of a biological meaningful mesoscale. A data-driven method for discovering this scale would proceed by associating local statistical features with individual spatial points, then determining local regions over which these features are consistent or similar. There have been previous attempts at such data-driven segmentation (Schleicher et al., 1999), although the systematic development of automated annotation methodology that will apply to individual brains and produce results that can compete with expert annotation remains an open problem. Local features that can be used in such an automated approach include density of neuronal somata of different types characterized by expression levels of proteins or mRNA, density of histological stains such as for Myelin, afferent or efferent projection targets. An important practical constraint is the ability to obtain several of these stains or contrasts simultaneously on a given brain of interest.
The Role of Cell Types
It is tempting to define a mesocircuit in terms of cell types, where brain regions are clusters of cells of the same type, and the mesocircuit corresponds to the connectivity matrix between the different classes of cell types. However, such a procedure is conceptually problematic and without a practical means of implementation. First, even after a century of work (dating back to morphologically defined cell types in Cajal’s work [Ramón y Cajal, 1953]), there is as yet no clear and comprehensive delineation of neuronal cell types in bigger brains—notably, one of the goals of the Brain Initiative being pursued by the NIH is to produce catalogs of cell types (http://www.nih.gov/science/brain/2025/index.htm). Second, cells of the same type may nevertheless show spatially or topographically structured projections that are biologically meaningful—this information would be important for understanding the mesoscale circuit architecture. Third, the current tools to operationally define cell types, where available, use one or a small number of molecular markers (e.g., mouse CRE lines [Huang and Zeng, 2013]). These generally include a diversity of types; neurobiologically meaningful cell types can be highly combinatorial in terms of the genes involved (Okaty et al., 2011). Also, these genetically defined types are not generally expressed in a spatially localized manner, and circuit mapping still requires tracer injections for suitable spatial localization.
While cell types may not be a useful proxy for defining the mesoscopic scale, they nevertheless constitute a residue of the microscopic patterning that needs to be superposed on mesoscale circuit mapping. One way to do this could be to associate a vector of cell types to each spatial point in a coarse-grained atlas. A hierarchical approach may also be useful here. In terms of circuit dynamics, for example, the sign of a neuronal connection is more important to the qualitative properties of the resulting circuit dynamics than its strength. Thus, one could start from the specification of minimal information about the vector of cell types that enter into the mesocircuit (e.g., excitatory versus inhibitory), then proceed to refine further.
The Grid-Based Approach to Mesoscale Circuit Mapping
The basic method in the mesoscale circuit mapping approach is to inject a tracer substance locally in the brain, as in classical neuroanatomical tract-tracing studies. The tracer is then taken up by the neurons and transported actively away from the somata (anterograde tracing) or toward the somata (retrograde tracing). The active transport step is critical: passive diffusion is too slow to fill the lengthy processes of projection neurons for significantly sized brains. This process ideally labels a small group of neurons in the brain, with their somata clustered at the injection site (for anterograde labeling), or axon terminals present at the injection site. Subsequent visualization of the neuronal processes and somata in the whole brain then provides information about neuronal processes originating from or terminating at the injection site. The tracers used, as well as the method used to visualize the brain and the neuronal processes, can vary.
In neuroanatomical research employing tracer injections during the preautomation era, individual research projects have typically targeted selected regions in the brain for the obvious reasons of operational tractability. Tentative hypotheses about projections obtained from an initial set of injections are usually confirmed by injections using tracers transported in the opposite direction, placed at the projection locations determined from the first set of injections. Complementary studies employing electrophysiological methods or microscopic confirmation of synapses using EM are also performed, with the original tracer injections typically providing only a part of the full experimental data set that is eventually used to infer neuroanatomical connectivity between regions.
The interpretational method employed in these classical tracer-injection studies largely involves expert neuroanatomists spending extensive time on individual brains to visually identify the location of injection and projection sites and tabulating the results. The connections are typically noted in qualitative terms, with the fraction of the papers dealing with quantitative measurements being relatively limited. The resulting primary literature is vast, but with a few exceptions (e.g., the BAMS database for rat [http://brancusi1.usc.edu/overview/] or the Cocomac database for the macaque monkey [http://cocomac.org/home.asp] and a few more) the data are not curated into usable computational artifacts. The BAMS database is perhaps the most complete available data set of literature-curated information about brain-wide connectivity in a given species, but even this database in the previously most widely studied species is far from complete in its coverage of the whole brain. An advantage however of the literature-curated databases is that they assemble individual pieces of evidence from the peer reviewed neuroanatomical literature with known provenance.
The grid-based approach, in contrast, covers the brain systematically in tracer injections, the goal being to assemble the information in the resulting data sets to derive information about brain-wide circuit architecture. This puts the onus on the computational methods used to represent, analyze, and interpret the results and also raises the question of reconciling this information with that present in the previous literature. This computational and theoretical program is still in its infancy and is discussed more extensively in a subsequent section.
Grid-Based Mesoscale Connectivity Data Sets for Mouse
Several data sets are now available, at different stages of completion and brain-coverage, for the grid-based connectivity mapping approach in mouse.
A data set of anterograde tracer injections with brain-wide coverage is available from the Allen Institute for Brain Research (http://connectivity.brain-map.org/), currently containing a total of 1,772 imaged brains. In a recently published study (Oh et al., 2014), these authors analyze a subset of these data consisting of 469 imaged brains, each with a single injection of an adeno-associated virus (AAV) viral vector expressing GFP in the infected neurons. The fluorescently labeled brains are imaged at 100 μm spacing (~100 sections/brain) and the resulting data volumetrically registered onto a common atlas with a voxel size of 100 μm3. The injection site is manually delineated. After excluding voxels corresponding to major white matter tracts, fluorescent intensity in the remaining voxels is interpreted as neuronal connectivity strength. The voxels are grouped into 213 brain compartments, giving rise to a 469 × 213 matrix, which is then subjected to further modeling assumptions to infer a “connectivity matrix” between 213 brain compartments, which the authors report and analyze.
A second data set viewable at http://mouse.brainarchitecture.org from Cold Spring Harbor Laboratory currently contains 660 imaged brains, each with a single tracer injection. Four tracers, two anterograde (AAV and biotinylated dextran amine [BDA]) and two retrograde (choleratoxin subunit B [CTB] and a replication incompetent rabies virus [RV]) are employed in the project. Two of these are visualized using fluorescent label (AAV and RV) and two employing histochemical labeling and brightfield imaging (CTB and BDA). Each brain consists of ~500 sections, 20 μm apart, with alternate sections carrying a Nissl stain, standard in classical neuroanatomical practice in order to localize a labeled cell or process.
A third data set at http://mouseconnectome.org from USC presents 161 imaged brains with a total of 317 injection sites. Each brain is injected with four fluorescent tracers at two distinct injection sites, the first site injected with CTB (retrograde) and phaseolus vulgaris leucoagglutinin (PHA-L) (anterograde), and the second site with fluorogold (FG) (retrograde) and BDA (anterograde). The sections are Nissl counterstained. The imaged sections are 200 μm apart, with each brain consisting of ~50 sections. A subset of these data containing corticocortical projections has been recently published (Zingg et al., 2014), with the data being summarized as a 49 × 49 matrix of corticocortical projections, derived using the traditional method of visual inspection of the images and “mapping” of the locations of labeled projections onto atlas compartments.
Other data sets using a grid-based tracer injection approach targeted to subcompartments of the brain are also becoming available (cf. a thalamocortical projection map published recently [Hunnicutt et al., 2014] utilizes 254 injections of AAV in 75 mouse brains to systematically cover the thalamic compartment). With decreasing cost and increasing efficiency for storage/computing relevant to whole-brain data sets, as well as whole-brain imaging techniques, more such data sets are expected in the near future. Although some analogies may be drawn between mapping brain structure and mapping genome sequences, neuroanatomy is not quite genomics. While the goal of mesoscale circuit mapping is indeed to establish species-typical references for brain-wide connectivity, even the proper method of representation of such a “reference circuit” remains to be established through appropriate computational and conceptual analysis. The “mesocircuit” of the mouse brain remains work in progress.
Other Species and Developmental Stages
Genomics would be greatly diminished in value if we only had the genome of a single species (the situation is currently worse in mouse: the main available data sets are for a single inbred strain, C57BL/6, and only in the male). Many important biological insights have come from comparative genomics, which provides a window into genomic evolution. The comparative method in neuroscience has languished in recent decades (Striedter et al., 2014), with attention increasingly focused on a few model organisms. This is in significant contrast with the pioneering investigators such as Cajal or Brodmann, who freely moved between dozens of species in their foundational neuroanatomical studies.
As a result, basic issues (such as the nature of the homologies between avian and mammalian brains) remain controversial (Jarvis et al., 2005). There is a pressing need therefore for mesoscale circuit mapping in representatives of different animal taxa. Availability of more than one such species-typical mesocircuit will enable the comparison of circuit maps across species, making these data sets stand on their own (as is the case in comparative genomics). A similar case can be made about developmental stages. The resource established by the late Edward T. Jones (http://brain-maps.org) provides a sparse set of tracer-injected data sets across different taxa. The common marmoset, Callithrix jacchus (the focus of the Japanese brain initiative, http://www.lifescience.mext.go.jp/files/pdf/n1332_07.pdf) and the zebra finch, Taenopygia guttata (subject to a current whole-brain gene expression mapping project, http://www.zebrafinchatlas.org/) are likely future candidates for mesocircuit mapping projects in other vertebrate taxa. To study the presence of convergent circuit motifs at the mesocircuit level, as well as deep homologies, it will also be essential to study complex invertebrates with large brains. Octopus species are intriguing in this regard (Young, 1971). However, the methodology required for mesocircuit studies of sufficiently complex invertebrate brains will likely be quite different and beyond the scope of this Perspective.
What Can We Learn? Data Representation, Visualization, Analysis, and Interpretation
The raw data from tracer-injected whole brains as discussed here are potentially valuable to individual investigators studying specific brain regions or circuits, as a basic resource. However a primary motivation of mesoscale circuit mapping is to extract useful new scientific insight at the whole-brain level into how brains work. Without such insights, the research enterprise may well be criticized as being “low input, high throughput, no output biology” (Sydney Brenner, quoted in Brenner, 2008). It is instructive in this regard to revisit the history of neuroanatomical research, particularly the foundational work by Cajal, who produced a prodigious amount of raw data (in the form of hand-drawn images of Golgi-stained neurons). In modern parlance, Cajal could have published a “resource,” a volume of illustrations consisting of his thousands of neuroanatomical images. While this large corpus of primary observation was central to Cajal’s work, he went on to piece together many individual data sets to derive insight into the organization of the nervous system.
In an early precursor of the analytical challenges presented by the individual digital data sets that have to be combined and interpreted, the drawings published by Cajal were composites of many individual drawings. He states in a letter, “In a combined image, all the cells are copied with precision; the only trick (already used by Golgi, van Gehuchten, Retzius) consists of uniting in a single drawing the elements collected in several sections of the same region. Without this trick, my book on neural centers would have required more than 3,000 figures, and that at a time of economic penury in which a dozen engravings knocked off balance my domestic budget” (cited in De Carlos and Borrell, 2007).
Anxiety about data overload due to the ability to quickly acquire large volumes of primary data, and to disseminate it on the Internet, is not particular to neuroscience or biology. It is an irreversible technological shift that is likely to stay; nostalgia for a predigital era of research may be misplaced in light of the real advantages that computational access to digital whole-brain data sets can bring to the table. However, it would be greatly wasteful to relearn the lessons of the predigital era. A thorough examination of the existing neuroanatomical knowledge base, and incorporation of the strategies employed previously by neuroanatomists, is therefore necessary. Thus, questions of data representation, analysis, and interpretation are central to the study of the whole-brain data sets for mesoscale circuit mapping. In this regard, there are some important conceptual deficits in current approaches to mesoscale connectivity data as discussed below. Rectification of these deficits is a future challenge that needs to be addressed in order to uncover the full value of the approach.
Regional Connectivity Matrices as Data Summaries with Limitations
The mathematical construct generally used to represent neural circuitry is a directed graph, or equivalently a connectivity matrix. At the mesoscopic scale, data have been summarized in terms of regional connectivity matrices. Three methods have been employed to construct connectivity matrices: literature curation (Bota et al., 2005), visual examination of whole-brain data sets (Zingg et al., 2014), and fluorescent intensity from anterograde tracer injections (Oh et al., 2014). While these regional connectivity matrices have their utility and correspond to a widespread intuitive notion about brain connectivity, they nevertheless suffer from significant problems.
First, there are issues with defining the regions themselves (that correspond to the “nodes” of these connectivity graphs) and associated nomenclature. While boundaries between some brain compartments are unambiguous, this is not always the case and there is significant disagreement between different neuroanatomical atlases as to how the brain should be segmented into compartments, especially at the finer scales (Swanson, 2004; Paxinos, 1991). To the extent that the connectivity data are needed to define brain compartments, there is also a potential of circularity in defining the compartments a priori. These concerns can be addressed by adopting a purely volumetric approach, using a connectivity graph between spatial voxels that are later annotated into regions. Further, the extent of the injections is governed by a physical process (i.e., fluid pressure or electric field-driven tracer transport), which does not necessarily respect regional boundaries. Genetic methods to target specific cell types have also been proposed as a method to localize brain compartments (Oh et al., 2014), but these cell types generally are not confined to a small region of brain space, and injections remain part of the protocol. So long as tracer injections remain the basic method to determine mesoscale connectivity, these problems will remain—however by varying injection sizes, increasing coverage with smaller sized injections, and usage of a spatial/geometric approach, it should be possible to ameliorate these concerns.
A second issue is the actual determination of the weights in the connectivity matrix. Human visual examination is subjective; on the other hand, crude quantifications such as total fluorescent intensity of labeled neurons do not reflect the underlying neurobiological objects of interest (synapses or somata). When examining histological sections, neuroanatomists typically examine the subcellular structure (somata, potential synapses, or neuronal arborization patterns) in order to make judgments about connectivity. Machine vision approaches that mimic the behavior of expert neuroanatomists when performing the data analysis, by segmenting out the relevant subcellular structure, as well as applications of stereological quantification methods to correct for the information loss from optical sectioning (Hilliard and Lawson, 2003), can be used to make progress on this issue. Viral tracers that are able label pre- and postsynaptic sites directly would also be helpful.
Another problem with summarizing the tracer injection data in terms of regional connectivity matrices arises from the presence of “fibers of passage.” Axonal fibers that do not have synapses in the injection region may nevertheless take up the neuronal tracer. In this case, the injection region should not be interpreted as being connected to other regions to which the tracer label is transported. Similarly, appearance of a labeled fiber is no guarantee that there is a synaptic connection to neurons present at the injection site.
Conceptual Inadequacy of Regional Connectivity Matrices: Inability to Represent Collateral Branching
Difficulties in precisely delineating regions, and precise methods to assign quantitative weights to the connectivity graph, are practical rather than conceptual issues. However, there is a problem with the basic representation mechanism in terms of regional connectivity matrices or graphs. Such matrices cannot capture a fundamental property of mesoscopic circuit architecture that may be of primary importance in understanding circuit function at this scale, namely the collateral branching patterns of projecting neurons. This is illustrated in Figure 2 by employing three regional “nodes” A, B, and C. In both cases (Figures 2A and 2D), the regional connectivity matrices have directed edges between the node pairs (A and C) and (A and B). However, in the first case (Figure 2A), different neurons project from A to C than do from A to B. In the second case (Figure 2B), the same neuron with somata in region A sends collateral branches to regions B and C. The difficulty is that the connectivity matrix representation cannot in principle capture the distinction between the two cases, one with collateral branches and one without.
One way to represent the difference between the two cases would be to introduce a hidden node H (Figures 2C and 2F), representing the branch point in the second case, to generate an augmented 4 × 4 matrix. The two cases then correspond to different augmented matrices. In other words, the tree-like morphology of the neurons must be explicitly captured. Projection neurons in the brain typically have several collateral branches, so a number of hidden nodes would have to be introduced to capture the generic situation.
Experimentally, the conceptually simplest method to determine the collateral branching patterns of neurons is to trace single neurons over their full extent. This has been done in the past using manual tracing. Whole-brain imaging coupled with sparse labeling would be a way to tracer several individual neurons, and indeed such an approach has been employed in the fruit fly (Chiang et al., 2011). However, unless the brain sizes are small, it would be difficult to build up adequate statistics in this manner for a large number of neurons spanning the entire brain. The question naturally arises if it is possible to obtain information to collateral branching at the mesoscale using the tracer injection method.
Information about collateral branches cannot be definitively determined using anterograde tracer injections only, unless the data permits single-neuron tracing. This is not feasible for injections of even moderate size since axons may be difficult to distinguish in optical imaging data, or may even be below optical resolution and therefore not visible. However, it is possible to retrieve information about collateral branching using injections of retrograde tracers. A standard method for doing this is to use coinjections of two retrograde tracers corresponding to two fluorescent color labels, at two distal sites (Figure 2G) (van der Kooy et al., 1978). Jointly labeled neuronal somata can then be inferred to be sending collateral branches to the injected locations. This method may be used to test hypotheses about pairs of collateral branches. However, it is not easily scalable to a grid-based approach: for N grid sites, one would require ~N2 injection pairs, and this would only yield information about pairwise collateral branches. Using more than two colors to inject makes the combinatorics worse.
Interestingly, even individual retrograde tracer injections carry information about collateral branching, as long as the “retrograde” tracer labels the entire neuron (as is the case, for example, with CTB). As can be seen from Figure 2H, if the somata are clustered in a single spatial location, then a retrograde tracer injection at any of the efferent locations; if it labels the entire neuron, it also reveals the other efferent locations and therefore the entire collateralized branching pattern. The complication is that a multiplicity of spatially clustered groups of somata will in general project to any given efferent location. In this case, a superposition of the collateral patterns of these different groups of somata will be labeled in the whole brain. The intriguing possibility is that by combining the set of retrograde (and anterograde) tracer injections on a grid, it may be possible to infer the set of underlying collateral branching patterns. At a minimum, it is clear that the retrograde tracer label may be used to rule out certain hypotheses about the collateralization patterns.
Grid-based tracer injection data employing both anterograde and retrograde tracers may be thought of as the surface observations corresponding to a hidden underlying structure, namely the collection of collateralized branching patterns of different morphological neuronal types composing the mesocircuit. The desired analytical approach to these observations would then be to interpret the data in terms of neurobiologically salient hidden variables. Thus, the observed matrices would be regarded as constraints on a set of underlying tree patterns (which could be represented as matrices with unobserved nodes). A similar hidden variable approach has recently proven productive in understanding the coexpression patterns of brain-wide gene expression in the mouse (Grange et al., 2014). This is an exciting conceptual challenge that emerges from the available tracer injection data sets.
The Inadequacy of Current Graph-Theoretical Analyses
Graph theory is a well-developed branch of mathematics that has achieved particular prominence in recent decades. A graph may be defined as a collection of vertices or nodes, and edges connecting those vertices, and may be represented using a connectivity matrix with nonzero entries corresponding to the edges. Much of graph theory therefore reduces to manipulations of the associated matrices. The current prominence of graph theory is in large part due to the social impact of applications such as Internet search algorithms or the analysis of social networks. Notably, there is no a priori reason why the same algorithms should necessarily be informative for neuroanatomical research.
We have argued that regional connectivity matrices are representationally inadequate to capture the tree-like collateral branching patterns of projecting neurons. However, if one does accept the connectivity matrices as intermediate data summaries, one then needs to understand the types of analyses that may be fruitful starting with such connectivity graphs. A number of graph theoretical characterizations have been brought to bear on regional connectivity matrices (Bullmore and Sporns, 2009). Leaving aside for the moment the important issue of the quality and completeness of information in these matrices, we can consider the utility (or lack thereof) of these characterizations.
The graph theoretical analysis can be grouped into two broad classes: the derivation of summary statistical measures based on the connectivity graphs (e.g., node-degree distributions) and partitioning of the graph into subgraphs or identification of sets of nodes with “special” properties. Statistical measures from the first class of analyses may be used to classify the graphs themselves (e.g., scale-free or small-world) and to posit statistical ensembles from which the graphs are drawn or generative processes that can produces similar graphs. Closely related to such statistical characterization is the identification of special sets of nodes (e.g., “hubs” with a disproportionately large number of edges), the idea being that this is a way to discover “functional” characteristics of the graph. This is an appealing idea, and this kind of exercise is a relatively easy one once a connectivity matrix has been made available. Unfortunately, experience also shows that these types of statistical characterizations and summary measures can be misleading and without real significance for the underlying problem domain.
Analysis of network connectivity of the Internet and the identification of vulnerable, highly connected hubs using related methods provides a cautionary case study (Willinger et al., 2009). Original work based on indirect measurements (traceroute) led to the inference of a power-law node degree distribution of the Internet (Faloutsos et al., 1999). This was interpreted in terms of the Internet as a scale-free network (Albert et al., 2000) and widely reported predictions were made of vulnerable, highly connected hubs on the Internet. However, these inferences that continue to be highly cited have also been shown to be incorrect and misleading (Willinger et al., 2009). These latter authors point out that the scale-free modeling paradigm and the presence of vulnerable hubs is not consistent with detailed domain knowledge, namely the designed nature of the Internet and constraints imposed by technological, economic, and practical considerations. Similar dangers exist in applying statistical measures on connectivity graphs (not confined to the example of scale-free networks) without adequately deep integration of neuroanatomical knowledge and understanding.
A second class of analysis relies on graph partitioning methods to discover subnetworks or modules. While less susceptible to inferential errors due to the simplicity of the statistical modeling paradigm, such analysis also needs to occur in close tandem with prior neuroanatomical knowledge in order to be useful. An overarching theme, therefore, is that the graph theoretical analysis of the connectivity graphs per se is quite limited and may be misleading, pointing to the importance of integrating neuroanatomical domain knowledge and literature.
The Importance of Developmental and Comparative Analysis
Two types of neuroanatomical domain knowledge that are of direct relevance to mesocircuit data sets come from nervous system development and comparative/evolutionary analyses. Notably, such analyses can be carried out within whole-brain mesocircuit data sets that span developmental stages and taxa. The projection patterns that constitute the mesocircuit in the adult brain are highly spatially organized and reflect a dynamical growth process that includes organized movements of neuronal somata (radial and tangential movements relative to the neuraxis) as well as growth patterns of axons along interstitial spaces in compartments (Nieuwenhuys et al., 1998). Understanding mesocircuit architecture in terms of these developmental processes, potentially aided by developmental tracer injection data sets, is a promising future direction for data analysis. Another set of interesting computational challenges is associated with the establishment of homologies between brain regions of different species, and subsequently the homologies between projection patterns. This requires the solution of the “correspondence problem” (which locations in the brains of two different species are in correspondence?). A computational comparison of the published mouse regional connectivity matrices, and the literature curated connectivity matrix available for rat, would be a first step in this direction.
Conclusions
Mesoscale circuit mapping projects across vertebrate taxa promise fundamental scientific insights into brain architecture, development, and evolution. By enabling the study of entire brains, this approach promises to help in integrating the growing body of disparate and fragmented neuroscientific knowledge. Current efforts in this area are focused on the mouse, although to obtain the full power of analyzing whole brains at the mesoscopic scale, it will be necessary to gather data sets in other taxa as well as during development. Success in this new field will be contingent on proper data representation, analysis, and interpretation. Even the seemingly innocuous step of representing the data in terms of regional connectivity matrices results in the loss of conceptually important information about collateral branching patterns of neurons. Incorporation of past neuroanatomical knowledge and expertise is an important challenge that must be properly addressed in order to ensure success of this promising research enterprise. To address this challenge it will be necessary to encapsulate the cognitive strategies and background knowledge of expert neuroanatomists into computational tools that can be brought to bear on these data sets.
References
- Ade PA, Aikin RW, Barkats D, Benton SJ, Bischoff CA, Bock JJ, Brevik JA, Buder I, Bullock E, Dowell CD, et al. Detection of B-mode polarization at degree angular scales by BICEP2. Phys Rev Lett. 2014;112:241101. doi: 10.1103/PhysRevLett.112.241101. [DOI] [PubMed] [Google Scholar]
- Albert R, Jeong H, Barabasi AL. Error and attack tolerance of complex networks. Nature. 2000;406:378–382. doi: 10.1038/35019019. http://dx.doi.org/10.1038/35019019. [DOI] [PubMed] [Google Scholar]
- Alivisatos AP, Chun M, Church GM, Greenspan RJ, Roukes ML, Yuste R. The brain activity map project and the challenge of functional connectomics. Neuron. 2012;74:970–974. doi: 10.1016/j.neuron.2012.06.006. http://dx.doi.org/10.1016/j.neuron.2012.06.006. [DOI] [PMC free article] [PubMed] [Google Scholar]
- Anderson PW. More is different. Science. 1972;177:393–396. doi: 10.1126/science.177.4047.393. [DOI] [PubMed] [Google Scholar]
- Bennett MR, Hacker PMS. Philosophical Foundations of Neuroscience. Malden: Blackwell; 2003. [Google Scholar]
- Bohland JW, Bokil H, Allen CB, Mitra PP. The brain atlas concordance problem: quantitative comparison of anatomical parcellations. PLoS ONE. 2009a;4:e7200. doi: 10.1371/journal.pone.0007200. http://dx.doi.org/10.1371/journal.pone.0007200ss. [DOI] [PMC free article] [PubMed] [Google Scholar]
- Bohland JW, Wu C, Barbas H, Bokil H, Bota M, Breiter HC, Cline HT, Doyle JC, Freed PJ, Greenspan RJ, et al. A proposal for a coordinated effort for the determination of brainwide neuroanatomical connectivity in model organisms at a mesoscopic scale. PLoS Comput Biol. 2009b;5:e1000334. doi: 10.1371/journal.pcbi.1000334. http://dx.doi.org/10.1371/journal.pcbi.1000334. [DOI] [PMC free article] [PubMed] [Google Scholar]
- Bota M, Dong HW, Swanson LW. Brain architecture management system. Neuroinformatics. 2005;3:15–48. doi: 10.1385/NI:3:1:015. http://dx.doi.org/10.1385/NI:3:1:015. [DOI] [PubMed] [Google Scholar]
- Braitenberg V, Schüz A. Cortex: Statistics and Geometry of Neuronal Connectivity. 2. Berlin: Springer; 1998. [Google Scholar]
- Brenner S. An interview with… Sydney Brenner. Interview by Errol C. Friedberg. Nat Rev Mol Cell Biol. 2008;9:8–9. doi: 10.1038/nrm2320. http://dx.doi.org/10.1038/Nrm2320. [DOI] [PubMed] [Google Scholar]
- Broca P. Remarks on the seat of the faculty of articulated language, following an observation of aphemia (loss of speech) Bulletin de la Société Anatomique. 1861;6:330–357. [Google Scholar]
- Brodmann K, Gary LJ. Brodmann’s Localization in the Cerebral Cortex: The Principles of Comparative Localization in the Cerebral Cortex Based on Cytoarchitectonics. New York: Springer; 2006. [Google Scholar]
- Bullmore E, Sporns O. Complex brain networks: graph theoretical analysis of structural and functional systems. Nat Rev Neurosci. 2009;10:186–198. doi: 10.1038/nrn2575. http://dx.doi.org/10.1038/nrn2575. [DOI] [PubMed] [Google Scholar]
- Chiang AS, Lin CY, Chuang CC, Chang HM, Hsieh CH, Yeh CW, Shih CT, Wu JJ, Wang GT, Chen YC, et al. Three-dimensional reconstruction of brain-wide wiring networks in Drosophila at single-cell resolution. Curr Biol. 2011;21:1–11. doi: 10.1016/j.cub.2010.11.056. http://dx.doi.org/10.1016/j.cub.2010.11.056. [DOI] [PubMed] [Google Scholar]
- Chomsky N. Aspects of the Theory of Syntax. Cambridge: MIT Press; 1965. [Google Scholar]
- De Carlos JA, Borrell J. A historical reflection of the contributions of Cajal and Golgi to the foundations of neuroscience. Brain Res Brain Res Rev. 2007;55:8–16. doi: 10.1016/j.brainresrev.2007.03.010. http://dx.doi.org/10.1016/J.Brainresrev.2007.03.010. [DOI] [PubMed] [Google Scholar]
- Faloutsos M, Faloutsos P, Faloutsos C. On power-law relationships of the internet topology. ACM SIGCOMM Computer Communication Review. 1999;29:251–262. [Google Scholar]
- Fenno L, Yizhar O, Deisseroth K. The development and application of optogenetics. Annu Rev Neurosci. 2011;34:389–412. doi: 10.1146/annurev-neuro-061010-113817. http://dx.doi.org/10.1146/Annurev-Neuro-061010-113817. [DOI] [PMC free article] [PubMed] [Google Scholar]
- Grange P, Bohland JW, Okaty BW, Sugino K, Bokil H, Nelson SB, Ng L, Hawrylycz M, Mitra PP. Cell-type-based model explaining coexpression patterns of genes in the brain. Proc Natl Acad Sci USA. 2014;111:5397–5402. doi: 10.1073/pnas.1312098111. http://dx.doi.org/10.1073/pnas.1312098111. [DOI] [PMC free article] [PubMed] [Google Scholar]
- Grillner S. Megascience efforts and the brain. Neuron. 2014;82:1209–1211. doi: 10.1016/j.neuron.2014.05.045. http://dx.doi.org/10.1016/j.neuron.2014.05.045. [DOI] [PubMed] [Google Scholar]
- Hawrylycz M, Baldock RA, Burger A, Hashikawa T, Johnson GA, Martone M, Ng L, Lau C, Larson SD, Nissanov J, et al. Digital atlasing and standardization in the mouse brain. PLoS Comput Biol. 2011;7:e1001065. doi: 10.1371/journal.pcbi.1001065. http://dx.doi.org/10.1371/journal.pcbi.1001065. [DOI] [PMC free article] [PubMed] [Google Scholar]
- Helmstaedter M, Mitra PP. Computational methods and challenges for large-scale circuit mapping. Curr Opin Neurobiol. 2012;22:162–169. doi: 10.1016/j.conb.2011.11.010. http://dx.doi.org/10.1016/j.conb.2011.11.010. [DOI] [PMC free article] [PubMed] [Google Scholar]
- Hess WR. Hypothalamus und Thalamus, Experimental-Dokumente. Stuttgart: F. Thieme; 1956. [Google Scholar]
- Hilliard JE, Lawson LR. Stereology and Stochastic Geometry. Dordrecht: Kluwer Academic Publishers; 2003. [Google Scholar]
- Huang ZJ, Zeng H. Genetic approaches to neural circuits in the mouse. Annu Rev Neurosci. 2013;36:183–215. doi: 10.1146/annurev-neuro-062012-170307. http://dx.doi.org/10.1146/annurevneuro-062012-170307. [DOI] [PubMed] [Google Scholar]
- Hunnicutt BJ, Long BR, Kusefoglu D, Gertz KJ, Zhong H, Mao T. A comprehensive thalamocortical projection map at the mesoscopic level. Nat Neurosci. 2014;17:1276–1285. doi: 10.1038/nn.3780. http://dx.doi.org/10.1038/nn.3780. [DOI] [PMC free article] [PubMed] [Google Scholar]
- Jackson JD. Classical Electrodynamics. Third. New York: Wiley; 1999. [Google Scholar]
- Jarvis ED, Güntürkün O, Bruce L, Csillag A, Karten H, Kuenzel W, Medina L, Paxinos G, Perkel DJ, Shimizu T, et al. Avian Brain Nomenclature Consortium. Avian brains and a new understanding of vertebrate brain evolution. Nat Rev Neurosci. 2005;6:151–159. doi: 10.1038/nrn1606. http://dx.doi.org/10.1038/nrn1606. [DOI] [PMC free article] [PubMed] [Google Scholar]
- Johnson DMG, Illig KR, Behan M, Haberly LB. New features of connectivity in piriform cortex visualized by intracellular injection of pyramidal cells suggest that “primary” olfactory cortex functions like “association” cortex in other sensory systems. J Neurosci. 2000;20:6974–6982. doi: 10.1523/JNEUROSCI.20-18-06974.2000. [DOI] [PMC free article] [PubMed] [Google Scholar]
- Krogh A. The progress of physiology. Science. 1929;70:200–204. doi: 10.1126/science.70.1809.200. http://dx.doi.org/10.1126/Science.70.1809.200. [DOI] [PubMed] [Google Scholar]
- Mitra PP, Rosa MG, Karten HJ. Panoptic neuroanatomy: digital microscopy of whole brains and brain-wide circuit mapping. Brain Behav Evol. 2013;81:203–205. doi: 10.1159/000350241. http://dx.doi.org/10.1159/000350241. [DOI] [PubMed] [Google Scholar]
- Nieuwenhuys R, ten Donkelaar HJ, Nicholson C. The Central Nervous System of Vertebrates. Berlin: Springer; 1998. [Google Scholar]
- Oh SW, Harris JA, Ng L, Winslow B, Cain N, Mihalas S, Wang Q, Lau C, Kuan L, Henry AM, et al. A mesoscale connectome of the mouse brain. Nature. 2014;508:207–214. doi: 10.1038/nature13186. http://dx.doi.org/10.1038/nature13186. [DOI] [PMC free article] [PubMed] [Google Scholar]
- Okaty BW, Sugino K, Nelson SB. A quantitative comparison of cell-type-specific microarray gene expression profiling methods in the mouse brain. PLoS ONE. 2011;6:e16493. doi: 10.1371/journal.pone.0016493. http://dx.doi.org/10.1371/journal.pone.0016493. [DOI] [PMC free article] [PubMed] [Google Scholar]
- Paxinos G. Atlas of the Developing Rat Brain. San Diego: Academic Press; 1991. [Google Scholar]
- Ramón y Cajal S. A quelle epoque apparaissent les expansions des cellule nerveuses de la moelle epinere du poulet. Anat Anzerger. 1890;5:609–613. [Google Scholar]
- Ramón y Cajal S. Significación fisiológica de las expansiones proto-plásmicas y nerviosas de las células de la sustancia gris. Rev Cienc Méd Barc. 1891;27:1–15. [Google Scholar]
- Ramón y Cajal S. Histologie du système nerveux de l’homme & des vertébrés. Madrid: Consejo Superior de Investigaciones Científicas, Instituto Ramón y Cajal; 1953. [Google Scholar]
- Ramón y Cajal S. Histology of the Nervous System of Man and Vertebrates. New York: Oxford University Press; 1995. [Google Scholar]
- Schleicher A, Amunts K, Geyer S, Morosan P, Zilles K. Observer-independent method for microstructural parcellation of cerebral cortex: A quantitative approach to cytoarchitectonics. Neuroimage. 1999;9:165–177. doi: 10.1006/nimg.1998.0385. http://dx.doi.org/10.1006/nimg.1998.0385. [DOI] [PubMed] [Google Scholar]
- Striedter GF, Belgard TG, Chen CC, Davis FP, Finlay BL, Güntürkün O, Hale ME, Harris JA, Hecht EE, Hof PR, et al. NSF workshop report: discovering general principles of nervous system organization by comparing brain maps across species. Brain Behav Evol. 2014;83:1–8. doi: 10.1159/000360152. http://dx.doi.org/10.1159/000360152. [DOI] [PMC free article] [PubMed] [Google Scholar]
- Swanson LW. Brain Maps III: Structure of the Rat Brain: An Atlas with Printed and Electronic Templates for Data, Models, and Schematics. 3. Amsterdam: Elsevier; 2004. [Google Scholar]
- van der Kooy D, Kuypers HGJM, Catsman-Berrevoets CE. Single mammillary body cells with divergent axon collaterals. Demonstration by a simple, fluorescent retrograde double labeling technique in the rat. Brain Res. 1978;158:189–196. doi: 10.1016/0006-8993(78)90014-8. http://dx.doi.org/10.1016/0006-8993(78)90014-8. [DOI] [PubMed] [Google Scholar]
- Ward S, Thomson N, White JG, Brenner S. Electron microscopical reconstruction of the anterior sensory anatomy of the nematode Caenorhabditis elegans.?2UU. J Comp Neurol. 1975;160:313–337. doi: 10.1002/cne.901600305. http://dx.doi.org/10.1002/cne.901600305. [DOI] [PubMed] [Google Scholar]
- Willinger W, Alderson D, Doyle J. Mathematics and the Internet: A source of enormous confusion and great potential. Notices of the AMS. 2009;56:586–599. [Google Scholar]
- Young JZ. The Anatomy of the Nervous System of Octopus Vulgaris. Oxford: Clarendon Press; 1971. [Google Scholar]
- Zingg B, Hintiryan H, Gou L, Song MY, Bay M, Bienkowski MS, Foster NN, Yamashita S, Bowman I, Toga AW, Dong HW. Neural networks of the mouse neocortex. Cell. 2014;156:1096–1111. doi: 10.1016/j.cell.2014.02.023. http://dx.doi.org/10.1016/j.cell.2014.02.023. [DOI] [PMC free article] [PubMed] [Google Scholar]
- Zinn-Justin J. Phase Transitions and Renormalization Group. Oxford: Oxford University Press; 2007. [Google Scholar]