Abstract
Collaborative information systems (CIS) are deployed within a diverse array of environments, ranging from the Internet to intelligence agencies to healthcare. It is increasingly the case that such systems are applied to manage sensitive information, making them targets for malicious insiders. While sophisticated security mechanisms have been developed to detect insider threats in various file systems, they are neither designed to model nor to monitor collaborative environments in which users function in dynamic teams with complex behavior. In this paper, we introduce a community-based anomaly detection system (CADS), an unsupervised learning framework to detect insider threats based on information recorded in the access logs of collaborative environments. CADS is based on the observation that typical users tend to form community structures, such that users with low a nity to such communities are indicative of anomalous and potentially illicit behavior. The model consists of two primary components: relational pattern extraction and anomaly detection. For relational pattern extraction, CADS infers community structures from CIS access logs, and subsequently derives communities, which serve as the CADS pattern core. CADS then uses a formal statistical model to measure the deviation of users from the inferred communities to predict which users are anomalies. To empirically evaluate the threat detection model, we perform an analysis with six months of access logs from a real electronic health record system in a large medical center, as well as a publicly-available dataset for replication purposes. The results illustrate that CADS can distinguish simulated anomalous users in the context of real user behavior with a high degree of certainty and with significant performance gains in comparison to several competing anomaly detection models.
Keywords: Privacy, Social Network Analysis, Data Mining, Insider Threat Detection
1. INTRODUCTION
Collaborative information systems (CIS) allow groups of users to communicate and cooperate over common tasks in a virtual environment. They have long been called upon to support and coordinate activities related to the domain of “computer supported and cooperative work” [6], but, until recently, CIS were primarily limited to specialized group-ware tools. Recent breakthroughs in networking, storage, and processing have facilitated an explosion in the development and deployment of CIS over a wide range of environments. Beyond computational support, the adoption of CIS has been spurred on by the observation that such systems can increase organizational e ciency through streamlined workflows (e.g., [5]), shave administrative costs (e.g., [10]), assist innovation through brainstorming sessions (e.g., [15]), and facilitate social engagement (e.g., [42]). On the Internet, for instance, the notion of CIS is typified in wikis, video conferencing, document sharing and editing, as well as dynamic bookmarking [13].
At the same time, CIS are increasingly relied upon to manage sensitive information [17]. For instance, various intelligence agencies have adopted CIS environments to enable timely access and collaboration between groups of agents and analysts [31]. These systems contain increasingly large amounts of information on foreign, as well as national, citizens, related to personal relationships, financial transactions, and surveillance activities. The unauthorized passing of information in such systems to emerging whistle-blowing publication organizations, such as WikiLeaks, could be catastrophic to both the managing agency and the individuals to whom the information corresponds. Yet, perhaps the most significant CIS in modern society is the electronic health record (EHR) system [43]. Evidence indicates that the management of patient data in electronic form can decrease health-care costs, strengthen care provider productivity, and increase patient safety [26]. As a result, the Obama administration has pledged over $50 billion dollars to develop, network, and promote the adoption of EHRs.
Given the detail and sensitive nature of the information in emerging CIS, they are a prime target for adversaries originating from beyond, as well as within, the organizations that manage them. Numerous technologies have been developed to mitigate risks originating from outside of the CIS (e.g., [3, 32, 37, 44]). However, less attention has been directed toward the detection of insider threats. While there are some technologies that have been developed to safeguard information from insiders, including the many variants of access control to prevent exposures [2, 7, 11] as well as behavior monitoring tools to discover exposures [23, 29, 30, 36, 38], these are insu cient for emerging CIS. In particular, there are several key limitations of existing insider threat detection and prevention models that we wish to highlight. First, existing models tend to manage each user (or group) as an independent entity, which neglects the fact that CIS are inherently designed to support team-based environments. Second, security models work under the expectation of a static environment, where a user's role or their relationship to a team is well-defined. Again, CIS violate this principle because teams are often constructed on-the-fly, based on the shifting needs of the operation and the availability of the users.
In a CIS, a user's role and relationship to other users is dynamic and changes over time. As a result, it is di cult to di erentiate between “normal” and “abnormal” actions in a CIS based on roles alone. To detect insider threats in a CIS we need to focus on the behavior of the users. More specifically, if we shift the focus to behavior, we need to decide upon which models of behavior to pursue. And, once a prospective set of models is defined, we need to determine which allow for su cient detection of steady behavior. For this work, we work under the hypothesis that typical users within a CIS are likely to form and function as communities. As such, the likelihood that a user acting in an unpredicatable (or unexpected) manner will be characterized by these communities is low. Based on this hypothesis, we focus on the access logs of a CIS to mine relations of users and to model behavioral patterns.
The goal of this paper is to introduce a framework to detect anomalous insiders from the access logs of a CIS in a manner that leverages the relational nature and behavior of system users. The framework is called the community-based anomaly detection system (CADS). CADS leverages the fact that, in collaborative environments, users tend to be team-oriented. As a result, a user should be similar to other users based on their co-access of similar objects in the CIS. For example, in an EHR system, an arbitrary user should accesses similar sets of patients’ records as other users because of commonalities in care pathways (or business operations), such that we can infer which groups of users tend to collaborate by their co-access patterns. This, in turn, should enable the establishment of user communities as a core set of representative patterns for the CIS. Then, given such patterns, CADS can predict which users are anomalous by measuring their distance to such communities.
The main contributions of this paper can be summarized as follows:
Relational Patterns from Access Logs: We introduce a process to transform the access logs of a CIS into community structures using a combination of graph-based modeling and dimensionality reduction techniques.
Anomaly Detection from Relational Patterns: We propose a technique, rooted in statistical formalism, to measure the deviation of users within a CIS from the extracted community structures.
Empirical Evaluation: We utilize several datasets to systematically evaluate the e ectiveness of CADS. First, we study five months of real world access logs from the the EMR system of the Vanderbilt University Medical Center, a large system that is well integrated to the everday functions of healthcare. In addition, to facilitate replication of this work, we report on an evaluation of CADS with a publicly available dataset of editorial board memberships in various journals. In lieu of annotated data, we simulate user behavior, and empirically demonstrate that CADS is more e ective than existing anomaly detection approaches (e.g., [23] and [36]). Our analysis provides evidence that the typical system user is likely to join a community with other users, whereas the likelihood that a simulated user will join a community is very low.
The remainder of this paper is organized as follows. In Section 2, we present prior research related to this work, with a particular focus on access control and anomaly detection. In Section 3, we introduce the CADS framework and describe the specific community extraction and anomaly detection methods that were developed for the framework. In Section 4, we provide a detailed experimental analysis of our methods with several datasets and illustrate how various facets of user behavior influence the likelihood of detection. Finally, we summarize the findings, discuss the limitations, and propose next steps for extensions of this work in Sections 5 and 6.
2. RELATED WORK
The focus of this work is on the detection of insider threats and the mitigation of risk in exposing sensitive information. In general, there are two types of related security mechanisms that have been designed to address this problem. The first is to model and/or mine access rules to manage recourses of the system and its users. The second is to learn patterns of user behavior to detect anomalous insiders. In this section, we review prior research in these areas and relate them to the needs and challenges of CIS.
2.1 Access Control
Formal access control schemas are designed to specify how resources in a system are made available to users. There are a variety of access control models that have been proposed in the literature, some of which have been integrated into real working systems. Here, we review several that are notable with respect to CIS.
The access matrix model (AMM) is a conceptual framework that specifies each user's permissions for each object in the system [37]. Though AMM permits fine-grained mapping of access rights, there are several weaknesses of this framework with respect to CIS. First, it does not scale well, which makes it di cult to apply to CIS, which can contain on the order of thousands of users and millions of objects (e.g., Kaiser Permanente covers over 8 million patients in its healthcare network [9]). Second, the AMM framework lacks the ability to support dynamic changes of access rights.
Role-based access control (RBAC) is designed to simplify the allocation of access rights, by mapping users to roles and then mapping permissions to the roles [2, 32]. While computationally more tractable, the roles created in RBAC tend to be static. As such, they are inflexible and not responsive to the shifting nature of roles, or the allocation of users to rules, in CIS. There are no clear ways to update or evolve RBAC over time. Recently, there have been investigations into role mining [20, 27, 41], which attempts to automatically group users based on the similarity of their permissions, but it is currently unknown how such approaches scale or could be managed dynamically.
The Task-based access control (TBAC) model extends the traditional user-object relationship through the inclusion of task-based and contextual information [29, 40]. TBAC, however, is limited to contexts that relate to activities, tasks, or workflow progress. Collaborative systems require a much broader definition of context, and the nature of collaboration cannot always be easily partitioned into tasks associated with usage counts.
Team-based access control (TeBAC) appears to provide a more natural way of grouping users in an enterprise or organization and associating a collaboration context with the activity to be performed [11]. Yet, at the present moment, these models have not yet been fully developed or implemented, and it remains unclear how to incorporate the team concept into a dynamic framework.
2.2 Anomaly Detection
Anomaly detection techniques are designed to utilize patterns of system use or behavior to determine if any particular user is su ciently di erent than expected. These techniques can be roughly categorized into supervised and unsupervised learning approaches.
In a supervised anomaly detection approach, a set of labeled training instances are provided. The labels are usually of the form “anomaly” and “non-anomaly”, though any number of labels can be applied. The instances are then supplied to learn or parameterize a classification model based on the variable features of the instances. The resulting models are then applied to classify new actions into one (or more) of the labels. Examples of such approaches include support vector machines and Bayesian networks [4, 38]. Supervised models have been shown to have relatively high rates of performance for anomaly detection, however, they are limited in the context of CIS. This is because the key prerequisite (i.e., a clearly labeled training dataset) is di cult to generate for a CIS, particularly in the context of a dynamic and evolving environment. Additionally, it may not be clear what the “features” are that can be used to represent the instances.
By contrast, unsupervised anomaly detection approaches are designed to make use of the inherent structure, or patterns, in a dataset to determine when a particular instance is su ciently di erent. There are numerous variants of un-supervised learning that have been applied to insider thread detection. Three types of unsupervised approaches, in particular, specifically relate to our work: 1) nearest neighbors, 2) clustering, and 3) spectral projection.
Nearest neighbor anomaly detection techniques [23, 39, 30] have been widely used and are related to the approach proposed in this paper. These approaches are designed to measure the distances between instances using features such as social structures. They determine how similar an instance is to other “close” instances. If the instance is not su ciently similar, then it can be classified as an anomaly. However, social structures in a CIS are not explicitly defined, and need to be inferred from the utilization of system resources. If distance measurement procedures are not tuned to the way in which social structures have been constructed, the distances will not represent the structures well. In our experiments, we compare our model to a state-of-the-art nearest neighbor-based method. The results demonstrate that the social structure is crucial to the design of a distance measure.
A second approach is Clustering [19, 14], which is invoked to integrate similar data instances into groups. Methods for clustering depend on a distance measurement similar to that utilized in nearest neighbor methods. The key di erence between the two techniques, however, is that clustering techniques evaluate each instance with respect to the cluster it belongs to, while nearest neighbor techniques analyze each instance with respect to its local neighborhood. The performance of clustering-based techniques is highly dependent on the e ectiveness of clustering algorithms in capturing the structure of normal instances. If the clustering technique requires computation of the pairwise distance for all data instances, then techniques, such as that described in [16], can be quadratic in complexity, which may not be reasonable for real world applications. In collaborative environment, such as EHR, the system can have a large number of users, and there is no obvious social structure, which makes distance measurement and cluster calculation both complex and inappropriate.
A third unsupervised approach is based on spectral projection of the data. Shyu et al. [36], for instance, present a spectral anomaly detection model to estimate the principal components from the covariance matrix of the training data of “normal” events. The testing phase involves comparing each point with the components and assigning an anomaly score based on the point's distance from the principal components. The model can reduce noise and redundancy, however, collaborative systems are team-oriented, which can deteriorate performance of the model as we demonstrate experimentally (See Section 4).
3. CADS FRAMEWORK
In this section, we present the community-based anomaly detection system (CADS). To formalize the problem studied in this work, we will use the following notation. Let U be the set of users who are authorized to access records in the CIS. Let S be the set of subjects whose records exist in the CIS. And, let T be a database of access transactions captured by the CIS, such that t ∈ T is a 3-tuple of the form < u, s, time >, where u ∈ U = {u1, u2, . . . , un}, s ∈ S = {s1, s2, . . . , sm}, and time is the date the user accessed the subject's record. In this paper, m is the number of subjects in collection, and n is the number of users.
We begin this section with a high-level view of the CADS framework. This will be followed by the specific empirical methods applied within the framework.
3.1 Overview of Framework
The CADS framework consists of two general components, as depicted in Figure 1. We refer to the two components as 1) Pattern Extraction (CADS-PE), which feeds into 2) Anomaly Detection (CADS-AD).
Figure 1.

An overview of the community-based anomaly detection system (CADS).
In the CADS-PE component, the CIS access logs are mined for communities of users. One of the challenges of working with CIS access logs is their transactional nature. They do not report the social structure of the organization. Thus, it is necessary to transform the basic transactions into a data structure that facilitates the inference of social relations. The pattern extraction process in CADS-PE consists of a series of steps that result in a set of community patterns. First, the transactions are mapped onto a data structure that captures the relationships between users and subjects. Next, the structure is translated into a relational network of users. Then, the network is decomposed into a spectrum of patterns that models the user communities as probabilistic models.
In the CADS-AD component, the behaviors of the users in the CIS access logs are compared to the community patterns. Users that are found to deviate significantly from expected behavior, as prescribed by the patterns, are predicted as anomalous users. As in the CADS-PE component, the CADS-AD component consists of a process to translate access log transactions into scored events. First, each user is projected onto a subset of the resulting spectrum of communities. Next, the distance between the user and their closest neighbors in the communities is computed. In essence, the distance serves as the basis for a measure of deviance for each user from the derived community structures. The greater the deviance, the greater the likelihood that the user is an anomaly. The following section describes how each of these components is constructed in greater depth.
3.2 Community Pattern Extraction
The goal of the CADS-PE component is to model communities of users in the CIS. Since communities are not explicitly documented, CADS infers them from the relationships observed between users and subject's records in the CIS access logs. The community extraction process consists of three subcomponents: 1) user-subject network construction, 2) transformation to a user-user network, and 3) community inference.
3.2.1 Access Networks of Users and Subjects
The extraction process begins by mapping the transactions in T onto a bipartite graph. This graph is representative of the user-subject access network, such that users and subjects are modeled as vertices, and an edge represents the number of times that a user accessed the subject's record. Figure 2 depicts the translation of transactions into a bipartite graph of users and subjects.
Figure 2.
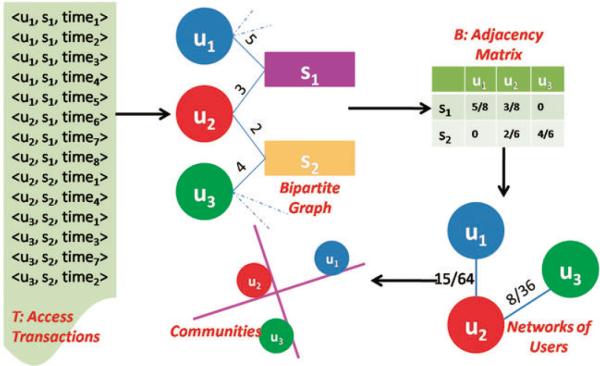
Process of community pattern extraction.
We summarize the information in this graph in an adjacency matrix B of size m × n over an arbitrary time period [start, end], such that cell
| (1) |
where count(〈uj, si, time〉) is the number of access transactions that appeared in the database during the [start, end] period. The cells in this matrix are weighted according to inverse frequency; i.e., the importance of a subject's record is inversely proportionally to the number of users that access their record (e.g., subjects with 2 users contribute 0.5, and with 3 users contribute 0.33). In this way, subjects relate users proportionally to the rarity with which they are accessed [1].
3.2.2 Relational Networks of Users
The access network summarizes the frequency with which a user accesses a subject's record, but to infer communities we need to transform this data structure into one indicative of the relationships between the users. CADS achieves this by generating a user relationship network. This is represented by a matrix C of size n × n, where cell C(i, j) indicates the similarity of the access patterns of users ui and uj in B. To measure the similarity between users, we adopt an information retrieval metric C = BT B, which was depicted in Figure 2. This matrix characterizes the magnitude of the distance between the sets of patients accessed by each pair of users. In general, this matrix represents the inferred relations of users in the CIS.
3.2.3 Community Inference via Spectral Analysis
While the C matrix contains the similarities between all pairs of users, it does not relate sets of users in the form of communities. Principal component analysis (PCA) has been used in earlier social network analysis studies to identify communities (e.g., [8, 28, 24, 33]). Most relevant to this work, [36] utilized PCA to build an intrusion detection model. Specifically, PCA was applied to “normal” training instances to build a model that was composed of the major and minor principal components. The model was then applied to measure the di erence of an anomaly from normal instance via a distance measure based on the principal components. We will compare our model to [36], so we take a moment to illustrate how we do so. In terms of C, the goal is to find a basis P that is a linear combination of the n measurement types, such that P × C = Y , where Y = [Y1, Y2, . . . , Yn]. The rows of P are the principal components of C.1
In a collaborative environment, there are a large number of users and subjects, and, as our experiments illustrate (see Section 4), the C matrix tends to be extremely sparse. The general form of PCA does not scale well, so we use singular value decomposition (SVD), a special case of PCA, to infer communities of normal users. SVD is capable of handing large scale datasets and is particularly useful for sparse matrices [35]. Instead of capturing di erences between users by via distances between all connected vertices in the network [36], we filter the network to retain only the nearest neighbors for each node. For an arbitrary node in the network, the nearest neighbors are discovered via a distance measure based on the principal component space.
For SVD, we define . The covariance of Y′ is calculated as which is equal to Cov = (n − 1)−1CCT. So, by applying SVD, C can be represented as ω^υT , where ω is an orthonormal matrix of size n × n, is a diagonal matrix of n × n with eigenvalues λ1, λ2, ..., λn on the diagonal and values of zero elsewhere, and υ is an orthonormal matrix of size n × n. The columns of υ are the principal components of C. The user relationship matrix C can be projected into the new space to generate a matrix Z = υT C, where Zi = [Zi1, Zi2, ..., Zin]. This matrix can reveal the structure of the user communities. It is this set of communities that CADS uses as the basis of the anomaly detection.
Each row in matrix Z is the projection of all users on a principal component, or community. For example, the first row of Z corresponds to the projection of the users on the first principal component. We define the rate r as
which demonstrates the degree that l principal components account for the original information. [35] showed that when r reaches a destination rate usually as 0.8, the selected l principal components can represent the original information with minimal information loss. Supposing selecting l components from n components r can be reached as a destination rate. In doing so, we truncate the set of communities, such that users are projected onto a subset [Z1, Z2, ..., Zl]. The jth user can be presented as (Z1j, Z2j, ..., Zlj).
The distance between a pair of users is calculated using a Euclidean distance function. Since each principal component Zi in Z has a di erent “weight” in the form of the corresponding eigenvalue, λi should be applied to weight the components when computing the distance. We adopt a modified a Euclidean distance function to measure the distance as follows.
| (2) |
where
| (3) |
. This measure provides more emphasis on the principal components that describe a greater amount of variance in the system. We use this distance measure to derive a matrix D of size n × n. Cell D(i, j) indicates the distance between ui and uj.
3.3 Community-Based Anomaly Detection
The goal of the CADS-AD component is to predict which users in the CIS are anomalous. We developed a process for CADS-AD that consists of two subcomponents 1) discover the nearest neighbors of each user via the CADS-PE community structures and 2) calculate the deviation of each user to their nearest neighbors.
3.3.1 Finding Nearest Neighbors
Let GD be the graph described by matrix D. We need to find the k nearest neighbors for each user, but first we need determine the value of k. To do so, we used a measure known as conductance, which was designed for characterizing network quality [34, 18].
For this work, we define the conductance for a set of nodes A as ψ(A) = NA/min(V ol(A), V ol(V \ A)), where NA denotes the size of boundary, NA = |(g, h) : g ∈ A, h ∉ A|, and V ol (A) = Σg ∈ A d(g), where d(g) is the degree of node g. Figure 3 depicts an example of a small cellular network. If we set the size of the cluster to 4 vertices, there are two clusters: α and β with conductance ψ(α) = 2/14, ψ(β) = 1/11, respectively. Notice, ψ(α) > ψ(β), which implies that the set of vertices in β exhibits stronger community structure than the vertices in α.
Figure 3.
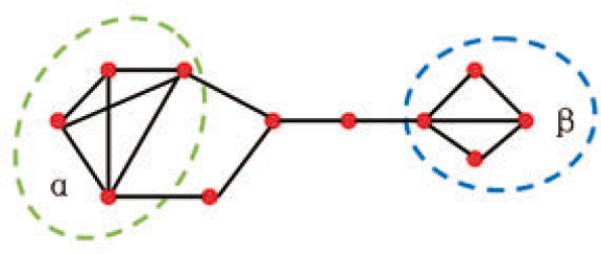
Example network with clusters α and β.
To set k we use the network community profile (NCP), which is a measure of community quality. Building on the work in [22, 21], we define a NCP as a function of the community size. Specifically, for each value k, we compute ϕ(k) = min|A|=k (A). That is, for every possible community size k, NCP measures the score of the most community-like set of nodes of that size. When ϕ(k) reaches the minimum value, the correspond value of k will be assigned as the size of the communities.
3.3.2 Measuring Deviation from Nearest Neighbors
The radius of a user D is defined as the distance to his kth nearest neighbor. Every user can be assigned a radius value D by recording the distance to his kthnearest neighbor. Users can be characterized as a radius vector D = [d1, d2, . . . , dn], and neighbors set knni. The smaller the radius, the higher the density of the user's network.
However, detecting anomalous users through radius is not su cient. As shown in Figure 4, user q2 and the users in cluster F are anomalous and can be detected via their radius. However, based on the radius of nodes, we cannot detect q1 as an anomaly. Compared with nodes in area F , q1 has a smaller radius, but it is anomalous. So we use deviation of the radius to calculate deviation of a node from its k nearest neighbors to detect q1.
Figure 4.
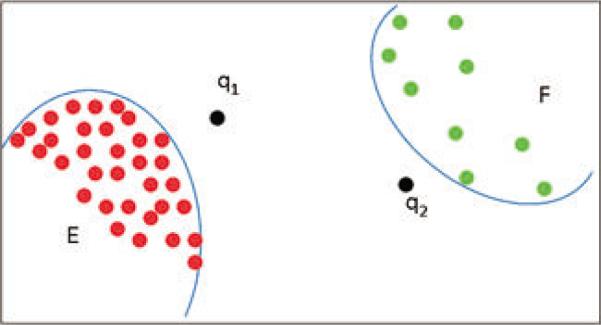
Illustration of di erent types of nodes in the neighborhood networks.
For a given user ui, we calculate the deviation of the radius of the k nearest neighbors of the given user, including the user himself as follows:
| (4) |
where
| (5) |
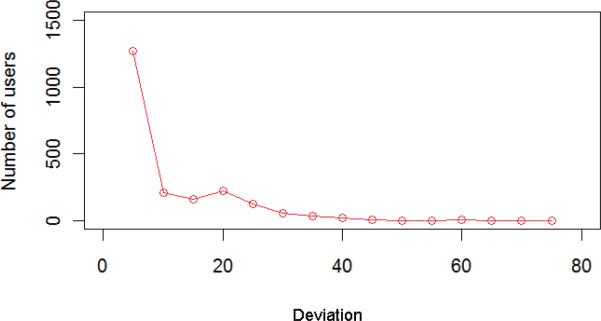
Based on the measurement of radius deviation Dev, deviations of nodes in area E are nearly zero, and the deviation of node q1 is larger. Normal users are likely to have smaller Dev, whereas anomalous users are likely to have higher Dev. Figure 5 is an example of deviation distribution on a real EHR data set (See Section 4). The figure shows that in a real system, most users have smaller deviations, such there are not many users with larger deviations.
Figure 5.
Distribution of user deviations on a real EHR data set
The deviation for every user can be assigned as Dev = [Dev(u1), Dev(u2), . . . , Dev(un)].
4. EXPERIMENTS
4.1 Anomaly Detection Models
As alluded to, there are alternative models to CADS that have been proposed in the literature. As such, we evaluate four models for anomaly detection.
High volume users: This model serves as a base line and uses a very simple rule to predict which user is anomalous. Fundamentally, this model ranks users based on the number of subjects accessed. The greater the number of subjects accessed, the higher the rank.
k-nearest neighbors (KNN): [23] proposed an intrusion detection model based on the k-nearest neighbor principle. The approach first ranks a user's neighbors among the vectors of training users. It then uses the class labels of the k most similar neighbors to predict the class of the new user. The classes of these neighbors are weighted using the similarities of each neighbor to new user, which is measured by the cosine similarity of the vectors. For this work, we use the user vector in the B matrix in CADS. Each user is characterized by access records of m subjects. This model is then tested with a mix of real and simulated users as discussed below.
PCA: [36] proposed an anomaly detection scheme based on a principal component classifier. The distance of a user is computed as the distance to known normal users in the system according to the weighted principal components. Again, we use B as the basis for training the system with the normal users and then evaluate the system with a mix of real and simulated users as discussed below.
CADS: In essence, CADS is a hybrid of KNN and PCA. It utilizes SVD to infer communities from relational networks of users and KNN to establish sets of nearest neighbor. This model attempts to detect anomalous users by computing a users’ deviation from their k nearest neighbors’ networks.
4.2 Data Sets
We evaluate the anomaly detection models with two datasets. The first is a private dataset of real EHR access logs from a large academic medical center. The second is a public dataset and, though not representative of access logs, provides a dataset of social relationships for replication.
4.2.1 EHR Access Log Dataset
StarPanel is a longitudinal electronic patient chart developed and maintained by Department of Biomedical Informatics faculty working with sta in the Informatics Center of the Vanderbilt University Medical Center [12]. StarPanel is ideal for this study because it aggregates all patient data as fed into the system from any clinical domain and is the primary point of clinical information management. The user interfaces are Internet-accessible on the medical center's intranet and remotely accessible via the Internet. The system has been in operation for over a decade and is well-integrated into the daily patient care workflows and healthcare operations. In all, the EHR stores over 300,000,000 observations on over 1.5 million patient records.
We analyze the access logs of 6 months from the year 2006. The access network in this dataset is very sparse. For example, in an arbitrary week, there are 35, 531 patients, 2, 377 users and 66, 441 access transactions. In other words, only 66, 441/(34, 431×2, 377), or 0.07% of the possible user-patient edges were observed.2
For this dataset, we evaluate the anomaly detection models on a weekly basis, and report on the average performance. We refer to this as the EHR dataset.
4.2.2 Public Relational Network Dataset
We recognize that using a private dataset makes it di cult to replicate and validate our results. Thus, we supplement our study with an analysis on a publicly available dataset.
This dataset was initially studied in [25] and reports the editorial board memberships for a set of journals in a similar discipline (biomedical informatics) over the years 2000 to 2005.3 It contains 1, 245 editors and 49 journals. In our experiments, we treated the editors as users, and the journals as subjects. For this dataset, we evaluate the anomaly detection models on the complete dataset and report on the performance. We refer to this as the Editor dataset.
4.3 Simulation of Users
One of the challenges of working with real data from an operational setting is that it is unknown if there are anomalies in the dataset. Thus, to test the performance of the anomaly detection models, we designed an evaluation process that mixes simulated users with the real users of the aforementioned datasets. We worked under the assumption that an anomalous user would not exhibit steady behavior. We believe that such behavior is indicative of the record access behavior committed by users that have accessed patient records for malicious purposes, such as identity theft.
The evaluation is divided into three types of settings:
Sensitivity to Number of Records Accessed
The first setting investigates how the number of subjects accessed by a simulated user influences the extent to which the user can be predicted as anomalous. In this case, we mix a lone simulated user into the set of real users. The simulated user accesses a set of randomly selected subjects, the size of which ranges from 1 to 1, 000 in the EHR dataset and from 1 to 20 in the Editor dataset.
Sensitivity to Number of Anomalous Users
The second setting investigates how the number of simulated users influences the rate of detection. In this case, we vary the number of simulated users from 0.5% to 5% of the total number of users, which we refer to as the mix rate(e.g. 5% implies 5 out of 100 users are simulated). Each of the simulated users access an equivalent-sized set of random subjects’ records.
Sensitivity to Diversity
The third setting investigates a more diverse environment. In this case, we set the mix rate of simulated and the total number of users as 0.5% and 5%. And, in addition, we allow the number of patients accessed by the simulated users to range from 1 to 1, 000 in the EHR dataset and from 1 to 20 in Editor dataset.
4.4 Tuning the Neighborhood Parameter
Both the KNN and CADS model incorporate a parameter that limits the number of users to compare to for an arbitrary user. We tuned this parameter for each of the datasets empirically.
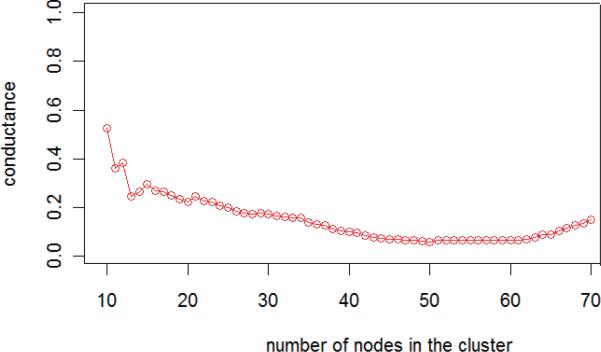
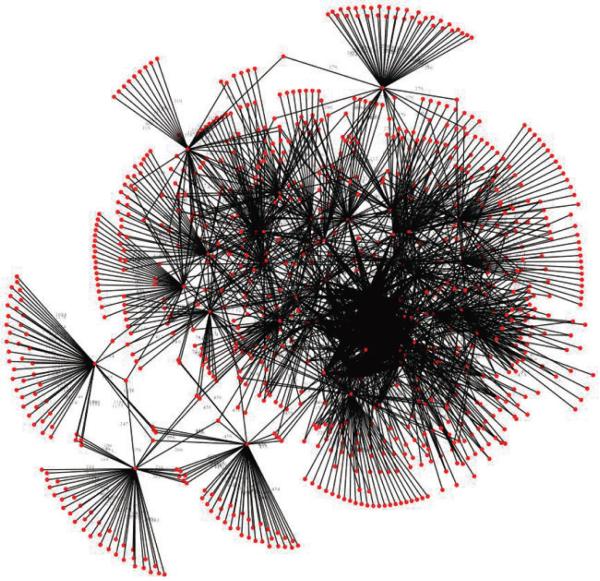
In the EHR dataset, we calculate the network community profile (NCP) for the user networks. The result is depicted in Figure 6, where we observed that NCP is minimized at 50 neighbors. For illustrative purposes, we show the network in Figure 7 that results from a selection of 50 users from an arbitrary week of the study to their 50 nearest neighbors.
Figure 6.
The NCP plot of network in the EHR dataset.
Figure 7.
The 50-nearest neighbor network for fifty users in an arbitrary week of the EHR dataset.
In contrast, we find the NCP in the Editor dataset was minimized at 18 neighbors. This is smaller than the value for the Editor dataset and highlights its sensitivity to the network being studied. For instance, for the NCP dataset, we suspect this decrease in the value is because the number of users and size of the user network is smaller in the Editor dataset.
4.5 Results
4.5.1 Random Number of Accessed Patients
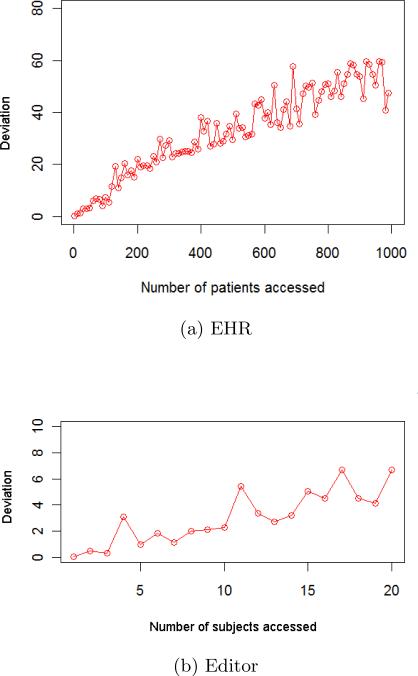
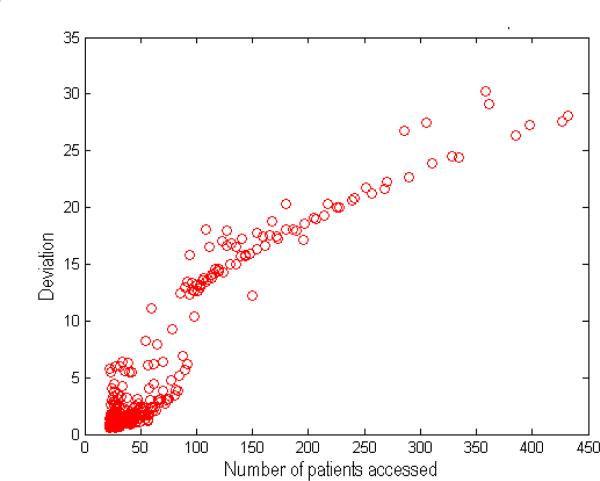
The first set of experiments focus on the sensitivity of CADS. To begin, we mixed a single simulated user with the real users. We varied the number of subjects accessed by the simulated user to investigate how volume impacts the CADS deviation score and the performance of the anomaly detection models in general. For illustration, the CADS deviation scores for the simulated users in the EHR and Editor datasets are summarized in Figure 8.
Figure 8.
CADS deviation score of the simulated user as a function of number of subjects accessed.
Notice that as the number of the subjects accessed by the users increases, so too does the deviation score. Note, the magnitude of the deviation score is significantly larger in the EHR dataset, which is because the number of subjects accessed by the simulated users is much greater (i.e., from 1 to 1, 000 vs. 1 to 20). The observation that the deviation score tends to increases with the number of subjects accessed is what suggests why an organization might be tempted to utilize an anomaly detection model based on high volume accesses.
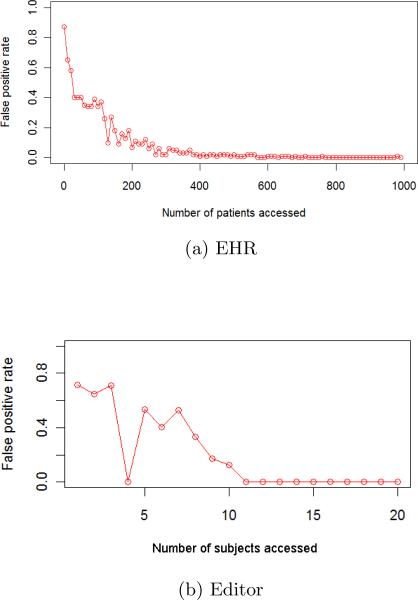
Next, we need to determine when the CADS deviation score is su ciently large to detect the simulated user in the context of the real users. In Figure 9, we show how the number of subjects accessed by a simulated user influences the performance of CADS. We find that when the number of accessed subjects for the simulated user is small, it is di cult for CADS to discover the user via the largest deviation score. This is not unexpected because CADS is an evidence-based framework. It needs to accumulate a certain amount of evidence before it can determine that the actions of the user are not the result of noise in the system. As the number of subjects accessed increases, however, so too does the performance of CADS. And, by the time number of accessed subjects is greater than 100 in the EHR dataset (Figure 9(a)) and 10 in the Editor dataset (Figure 9(b)), the simulated user can be detected with very high precision.
Figure 9.
Rate of detection of the simulated user via the largest CADS deviation score as a function of the number of patients accessed.
4.5.2 Random Number of Simulated Users
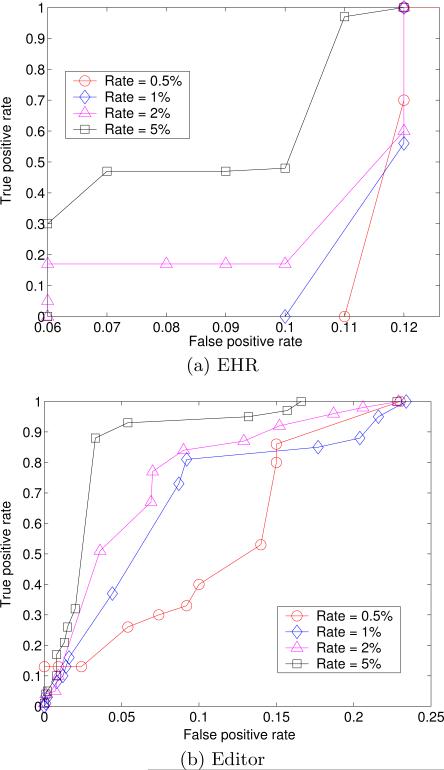
In order to verify how the number of simulated users influences the performance of CADS, we conducted several experiments when the number of simulated users was randomly generated. In these experiments, the number of subjects accessed by the simulated users was fixed at 100 in the EHR dataset and 5 in the Editor dataset. The mix rates of simulated users and the total number of users were set from 0.5% to 5%. The average true and false positive rates for CADS are depicted in Figure 10.
Figure 10.
CADS performance with various mix rates of simulated and real users.
The figures show that when the number of simulated users increases, CADS achieves a higher area under the ROC curve (AUC). In the previous experiment, the number of simulated users is only one, so the false positive rates in Figure 9 is a little high.
4.5.3 Random Number of Simulated User and Accessed Patients
In this experiment, we simulated a more realistic environment to compare all four of the anomaly detection models. Specifically, we allowed both the number of simulated users and the number of patients accessed by the simulated users to vary. For each week, we constructed four test datasets. The mix rate between simulated users and the total number of users in each dataset was set as 0.5% and 5%. Additionally, the number of accessed subjects for each simulated user was selected at random.
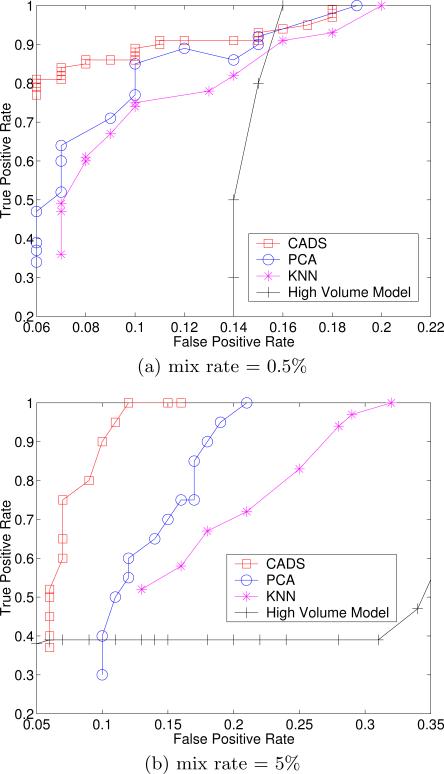
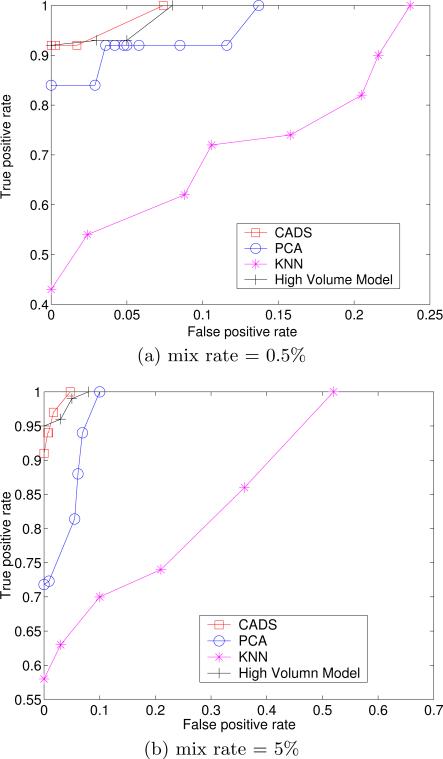
The results are depicted in Figures 11 and 12. It can be seen that CADS exhibits the best performance of simulated user detection (according to AUC). At the lowest mix rate, CADS was almost two times more accurate at the most specific tuning level. Moreover, CADS is only marginally affected by the mix rate, whereas the other approaches are much more sensitive.
Figure 11.
Comparison of di erent anomaly detection methods on the EHR dataset. The number of accessed subjects for simulated user is random.
Figure 12.
Comparison of di erent anomaly detection methods on the Editor dataset. The number of accessed subjects for simulated user is random.
The results for the Editor dataset set are nearly the same as the EHR dataset, except for the high volume model. In the Editor dataset, the high volume model achieves very high performance. We believe that the reason why high volume models achieve better in the Editor dataset is because the majority of real editors are related to only 1 or 2 journals each, whereas the majority of simulated editors are related to more than 2. Nonetheless, we find that the performance of CADS is competitive with the high volume model, while the PCA and KNN models are outperformed.
Figure 13 depicts the CADS deviation score for simulated users as a function of the number of subjects accessed in the EHR dataset. The trend illustrates that the deviation score increases with the number of patients accessed. However, by returning to Figures 11, it can be seen that the performance of the high volume model in this setting is poor. This is because the CADS deviation score is small for many of the real users that accessed a large number of patients. As a result, if an administrator was to use a high volume model to detect anomalous insiders, it could lead to a very high false positive rate.
Figure 13.
Deviation score of simulated users as a function of number of subjects accessed for the EHR dataset.
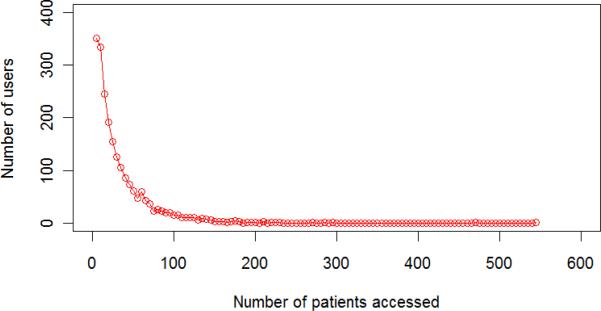
Figure 14 shows the distribution of subjects accessed per real user in an arbitrary week of the EHR dataset. Notice that the majority of users accessed less than 100 patients. However, there are also many simulated users that accessed less than 100 subjects’ records (Figure 13). CADS can distinguish these simulated users from the real users with high performance. This is because, as we hypothesized, real users tend to form communities with a high probability, whereas the simulated users are more dispersed.
Figure 14.
Number of patients accessed by real EHR users in an arbitrary week.
5. DISCUSSION
To detect anomalous insiders in a CIS, we proposed CADS, a community-based anomaly detection model that utilizes a relational analytic framework. CADS inferred communities from the relationships observed between users and subject's records in the CIS access logs. To predict which users are anomalous, CADS calculates deviation of users based on their nearest neighbor's networks. To investigate the flexibility and performances of CADS, we simulated anomalous users and performed evaluations with respect to the number of simulated users in the sysem and the number of records accessed by the user. Furthermore, we compared CADS with other three models: PCA, KNN and high volume users. The experimental findings suggest that when the number of users and complexity of the social networks in the CIS are low, very simple models of anomaly detection, such as high volume user detection, may be su cient. But, as the complexity of the system grows tools that model complex behavior, tools such as CADS, are certainly necessary.
CADS blends the basis of both PCA and KNN and our empirical findings suggest that the former is significantly better at detecting anomalies than either of the latter. In part, this is because PCA and KNN capture di erent aspects of the problem. PCA is adept at reducing noise and revealing hidden (or latent) structure in a system, whereas KNN is for detecting overlapping neighborhoods with complex structure.
There are several limitations of this study that wish to point out, which we believe can serve as a guidebook for future research on this topic. First, our results are a lower bound on the performance of the anomaly detection methods evaluated in this paper. This is because in complex collaborative environments, such as EHR systems, we need to evaluate the false positives with real humans, such as the privacy and administrative o cials of the medical center. It is possible that the false positives we reported were, in fact, malicious users. This is a process that we have initiated with o cials and believe it will help tune the anomaly detection approach further via expert feedback.
Second, this work did not incorporate additional semantics that are often associated with users and subjects that could be useful in constructing more meaningful patterns. For instance, the anomaly detection framework could use the “role” or “departmental a liation” of the EHR users to construct more specific models about the users. Similarly, we could use the “diagnoses” or “treatments performed” for the patients to determine if clinically-related groups of patients are accessed in similar ways. We intend to analyze the impact of such information in the future, but point out that the goal of the current work was to determine how the basic information in the access logs could assist in anomaly detection. We are encouraged by the results of our initial work and expect that such semantics will only improve the system.
Third, in this paper, we set the size of the communities to the users’ k nearest neighbors, but we assumed that k was equivalent for each user in the system. However, it is known that the size of communities and local networks can be variable [22]. As such, in future work, we intend on parameterizing such models based on local, rather than global, observations.
Finally, the CADS model aims to detect anomalous insiders, but this is only one type of anomalous insiders. As a result, CADS may be susceptible to mimicry if an adversary has the ability to game the system by imitating group behavior or the behavior of another user. Moreover, there are many di erent types of anomalies in collaborative systems, each of which depends on the perspective and goals of the administrators. For instance, models could be developed to search for anomalies at the level of individual accesses or sequences of events. We aim to design models to detect various types of anomalies in the future.
6. CONCLUSIONS
In this paper, we proposed CADS, an unsupervised model based on social network analysis to detect anomalous insiders in collaborative environments. Our model assumed that “normal” users are likely to form clusters, while anomalous users are not. The model consists of two parts: pattern extraction and anomaly detection. In order to evaluate the performance of our model, we conducted a series of experiments and compared CADS with other established anomaly detection models In the experiments, we mixed simulated users with into systems of real users and evaluated the anomaly detection models on two types of access logs: 1) a real electronic health record system (EHR) and 2) a publicly-available set of editorial board memberships for various journals. Our results illustrate that CADS exhibited the highest performance at detecting simulated insider threats. Our empirical studies indicate that the CADS model performs best in complex collaborative environments, especially in EHR systems, in which users are team-oriented and dynamic. Since CADS is an unsupervised learning system, we believe it may be implemented in real time environments without training. There are limitations of the system; however, and in particular, we intend to validate and improve our system with adjudication through real human experts.
ACKNOWLEDGMENTS
The authors thank Dario Giuse for supplying the EHR access logs, and Steve Nyemba for preprocessing the logs, studied in this paper. The authors would also like to thank Erik Boczko, Josh Denny, Carl Gunter, David Liebovitz, and the members of the Vanderbilt Health Information Privacy Laboratory for thoughtful discussion on the topics addressed in this paper. This research was sponsored by grants CCF-0424422 and CNS-0964063 from the National Science Foundation and 1R01LM010207 from the National Library of Medicine, National Institutes of Health.
Footnotes
Permission to make digital or hard copies of all or part of this work for personal or classroom use is granted without fee provided that copies are not made or distributed for profit or commercial advantage and that copies bear this notice and the full citation on the first page. To copy otherwise, to republish, to post on servers or to redistribute to lists, requires prior specific permission and/or a fee.
General Terms
Algorithms, Experimentation, Security
We define the covariance Cov = (n − 1)−1CCT . The diagonal terms of Cov are the variance of particular measurement types. The off-diagonal terms of Cov are the covariance between measurement types. Cov captures the relationships between all possible pairs of measurements. The correlation values reflect the noise and redundancy in our measurements. In the diagonal terms, large values correspond to interesting communities; in the o diagonal terms, large values correspond to high redundancy. The principal components of C are the eigenvectors of CCT , which are the rows of P.
The sparseness enabled us to utilize an adjacency list to construct the user-patient and user-user matrices to reduce memory consumption and time calculation.
This dataset can be downloaded from http://hiplab.mc.vanderbilt.edu/bmiEdBoards.
Contributor Information
You Chen, Department of Biomedical Informatics School of Medicine Vanderbilt University Nashville, TN, USA 37203 you.chen@vanderbilt.edu.
Bradley Malin, Department of Biomedical Informatics School of Medicine Vanderbilt University Nashville, TN, USA 37203 b.malin@vanderbilt.edu.
REFERENCES
- 1.Adamic L, Adar E. Friends and neighbors on the web. Social Networks. 2003;25:211–230. [Google Scholar]
- 2.Ahn G, Shin D, Zhang L. Role-based privilege management using attribute certificates and delegation. Proceedings of the International Conference on Trust and Privacy in Digital Business. 2004:100–109. [Google Scholar]
- 3.Ahn G, Zhang L, Shin D, Chu B. Authorization management for role-based collaboration. Proceedings of IEEE International Conference on System, Man and Cybernetic. 2003:4128–4214. [Google Scholar]
- 4.Barbara D, Wu N, Jajodia S. Detecting novel network intrusions using Bayes estimators. Proceedings of the 1st SIAM International Conference on Data Mining. 2001 [Google Scholar]
- 5.Bellotti V, Bly S. Walking away from the desktop computer: distributed collaboration and mobility in a product design team. Proceedings of the 1996 ACM Conference on Computer Supported Cooperative Work. :209–218. 19996. [Google Scholar]
- 6.Benaben F, Touzi J, Rajsiri V, Pingaud H. Collaborative information system design. Proceedings of International Conference of the Association Information and Management. 2006:281–296. [Google Scholar]
- 7.Bullock A, Benford S. An access control framework for multi-user collaborative environments. Proceedings of the ACM SIGGROUP Conference on Supporting Group Work. 1999:140–149. [Google Scholar]
- 8.Chapanond A, Krishnamoorthy M, Yener B. Graph theoretic and spectral analysis of Enron email data. Computational and Mathematical Organization Theory. 2005;11:265–281. [Google Scholar]
- 9.Charette R. Kaiser Permanente marks completion of its electronic health records implementation. IEEE Spectrum. 2010 Mar 8; [Google Scholar]
- 10.Eldenburg L, Soderstrom N, Willis V, Wu A. Behavioral changes following the collaborative development of an accounting information system. Accounting, Organizations and Society. 2010;35(2):222–237. [Google Scholar]
- 11.Georgiadis C, Mavridis I, Pangalos G, Thomas R. Flexible team-based access control using contexts. Proceedings of ACM Symposium on Access Control Model and Technology. 2001:21–27. [Google Scholar]
- 12.Giuse D. Supporting communication in an integrated patient record system. Proceedings of the 2003 American Medical Informatics Association Annual Symposium. 2003:1065. [PMC free article] [PubMed] [Google Scholar]
- 13.Gruber T. Collective knowledge systems: where the social web meets the semantic web. Journal of Web Semantics. 2007;6(1):4–13. [Google Scholar]
- 14.He Z, Xu X, Deng S. Discovering cluster-based local outliers. Pattern Recognition Letters. 2003;24(9-10):1641–1650. [Google Scholar]
- 15.Huang C, Li T, Wang H, Chang C. A collaborative support tool for creativity learning: Idea storming cube. Proceedings of the 2007 IEEE International Conference on Advanced Learning Technologies. 2007:31–35. [Google Scholar]
- 16.Hartigan JA, Wong MA. A k-means clustering algorithm. Appl. Stat. 1979;28:104–108. [Google Scholar]
- 17.Javanmardi S, Lopes C. Modeling trust in collaborative information systems. Proceedings of the 2007 International Conference on Collaborative Computing: Networking, Applications and Worksharing. 2007:299–302. [Google Scholar]
- 18.Kannan R, Vempala S, Vetta A. On clusterings: Good, bad and spectral. Journal of the ACM. 2004;51(3):497–515. [Google Scholar]
- 19.Kohonen T. Self-organizing maps. Springer Series in Information Sciences. 1997;78(9):1464–1480. [Google Scholar]
- 20.Kuhlmann M, Shohat D, Schimpf G. Role mining-revealing business roles for security administration using data mining technology. Proceedings of the 8th ACM Symposium on Access Control Models and Technologies. 2003:179–186. [Google Scholar]
- 21.Leskovec J, Lang K, Dasgupta A, Mahoney M. Statistical properties of community structure in large social and information networks. Proceedings of the 17th International Conference on World Wide Web. 2008:695–704. [Google Scholar]
- 22.Leskovec J, Lang KJ, Dasgupta A, Mahoney MW. Community Structure in Large Networks: Natural Cluster Sizes and the Absence of Large Well-Defined Clusters. Computing Research Repository. 2008 abs/0810.1355. [Google Scholar]
- 23.Liao Y, Vemuri VR. Use of k-nearest neighbor classifier for intrusion detection. Computer Security. 2002;21(5):439–448. [Google Scholar]
- 24.Liu H. Social network profiles as taste performances. Journal of Computer-Mediated Communication. 2008;13:252–275. [Google Scholar]
- 25.Malin B, Carley K. A longitudinal social network analysis of the editorial boards of medical informatics and bioinformatics journals. Journal of the American Medical Informatics Association. 2007;14(3):340–347. doi: 10.1197/jamia.M2228. [DOI] [PMC free article] [PubMed] [Google Scholar]
- 26.Menachemi N, Brooks R. Reviewing the benefits and costs of electronic health records and associated patient safety technologies. Journal of Medical Systems. 2008;30(3):159–168. doi: 10.1007/s10916-005-7988-x. [DOI] [PubMed] [Google Scholar]
- 27.Molloy I, Chen H, Li T, Wang Q, Li N, Bertino E, Calo S, Lobo J. Mining roles with semantic meanings. Proceedings of the 13th ACM Symposium on Access Control Models and Technologies. 2008:21–30. [Google Scholar]
- 28.Neville J, Adler M, Jensen D. Clustering relational data using attribute and link information. Proceedings of the IJCAI Text Mining and Link Analysis Workshop. 2003 [Google Scholar]
- 29.Park J, Sandhu R, Ahn G. Role-based access control on the web. ACM Transactions on Information and System Security. 2001;4(1):37–71. [Google Scholar]
- 30.Pokrajac D, Lazarevic A, Latecki L. Incremental local outlier detection for data streams. Proceedings of the IEEE Symposium on Computational Intelligence and Data Mining. 2007:504–515. [Google Scholar]
- 31.Popp R. Countering terrorism through information technology. Communications of the ACM. 2004;47(3):36–43. [Google Scholar]
- 32.Sandhu R, Coyne E, Feinstein H, Youman C. Role-based access control models. IEEE Computer. 1996;29(2):38–47. [Google Scholar]
- 33.Sarkar P, Moore A. Dynamic social network analysis using latent space models. ACM SIGKDD Explorations. 2005;7:31–40. [Google Scholar]
- 34.Shi J, Malik J. Normalized cuts and image segmentation. IEEE Transcations of Pattern Analysis and Machine Intelligence. 2002;22(8):888–905. [Google Scholar]
- 35.Shlens J. A Tutorial on Principal Component Analysis. Institute for Nonlinear Science, University of California at San Diego; 2005. [Google Scholar]
- 36.Shyu M, Chen S, Sarinnapakorn K, Chang L. A novel anomaly detection scheme based on principal component classifier. IEEE Foundations and New Directions of Data Mining Workshop. 2003:172–179. [Google Scholar]
- 37.Sikkel K. A group-based authorization model for cooperative systems. Proceedings of ACM Conference on Computer-Supported Cooperative Work. 1997:345–360. [Google Scholar]
- 38.Song Q, Hu W, Xie W. Robust support vector machine with bullet hole image classification. IEEE Transactions on Systems, Man, and Cybernetics. 2002;32(4):440–448. [Google Scholar]
- 39.Tang J, Chen Z, Fu A, Cheung D. Enhancing e ectiveness of outlier detections for low density patterns. Proceedings of the Pacific-Asia Conference on Knowledge Discovery and Data Mining. 2002:535–7548. [Google Scholar]
- 40.Thomas R, Sandhu S. Task-based authorization controls (tbac): A family of models for active and enterprise-oriented autorization management. Proceedings of the IFIP 11th International Conference on Database Security. 1997:166–181. [Google Scholar]
- 41.Vaidya J, Atluri V, Warner J. Roleminer: mining roles using subset enumeration. Proceedings of the 13th ACM Conference on Computer and Communications Security. 2006:144–153. [Google Scholar]
- 42.von Ahn L. Games with a purpose. IEEE Computer. 2006:96–98. [Google Scholar]
- 43.von Kor M, Gruman J, Schaefer J, Curry S, Wagner E. Collaborative management of chronic illness. Annals of Internal Medicine. 1997;127(12):1097–1102. doi: 10.7326/0003-4819-127-12-199712150-00008. [DOI] [PubMed] [Google Scholar]
- 44.Zhang L, Ahn G, Chu B. A rule-based framework for role-based delegation and revocation. ACM Transactions on Information and System Security. 2003;6(3):404–441. [Google Scholar]


