Abstract
[1] To better inform the subsurface scientist on the expected performance of parallel simulators, this work investigates performance of the reactive multiphase flow and multicomponent biogeochemical transport code PFLOTRAN as it is applied to several realistic modeling scenarios run on the Jaguar supercomputer. After a brief introduction to the code's parallel layout and code design, PFLOTRAN's parallel performance (measured through strong and weak scalability analyses) is evaluated in the context of conceptual model layout, software and algorithmic design, and known hardware limitations. PFLOTRAN scales well (with regard to strong scaling) for three realistic problem scenarios: (1) in situ leaching of copper from a mineral ore deposit within a 5-spot flow regime, (2) transient flow and solute transport within a regional doublet, and (3) a real-world problem involving uranium surface complexation within a heterogeneous and extremely dynamic variably saturated flow field. Weak scalability is discussed in detail for the regional doublet problem, and several difficulties with its interpretation are noted.
Keywords: high performance computing, biogeochemical transport, groundwater flow
1. Introduction
[2]Barry [1990] wrote on the application of supercomputing to simulating subsurface solute transport, referring to a computer revolution and proposing that supercomputing lay on this revolutionary path. Barry characterized supercomputers (which were primarily vector-based at the time) and discussed the state of the art in theory of fluid flow and solute transport, solution techniques (numerical methods), data analysis, and visualization. He concluded the paper asserting that “[supercomputers'] rapidly increasing use in future investigations is therefore a plausible expectation.” Though perhaps intending to be prophetic, his assertion proved somewhat overly optimistic: Over two decades later, the use of supercomputing in subsurface simulation is far from ubiquitous.
[3]The question then arises as to why supercomputing or high performance computing (HPC) is not employed more regularly within subsurface simulation, especially for modeling difficult real-world scenarios that call for increasingly mechanistic process models for validation and higher resolution discretizations for better accuracy. Certainly, a large number of researchers have investigated the application of HPC to subsurface simulation. Most of this research has focused on the application of high performance computing to solve hypothetical subsurface problem scenarios [Kolditz et al., 2012; Navarre-Sitchler et al., 2013] or real-world ones [Tompson et al., 1998; Zhang et al., 2003; White et al., 2004,2008; Yamamoto et al., 2009; Hammond and Lichtner, 2010; Hammond et al., 2011; Nowak et al., 2011; Yabusaki et al., 2011; Chen et al., 2012,2013], with little to no analysis of parallel performance. Research on the scalability of parallel subsurface simulators has often focused on hypothetical scenarios or proofs of concept [Gwo et al., 2001; Jones and Woodward, 2001; Hammond et al., 2005; Kollet and Maxwell, 2006; Kollet et al., 2010; Guo et al., 2013]. Hypothetical scenarios are well-suited to weak-scaling analysis and can be very informative, but even well-constructed hypothetical problems may omit unexpected complications that arise in real-world problems, and they lack field data against which a model may be validated. It is therefore desirable to evaluate parallel simulators using real-world scenarios as well, particularly when seeking to inform on the use of simulators for real-world problems such as environmental performance assessments [e.g., US DOE, 2013].
[4]There are several studies in the literature in which researchers have reported on the scalability of their simulators as applied to real-world scenarios. Wu et al. [2002] analyzed the performance of the parallel version of TOUGH2 for three real-world problem scenarios run on two HPC platforms (Cray T3E-900, IBM RS/6000SP). They discussed the problem scenarios and the parallel performance in great detail, enabling the reader to come to his or her own conclusions regarding the performance of TOUGH2 (the authors of this paper strongly recommend that the reader carefully scrutinize Tables 2 and 3 of that work when drawing their own conclusions about the reported superlinear performance of TOUGH2 (i.e. 150%)).
[5]Lu and Wheeler [2009] briefly discussed the parallel performance of IPARS on reservoir simulations executed on Lonestar and IBM's Blue Gene in their research comparing the iterative implicit pressure explicit saturation (IMPES) and fully implicit solution approaches for multiphase flow. Several scenarios modified from real-world reservoirs were simulated on up to 2048 processes. Parallel performance was reported through speedup plots with a breakdown of total CPU time distributed between time spent in solvers, parallel communication, initialization, and other portions of the code presented in pie charts.
[6]The work by Kollet et al. [2010], although a proof of concept, is quite close to real-world, and the level of detail and analysis provided by the authors is very informative with a breakdown of the performance of several components of ParFlow (e.g., nonlinear function evaluation, Krylov solver, multigrid preconditioner, setup time, etc.). Their work studied the application of ParFlow coupled to the common land model (CLM) for modeling regional-scale surface-subsurface hydrologic interaction. They demonstrate the excellent weak-scaling performance of the ParFlow solvers and multigrid preconditioners. The inclusion of a strong-scaling analysis would have been beneficial to the reader (as would the addition of weak-scaling analyses in any studies reporting solely strong scaling) but overall the work by Kollet et al. [2010] is informative to the end user. Other studies of the scalability of subsurface simulators have been published, e.g., Gwo et al. [2001] provides a useful breakdown on HBGC123D parallel performance on a hypothetical problem.
[7]Designing software to effectively use HPC resources does involve consideration of a complex interplay between numerical algorithms, data layout, and data access patterns, which can result in extremely complicated software. Several projects, however, have demonstrated that it is possible to manage this software complexity by encapsulating it using object-oriented approaches designed around the mathematics of the problem to be solved [Reynders et al., 1996; Brown et al., 1997; Balay et al., 1997; Smith et al., 2012]. Some authors have stated that such approaches are not effective: Kolditz et al. [2012] state “the parallelization of OO [object-oriented] codes still lacks efficiency” and “[HPC] efficiency of OO codes is a subject of future research.” The authors of this work speculate that such claims may be due to experiences with software in which too fine a granularity of object design has been employed, resulting in code that an optimizing compiler cannot translate into efficient machine code due to reasons such as too much indirect memory addressing and excessive pointer aliasing. In any case, many object-oriented scientific codes have in fact demonstrated impressive parallel efficiency [Anderson et al., 1999; Akcelik et al., 2003; Adams et al., 2004].
[8]Besides the associated software complexity, other concerns affecting the use of HPC are sparsity of data sets and lack of access to (or shortcomings in the ease of use of) high-end supercomputing resources. We contend that HPC can be an appropriate tool even when data sets are sparse, as coarse or simplified data sets can still be mapped to refined discretizations. Furthermore, with a conceptual model designed for HPC, it is possible for the researcher to better assess data deficiencies to motivate and guide data collection. Without doubt, the use of HPC in subsurface simulations is not trivial as it often invokes a workflow more complicated than running on a typical workstation (e.g., gaining access to machines; balancing of problem size versus process count; understanding queue structure, scheduling policies, and runtime limits; working in temporary scratch disk space). Providing subsurface scientists with a realistic picture of the benefits they can expect from using HPC can assist them in evaluating whether the additional complications are worthwhile.
[9]Clearly, HPC enables the execution of larger and increasingly complex simulations in shorter runtime. This has been effectively demonstrated over the past several years by research funded by the U.S. Department of Energy Biological and Environmental Research (BER) program to model the persistence of uranium plumes at the Hanford 300 Area [Hammond and Lichtner, 2010; Hammond et al., 2011; Lichtner and Hammond, 2012; Chen et al., 2012,2013] and a uranium mine tailings site in Rifle, CO [Yabusaki et al., 2011]. However, what is the expected performance, and how can that knowledge aid the domain scientist in determining the suitability of HPC for their problem and estimating the expected benefit? What are the potential drawbacks? And what guidelines are there to follow? For instance, it can be demonstrated that employing too many processes can actually lead to degradation in performance and waste valuable computing resources. For any given problem size, there exists an optimal number of processes to run the problem on a particular machine. This can be found by determining the minimum number of degrees of freedom per process that run efficiently and creating a speedup curve as demonstrated later in section 4.3. Subsurface scientists must contemplate such questions and evaluate the advantages/disadvantages of utilizing HPC for their research, and these must be informed decisions.
[10]The purpose of this research is to provide a reference point for the performance of an efficient parallel, object-oriented code for subsurface simulation on modern HPC platforms, on both hypothetical and real-world subsurface problems where complexity of the natural system comes into play.
[11]In what follows, PFLOTRAN is introduced with a brief description of its object-oriented design and the parallel numerical methods employed within the code. Parallel performance is explained in the context of conceptual model layout, software (algorithmic) design, and known hardware limitations, using three realistic problem scenarios. The first is geochemically dominated and simulates the in situ leaching of copper from a mineral ore deposit within a 5-spot flow regime. The second stresses the performance of the code on a regional variably saturated groundwater flow and conservative solute transport problem with a doublet well configuration. The final scenario demonstrates parallel performance on both flow and transport by simulating uranium surface complexation under extremely transient, variably saturated groundwater flow conditions within the Integrated Field Research Challenge (IFRC) site at the Hanford 300 Area. PFLOTRAN performance is analyzed for each of these scenarios with the intended goal of providing a benchmark for the expected performance of a parallel subsurface reactive flow and transport simulator when using computing resources that might typically be available to university or industry researchers (e.g., up to 16,384 processes). Although a considerable amount of development effort has been put into enabling PFLOTRAN to utilize petascale leadership-class supercomputing resources (work that continues as platforms evolve), our focus here is on problems run on smaller scale, more readily available computing platforms.
2. PFLOTRAN
[12]PFLOTRAN is a massively parallel, multiphase flow and reactive multicomponent transport simulator. Although written almost entirely from scratch, it originated as a parallel successor to the serial FLOTRAN code [Lichtner, 2001], incorporating parallel solvers and data structures provided by the Portable, Extensible Toolkit for Scientific Computation (PETSc) framework [Balay et al., 2012] and templated after the doctoral research code PARTRAN [Hammond et al., 2005]. Through the DOE SciDAC-2 groundwater program, PFLOTRAN was refactored to accommodate a modular object-oriented design, parallel I/O through HDF5, and additional physicochemical process models. Active development of the code continues to this day. PFLOTRAN is capable of leveraging petascale computing to simulate subsurface problems composed of billions of degrees of freedom (dofs) utilizing hundreds of thousands of processor cores while still being applicable to serial batch systems or 1D reactive transport using the identical executable and source code [Mills et al., 2009; Hammond and Lichtner, 2010; Hammond et al., 2012; McInnes et al., 2013].
2.1. Open-Source Software
[13]In recent years, open-source software development has become increasingly popular. Open-source promotes unlimited free redistribution of source code exposing a software product's design and implementation details to the public. Code developers and application scientists do not have to reinvent the wheel. They can leverage existing software in their own codes and/or contribute back to the original open-source code. The approach enables peer review through a user base and affords developers the opportunity to contribute to a collaboratory effort that leverages a diverse pool of expertise. PFLOTRAN is open-source, developed under a GNU Lesser General Public Licence (LGPL). The LGPL license allows for third parties to build proprietary software around PFLOTRAN, though any modifications to the original code itself must be documented and remain open-source (e.g., a third party may develop a proprietary GUI around PFLOTRAN and sell it to the public).
[14]Release and development versions of PFLOTRAN may be downloaded from https://bitbucket.org/pflotran. For source code management, the PFLOTRAN project uses Mercurial, a distributed version control tool that records code revision through changesets. Anyone may anonymously clone the PFLOTRAN repository and peruse the history of the source code using Mercurial. With a (free) Bitbucket account, scientists may add capability to PFLOTRAN by (1) forking the pflotran-dev repository, (2) modifying the code and documentation, (3) verifying that code accuracy and integrity is maintained by passing tests within a regression suite, and (4) submitting a pull request to the administrators of the account. Software support is provided through online documentation and a public mailing list at pflotran-users@googlegroups.com.
2.2 Object-Oriented Design
[15]PFLOTRAN is written in free format Fortran 2003 and, where not detrimental to performance, maximizes the use of Fortran modules, dynamic memory allocation, derived types, pointers, linked lists, pointers to procedures and classes (Fortran 2003 extendable derived types with member functions and subroutines). The choice of Fortran, as opposed to C/C++, was based primarily on the desire to enlist and preserve domain scientist involvement in code development and maintenance. Although less than perfect, modern Fortran affords much of the coarse-grained object oriented design capability [see Decyk et al., 1997 for examples] necessary to encapsulate data/processes.
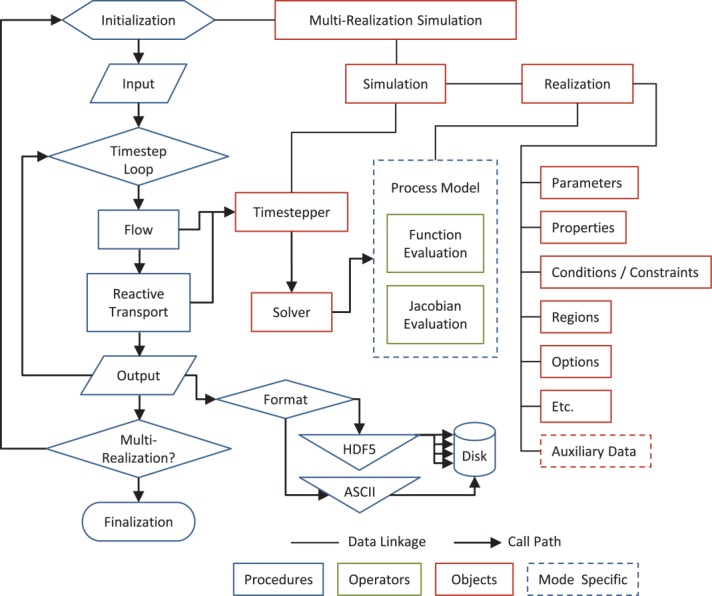
[16]PFLOTRAN is composed of a hierarchy of objects and operations ranging from the highest-level multirealization simulation object to low-level auxiliary data structures that support individual process models on a fine-grained cell by cell basis. Though discussion of the complete list of PFLOTRAN data structures and procedures would be excessive, Figure 1 illustrates a subset of key objects and operations critical in the completion of a simulation. Simulation workflow is shown to the left starting with Initialization, while key objects (Fortran derived types) and processes are referenced to right. Each Simulation proceeds from Initialization to reading of Input followed by the Timestep Loop, where Flow, Transport, and Reaction processes are simulated for each time step and Output is written to disk either through serial text or parallel HDF5 algorithms. After the Timestep Loop has completed, additional realizations are considered (if a Multi-Realization run) and Finalization terminates the simulation.
Figure 1.
Flowchart of key PFLOTRAN objects and operations.
[17]Upon Initialization, PFLOTRAN creates a Simulation object composed of Timesteppers for flow and transport and a Realization. The Timestepper stores parameters associated with time stepping (e.g., minimum/maximum/current time step size, iteration counters) and possesses a Solver object, which is essentially a wrapper that stores pointers to PETSc matrices and linear/nonlinear solvers and preconditioners and defines convergence criteria. Each set of tightly coupled process models requires an individual Timestepper object. Control of the nonlinear solve is handed over to PETSc through the Solver object, where the associated nonlinear solver (i.e., PETSc SNES) calls process model-specific residual and Jacobian evaluation routines and relies on custom domain-specific criteria to determine convergence.
[18]The Realization object supplies all data required to evaluate the residual function and Jacobian, including material properties (e.g., permeability, porosity, mineralogy), functional relationships (e.g., saturation and relative permeability functions and parameters, equations of state), boundary conditions and constraints (e.g., pressures, chemical concentrations), and spatial discretization (e.g., structured and unstructured grids). The Realization also stores process model-specific, fine-grained auxiliary data at each grid cell required for function evaluations and model output (e.g., state, water density, secondary aqueous complex concentrations, reaction rates, etc.). These fine-grained auxiliary data structures greatly simplify the source code by encapsulating cell-centric data within a single object, alleviating the need to continually modify lengthy argument lists within procedure declarations as process models evolve.
[19]Note that only the Process Model routines and the Auxiliary Data are mode specific, in that the routines and objects must be tailored to the processes considered in the simulation, whether they be multiphase CO2-H2O, thermo-hydro-chemical, single-phase variably saturated groundwater flow or reactive biogeochemical transport. The other objects are for the most part independent of the operational mode, and therefore much easier to maintain and reuse. The Auxiliary Data objects which exist for each grid cell and boundary/initial conditions and constraints can be very complex storing a large amount of data.
2.3. Approach to Parallelization
[20]PFLOTRAN employs a distributed-memory parallel programming model using the Message Passing Interface (MPI) and the PETSc framework [Balay et al., 2012] to solve subsurface scientific problems on parallel computers. Parallelism is derived from a domain decomposition approach, in which the spatial simulation domain is decomposed into nonoverlapping, contiguous subdomains, each of which is assigned to one parallel process. Within each subdomain, additional hybrid parallelization approaches (e.g., shared memory pthreads, OpenMP, GPU-based CUDA, or OpenCL) can be employed within PETSc kernels [Minden et al., 2010; Abhyankar et al., 2012], but PFLOTRAN relies primarily on domain decomposition parallelism. When information residing on another process is required to complete a calculation (e.g., computing a flux term across a subdomain boundary), data are passed via MPI messages.
[21]There are two archetypal communication patterns: ghost point updates (or “halo exhanges”) along boundaries between nearest neighbors, and global reduction operations required to compute vector dot products and norms. In PFLOTRAN, ghost point updates are required when calculating flux terms in nonlinear residual functions and Jacobians and when forming matrix-vector products (to gather off-process vector entries) inside iterative linear solvers. The bulk of global reductions performed are for dot product computations in Krylov method linear solvers; they are also used for convergence checks. Although ghost point updates involve much larger messages, global reductions are usually the limiting factor for parallel scalability [Mills et al., 2010] when using many MPI processes, as the cost grows relatively quickly with the number of processes involved in the operation due to internode communication latency as well as load imbalance introduced by operating system “noise” [Petrini et al., 2003; Oral et al., 2010].
2.3.1 PETSc
[22]The PETSc framework supplies a suite of scalable parallel data structures and routines for solving partial differential equation (PDE) based scientific applications. PETSc is mature and well established among the computational and domain science communities. It is open-source and interfaces with many other computational frameworks and libraries enabling the scientist to reach beyond the limits of PETSc algorithms and solvers if so desired.
[23]PFLOTRAN parallelization is founded upon PETSc data structures. PFLOTRAN's unstructured grid implementation relies upon PETSc's interface to graph partitioning software such as ParMETIS [Karypis and Schloegel, 2011] and PETSc data structures such as Index Sets, VecScatters, LocalToGlobalMappings to create parallel vectors and matrices and appropriate scatter/gather mappings between them, while for structured grids the PETSc Distributed Array automatically decomposes the domain and encapsulates such functionality for the code developer. PFLOTRAN process model routines build and store nonlinear systems of equations in these parallel vectors and matrices and pass them to the PETSc solver to generate a solution.
[24]By default, PFLOTRAN employs an inexact Newton's method without line search or other globalization techniques—though the option exists to use any of several such techniques—to solve the nonlinear system of equations through the PETSc Scalable Nonlinear Equations Solver (SNES) component. The linearized system of equations within Newton's method is solved using the stabilized biconjugate gradient method (BCGS) and block Jacobi preconditioning. The modeler may also choose alternative linear (Krylov) solvers such as conjugate gradient (CG) for symmetric systems or generalized minimum residual (GMRES).
[25]A wide variety of parallel preconditioners are supported (e.g., block Jacobi, additive Schwarz, hypre multigrid, etc.), but it is the experience of PFLOTRAN developers that the default block Jacobi preconditioning with point-block ILU[0] factorization in each block delivers the best strong-scaling performance for most PFLOTRAN simulations since the underlying matrices are usually diagonally dominant due to the transient nature of the subsurface problem (i.e., hyperbolic/parabolic governing equations) and the local coupling of chemical reaction. Multilevel preconditioners such as PETSc's new GAMG geometric/algebraic multigrid or hypre's algebraic BoomerAMG and geometric PFMG multigrid solvers [Falgout and Yang, 2002] work well for steady-state problems (elliptic equations). For small problems run in serial (e.g., 1D reactive transport), the user may choose PETSc's direct solver by selecting (complete) LU factorization as the preconditioner; for somewhat larger problems a parallel direct solver such as MUMPS or SuperLU can be employed, although iterative methods are generally preferable in parallel.
[26]With regard to solver convergence, the experienced modeler must have control over the types of tests employed (e.g., L1-, L2-, or  -norm on residual or update vectors with relative versus absolute criteria) and the tolerances applied. PFLOTRAN leverages PETSc's built-in and custom convergence contexts to provide the user with a range of convergence criteria from which to choose. The code also supports manipulation of the update and solution vectors immediately before and after the solution update to improve convergence. For instance, the user can choose to truncate or dampen the update to minimize oscillatory behavior.
[27]PETSc provides significant flexibility to the user in terms of parallel data layout, choice of solvers and preconditioners, etc., and most of these options can be specified at runtime. PETSc also includes a detailed but lightweight scheme to enable application performance profiling [Balay et al., 2012, chap. 12] to guide these choices. Performance data for PETSc routines as well as application developer-defined PFLOTRAN events are automatically logged when PFLOTRAN is run with certain runtime options.
2.3.2. Parallel I/O
[28]PFLOTRAN supports both ASCII text or binary formats for data input and output (I/O). The main PFLOTRAN input file is written in ASCII text with links to secondary ASCII and binary HDF5 [The HDF Group, 2012] files. Data sets spanning multiple processes (e.g., permeability fields) are stored in binary HDF5 and read in parallel. PFLOTRAN output formats vary. For small to medium sized simulations (e.g., problems composed of millions of degrees of freedom run on less than ∼10,000 [10 K] processes), plot files may be written in Tecplot ASCII format by means of a round-robin gather operation through the root process.
[29]For all simulations, binary HDF5 files formatted for VisIt [2005] may be written collectively from all processes or through a two-stage I/O operation where processes are divided into groups and one process from each group aggregates data from all processes within the group and writes to the HDF5 file [Sripathi, 2010]. This latter two-stage I/O is necessary to minimize congestion when writing data from over ∼10 K processes, and the user may specify the size of the processor groups to optimize performance. Key to PFLOTRAN's parallel I/O performance is the use of the HDF5 Hyperslab which allows processes to write their respective chunks or slices of data simultaneously to a single file.
[30]Checkpoint files are written and read using PETSc routines that employ MPI-IO calls to read/write files in PETSc's internal binary format. These files store all information necessary to restart a simulation without modifying simulation results and are machine and process-count independent. The purpose of checkpointing is to enable the user to run simulations longer than supercomputer queue runtime limits allow and to provide fault tolerance. It also enables restarting a simulation from a steady-state initial condition and accelerates debugging when one must repeatedly run a large problem scenario to a point late in the simulation. Because the checkpoint files are independent of machine configuration and process count, it is possible to restart calculations on whatever resources may be readily available, which can decrease queue wait times for heavily subscribed compute resources.
2.3.3. Multirealization Capability
[31]PFLOTRAN provides the ability to run multiple simulations simultaneously, each representing a unique set or realization of parameters. To run in multirealization mode, the user loads data sets for each realization into HDF5 files with an integer ID signifying the realization number appended to each data set name. The user then launches the simulation with a command similar to the following
[32]mpirun -np 64000 pflotran
[33] -stochastic
[34] -num_realizations 1000
[35] -num_groups 500
[36]Here 64,000 processes are employed to run a total of 1000 realizations, 500 of which run simultaneously, each simulation being executed by a processor group composed of 128 processes ( ). The keyword stochastic instructs PFLOTRAN to run in multirealization simulation mode. Upon launch, PFLOTRAN divides the realization IDs among the processor groups, and each individual processor group runs its assigned realizations in sequential order to completion. The number of processor groups must divide evenly into the number of processes (np), but not the number of realizations as long as num_realizations
  num_groups. The utility of PFLOTRAN's multirealization capability is demonstrated in Chen et al. [2012] and Chen et al. [2013], where several tracer injection experiments at the Hanford 300 Area IFRC site were modeled within separate data assimilation frameworks to invert for heterogeneous permeability at the site.
3. Parallel Performance
[37]The efficiency or scalability of a parallel algorithm measures how effectively the code divides and solves a particular problem as the number of processes is increased relative to some base performance measure. Computational scientists typically employ strong and weak scalability studies to evaluate performance of a parallel code. To assess strong scalability, problem size remains fixed while the number of processes changes. With weak scalability (sometimes referred to as scaled speedup), problem size changes linearly with the number of processes. In an ideal world, the wall-clock execution time on a single process would be an excellent metric for base performance. However, for many performance analyses, especially those requiring thousands of processes, the test problem may not fit on one process due to memory constraints or the single-process runtime may be far too long for practical purposes. Relative performance must be considered in those cases where base performance is determined on more than a single process. It is assumed that all performance measures in this work are relative.
[38]With strong scalability, parallel performance can be measured through relative speedup, the increase in speed with which a code reaches a solution as the number of processes increases measured through a reduction in execution time
| (1) |
where  is the execution time on a base process configuration with
  processes and Tp is the runtime on an alternative configuration with p processes. Ideal speedup is equal to the number of processes employed in the alternative configuration divided by the number in the base case
| (2) |
[39]Another measure is relative strong scaling efficiency
| (3) |
which is essentially the measured speedup divided by the ideal speedup with ideal efficiency
| (4) |
[40]For weak scalability studies, performance is measured through relative weak scaling efficiency, which is the ratio of base configuration execution time ( ) to that of an alternative configuration (
 ),
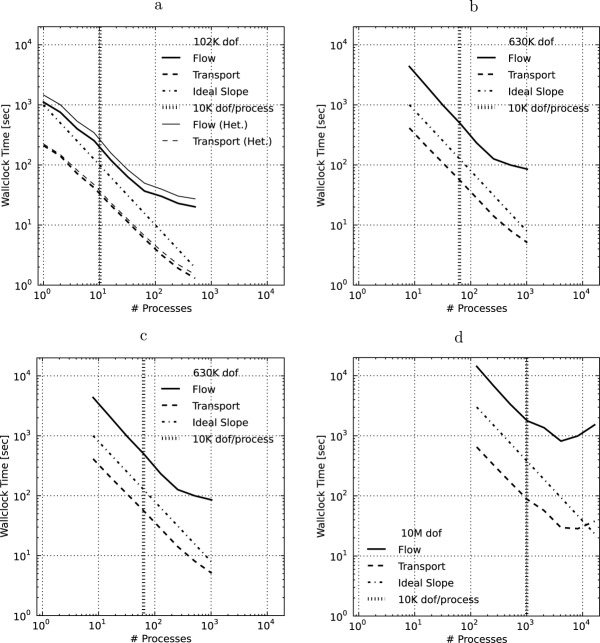
),
| (5) |
where the problem size n and number of processes p are scaled by the same factor α (i.e.,  and
and  ). With weak scaling, again
| (6) |
[41]For any parallel code, but especially one employing domain decomposition parallelization, load balance plays an important role in preserving scalability as an uneven distribution of work across processes can significantly degrade performance [Kumar et al., 1994]. In this work, load imbalance due to uneven domain decomposition is measured as
| (7) |
where  and
and  represent the maximum and minimum number of degrees of freedom (number of grid cells times number of unknowns per grid cell) per process among all processes, respectively. When evenly distributed, the load imbalance approaches zero. Load imbalance will factor in later during the analysis of the IFRC problem scenario in section 4.3. It should be noted, however, that this definition assumes equal algorithmic work load per process which may not be the case (e.g., operator-split reactive transport where in certain portions of the domain minerals are reacting faster, requiring more nonlinear iterations and possibly smaller reaction time steps).
4. Results: PFLOTRAN Parallel Performance
[42]In this section, PFLOTRAN performance is analyzed when run on the Jaguar (Cray XK6) supercomputer at Oak Ridge National Laboratory for several problems representative of practical application in the field. The first is an in situ copper leaching scenario with tight coupling of geochemistry and transport. The second is a regional doublet scenario with a downgradient undulating river stage that measures performance on transient variably saturated flow and solute transport. The final IFRC scenario couples variably saturated flow with geochemical transport in an extremely dynamic flow regime within the Hanford 300 Area Integrated Field Research Challenge (IFRC) site. Tables B1–B3 in Appendix B summarize the details of each problem scenario presented below. For all scenarios, time step size was set to the initial value indicated in the tables and allowed to increase to the maximum size specified based on convergence (PFLOTRAN increases/decreases time step size as a function of the number of Newton iterations or the maximum change in a primary dependent variable (e.g. pressure, concentration, etc.), or cuts the time step in half once a maximum number of Newton iterations is exceeded. Time step cuts only occurred with the copper leaching problem scenario and were few (less than  ).
).
[43]Parallel performance is broken down by physicochemical process model (i.e., flow and/or transport) with all times reported as the total wall-clock time required to simulate the respective process. Note that in the first two problem scenarios (i.e., copper leaching and regional doublet), the time spent in initialization and I/O is not reported. This time constituted a small fraction of the overall runtime (i.e., 3.2–4.6% and 0.6–1.0% for the largest copper leaching and regional doublet problems, respectively). For the IFRC scenario, where time spent in initialization and I/O ranged 0.15–21.8% of the overall runtime, I/O plays a larger role in performance as large quantities of data must be read to restart the simulation, which becomes cumbersome at extremely large process counts. Thus, the performances of the initialization and I/O stages are studied separately in that scenario.
[44]It is the authors' view that time spent in initialization and I/O should be reported separate from process model times (i.e., actual time stepping) since the time required to complete the initialization and I/O stages of the simulation can be amortized to near zero by running a simulation longer or reducing the frequency of I/O. Certainly, the performance of the initialization and I/O stages of a simulation should not be neglected, but it is better to analyze them separately, as is done below.
4.1 In Situ Copper Leaching
[45]Based on Lichtner [1996], the copper leaching scenario simulates in situ mining of copper by injection of an acidic solution (pH  ) into the subsurface that dissolves chrysocolla (
 ) releasing copper into solution for extraction above ground and precipitates secondary minerals in the chrysocolla front's path. A 5-spot well pattern is used in the simulation. Due to symmetry, only one quarter of the 5-spot domain is typically modeled, however, this requires an isotropic porous medium and uniformly spaced wells.
[46]The copper leaching scenario consists of a rectangular  domain with injection and extraction wells spanning the entire depth at x, y = 0 m and x, y = 16 m, respectively, as illustrated in Figure 2. The domain is discretized in half-meter increments in the horizontal and 32 m or half-meter in the vertical, depending on the problem size. Twelve chemical degrees of freedom (dofs) are considered representing 12 primary basis species, with 32 secondary aqueous complexes and 10 minerals modeled through kinetic precipitation-dissolution reactions. Simulations are run to 2 years time at which point the dominant copper bearing mineral, chrysocolla, has been removed from the system and replaced by secondary minerals.
Figure 2.
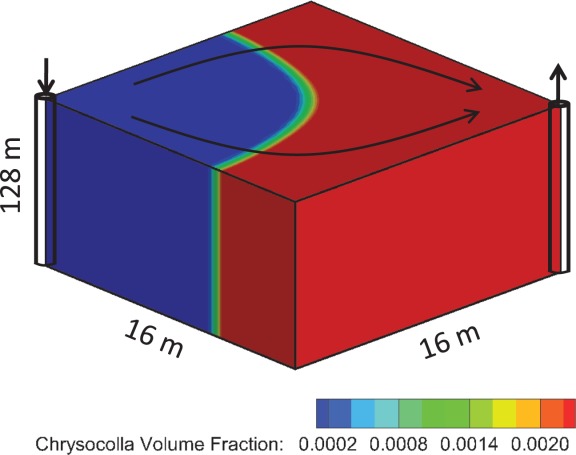
Schematic of copper leaching scenario.
[47]Parallel performance was assessed for tightly coupled (global implicit) geochemical transport while the performance of the steady-state, saturated groundwater flow solution was ignored. Two problem sizes were considered: 49 K ( grid
grid  species) and 3.1 M (
 grid
grid  species) dofs. Although the problem is inherently 2D, the fine discretization of the z-dimension serves to better assess the impact of parallel communication on performance. Regardless, the dominant processes in this problem are geochemical and local to the grid cell, which bodes well for parallel performance.
4.1.1. 49 K:
 grid
grid
 species
[48]The 49 K scenario was run on 1–1024 Jaguar XK6 processor cores incremented by powers of 2. Figure 3 illustrates the wall-clock time versus the number of processes employed for fully implicit geochemical transport. The dashed lines in the figure illustrate the slope of ideal or linear speedup, but not ideal performance itself. It is clear from the figures that scalability (or speedup) is less than ideal between 1–8 and 128–1024 processes.
Figure 3.
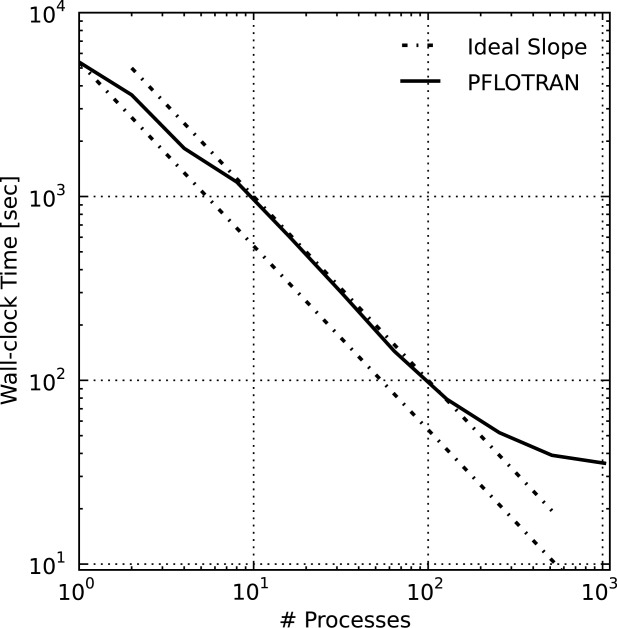
Wall-clock time for geochemical transport versus process count for 49 K copper leaching scenario. The Ideal Slope lines represent the slope of ideal speedup, which is essentially linear between 8–128 processes.
[49]The nonideal performance from 1–8 processes is less of an algorithmic issue and more attributable to cache and memory contention within the XK6 compute node. Appendix A discusses the impact of Jaguar XK6 node architecture on memory contention and parallel performance where the 49 K copper leaching scenario is employed with various processor core configurations to demonstrate that the performance degradation is more hardware related than algorithmic. It is also demonstrated that parallel performance on 1–16 processes is near linear when a single process is employed per XK6 node, which alleviates memory contention.
[50]The degradation in parallel performance between 128 and 1024 processes may be attributable to a combination of breakdown in linear solver performance and a significant decrease in computational work load per process (i.e., increasing communication to computation ratio) at the higher process counts. By default, the PETSc iterative linear solvers used by PFLOTRAN employ block Jacobi preconditioning—in which each process considers only the block of the Jacobian that corresponds to the grid cells that comprise its local subdomain—and apply point-block ILU[0] factorization on each block. This preconditioner can also be viewed as a domain-decomposition method (it is equivalent to a single-level additive Schwarz method with zero overlap). The block size/subdomain size is directly proportional to the problem size per process. As this block size decreases with increasing process counts, the amount of information available for incomplete factorization decreases (i.e., the subdomains become less representative of the global domain), diminishing the efficacy of the preconditioner. This is a well-understood behavior in subsurface simulators solving implicit systems of equations [Hammond et al., 2005] as well as in other applications [Keyes, 1999]. In comparison to the original  dofs run on a single process, the local problem sizes are very small at large process counts (i.e., 96 and 48 dofs/process on 512 and 1024 processes, respectively), far too small to expect scalable parallel performance. In fact, it is surprising that PFLOTRAN scales linearly to 128 processes. (Recall that the poor scalability between 1–16 processes is more hardware related than algorithmic as demonstrated in Appendix A simulation).
[51]Breakdown in iterative linear solver preconditioning is exhibited through an increase in the number of iterations required to converge to a solution. Figure 4 illustrates the total number of linear solver iterations in the 49 K simulation scenario versus the number of processes employed. This plot clearly demonstrates the growth in linear solver iteration count when increasing numbers of processes are employed.
Figure 4.
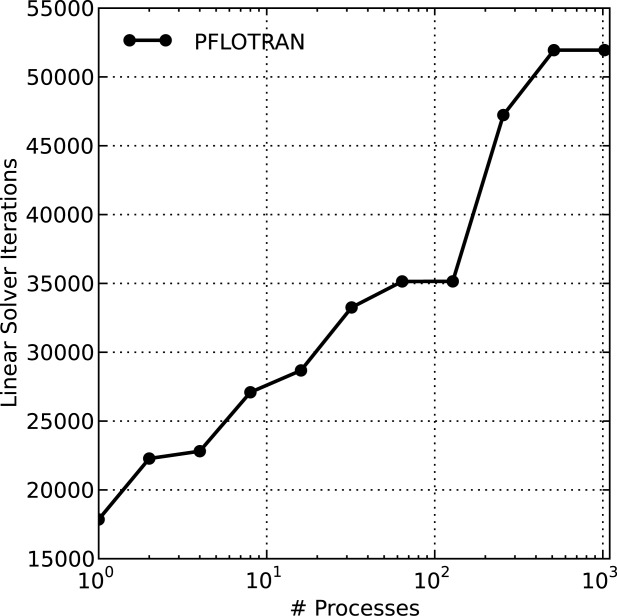
Number of linear BCGS solver iterations in simulation versus number of processes employed for 49 K copper leaching scenario.
4.1.2. 3.1 M:
 Grid
Grid
 Species
[52]The 3.1 M scenario, with 64 times as many grid cells as the 49 K scenario in the z-dimension of identical length, was run on 32–16384 XK6 processor cores, again incremented by powers of 2. Figure 5 illustrates the wall-clock simulation time for the 3.1 M copper leaching scenario. With the minimum number of processes at 32, the nodes are fully packed leaving no room for the improved memory/cache efficiency that was exhibited below 16 processes in the 49 K scenario.
Figure 5.
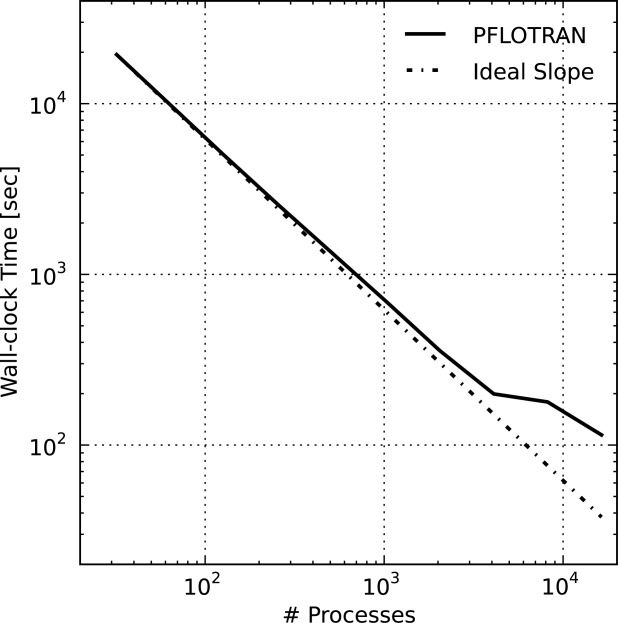
Wall-clock time for geochemical transport versus process count for 3.1 M copper leaching scenario.
[53]PFLOTRAN exhibits near ideal speedup out to 4096 processes and then tails off quickly. At that process count, each process possesses 768 dofs, which is near the ratio of number of dofs to processes at which the 49 K scenario performance begins to degrade. The performance degradation is largely due to a jump in the cost of parallel communication as more of the machine must be spanned. Figure 6 shows that the total number of linear solver iterations is nearly identical for the 4096 and 8192 process cases, but PETSc profiling results reveal that the proportion of time spent in vector dot products and norms (both of which require collective communication to compute a global reduction) grows from 17 to 39% when increasing from 4096 to 8192 processes. At 16,384 processes, a spike in the number of linear solver iterations further reduces parallel speedup.
Figure 6.
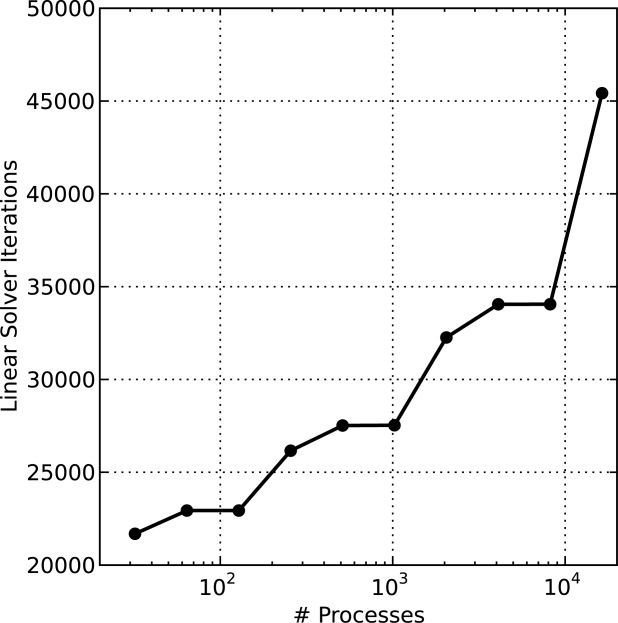
Number of linear BCGS solver iterations in simulation versus number of processes employed for 3.1 M copper leaching scenario.
[54]Regarding iterative linear solver performance, note that several plateaus exist in Figure 6 where the number of linear solver iterations remains nearly constant (this phenomenon is also evident for the 49 K scenario in Figure 4). Since the copper leaching problem involves essentially 2D flow between the injection and extraction wells that span the depth of the domain, transport is inherently 2D and for the most part decoupled in the vertical dimension. Therefore, when the parallel domain decomposition is refined in the vertical, there is little to no impact on the block Jacobi preconditioner performance since the matrix blocks are essentially decoupled in the z-dimension (i.e., the off-diagonal Jacobian entries representing coupling in z are small relative to those in x and y).
[55]As discussed earlier, the copper leaching scenario in the 5-spot flow regime is well-designed for demonstrating parallel performance since the problem is dominated by local geochemistry (large preconditioner friendly matrix blocks in the Jacobian) and transport is coupled primarily in 2D. However, this does not imply that the problem is trivial to solve. Throughout the 2 year simulation, minerals precipitate and dissolve in (often quasi-stationary) fronts that propagate downgradient much more slowly than groundwater velocities. However, these flow velocities are steady through time. The next test scenario examines parallel performance for transient flow and solute transport typical within a larger field setting.
4.2. Regional Doublet
[56]The regional doublet scenario models variably saturated groundwater flow and solute transport within a hypothetical aquifer measuring  as illustrated in Figure 7. The aquifer is layered with four uniform soil types of varying porosity and anisotropic permeability. The porosities of the soil layers are 0.25, 0.35, 0.25 and 0.2, respectively, with horizontal permeability set at
  ,
,  ,
,  , and
, and  m2, and vertical permeability an order of magnitude smaller in each layer. Variably saturated flow is simulated in the top soil layer through the Richards equation with saturation and relative permeability modeled through the van Genuchten and Mualem constitutive relations, respectively, with an air entry pressure of
  [Pa], pore size distribution (n) of 2, and a residual saturation equal to 0.1. Regional flow is imposed by prescribing a gradient of −0.002 [m/m] across the domain in the x-direction from west to east with a transient river stage at the eastern boundary. River stage fluctuates 3 meters seasonally, cycling yearly over the 10 year simulation. Recharge is transient, prescribed at between 25 and 29 cm/yr. A pair of injection/extraction wells form a doublet in the system, each pumping at an extreme rate of 105 m3/day with doublet flow in the same direction as regional flow, west to east. A single solute tracer is added at the injection well and transported downgradient. Time step size is restricted to 0.1 yr to preserve a CFL
  .
.
Figure 7.
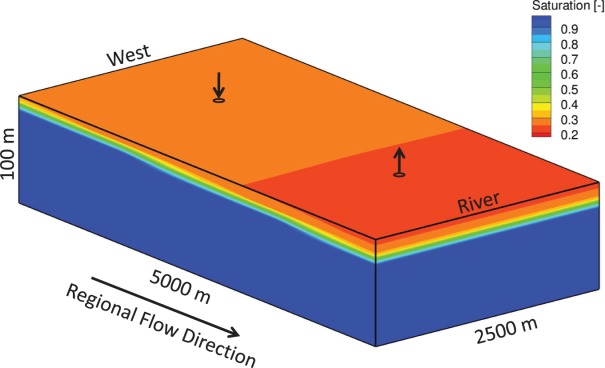
Schematic of regional doublet scenario.
[57]The regional doublet scenario provides a transient, yet not overly dynamic variably saturated flow and solute transport problem for testing PFLOTRAN parallel performance at the kilometer scale. Geochemical transport is not considered in this scenario, and thus, the sparse systems of equations solved consider only one degree of freedom per grid cell. In the results that follow, four problem sizes are considered
[58]1. 102 K dof:  grid on 1–512 processes
[59]2. 630 K dof:  grid on 8–1024 processes
[60]3. 2.5 M dof:  grid on 16–16,384 processes
[61]4. 10 M dof:  grid on 128–16,384 processes.
[62]Figure 8 shows wall-clock times versus process count for flow and transport for each of the four regional doublet problem sizes, all of which are plotted on the same scale for comparison purposes. Also included in the plots is the slope of ideal linear performance (dash-dot line) for reference purposes and a vertical dotted line signifying the threshold beyond which (i.e., to the right of which) the number of dofs per process drops below 10 K. These results demonstrate that at greater than 10 K dofs per process (i.e., to the left of the dotted line) PFLOTRAN performance is near ideal for all cases except the 102 K dof problem. In the 102 K dof case, the cache/memory contention discussed in section 4.1.1 and Appendix A likely factors in at eight processes and below. Note that in Figure 8a the shape and slope of the curves for both flow and transport are similar to that of the geochemical transport result in Figure 3 below eight processes, suggesting the presence of intranodal memory contention. Figure 8 demonstrates that the ratio of number of dofs to process count can drop well below 10 K for smaller overall problem sizes (i.e., 102 K, 630 K, 2.5 M), but the PFLOTRAN simulation is most likely to exhibit scalable parallel performance at or above 10 K dofs per process. The increase in runtime at greater than  processes in Figures 8c and 8d is likely due to a combination of too few dofs per process (growing communication to computation ratio) and breakdown in Krylov solver performance as discussed earlier in section 4.1.1.
Figure 8.
Wall-clock time for flow and transport versus process count for the regional doublet scenario: (a) 102 K, (b) 630 K, (c) 2.5 M, and (d) 10 M dofs scenarios. In all cases, simulations run at dofs/process exhibit scalable parallel performance except when intra-nodal memory contention comes into play (i.e., 102 K dof scenario). The 102 K dof scenario (a) includes times for the heterogeneous permeability layer (Het.).
[63]One final regional doublet scenario is the case where a heterogeneous and anisotropic layer is introduced into the third layer of the 102 K dof scenario between 30 and 50 m elevation. The permeability in this layer ranged  –
–  m2 with a mean of
  m2 and a standard deviation
  m2. A comparison between the homogeneous and heterogeneous (Het.) results in Figure 8a shows little difference in the shape of the flow and transport curves. However, the heterogeneous scenario does require approximately one third more time to complete. This is not unexpected as heterogeneity broadens the spectrum of eigenvalues that must be resolved by the Krylov solver (i.e., increases the condition number of the Jacobian matrix) resulting in additional iterations as shown in Figure 9. Note that the relative increase in solver iterations versus the number of processes employed is largest for transport with the heterogeneous 102 K dof scenario.
Figure 9.
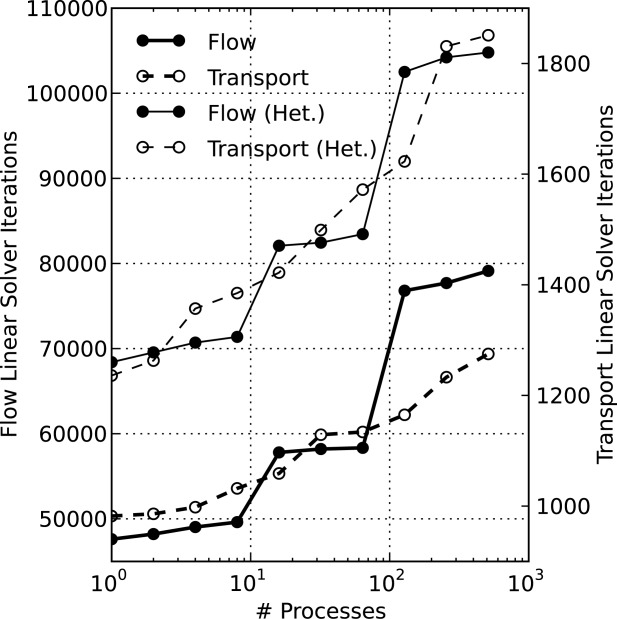
Number of flow and transport linear BCGS solver iterations in simulation versus number of processes employed for the 102 K regional doublet scenario without and with heterogeneity (Het.).
4.3. Hanford 300 Area IFRC
[64]The Hanford 300 Area IFRC scenario is based on a field-scale injection experiment performed at the Hanford 300 Area Integrated Field Research Challenge (IFRC) site in March of 2011, one of many conducted since 2008. The purpose of the experiment was to inject water with tracer and low-concentration uranium into the persistent uranium plume at the site and monitor tracer transport and uranium elution at downgradient wells within the triangular IFRC well field. Tens of thousands of PFLOTRAN simulations have been run within a Bayesian data assimilation framework employing ensemble Kalman filters and high performance computing to invert for hydrologic properties and evaluate the geochemical response of sorbed uranium to stimulus [Chen et al., 2013]. Although each realization (in the ensembles of simulations executed) ran for 1000 h in simulation time, PFLOTRAN performance was assessed on the most dynamic portion of the experiment beginning with a restart from a checkpoint file at 15 min prior to the 353 h injection and ending 155.75 h afterward (509 h total).
[65]Computationally challenging aspects of the Hanford 300 Area IFRC scenario include heterogeneous porous media [see Chen et al., 2013 for details], extremely dynamic variably saturated groundwater flow (i.e., an undulating water table with flow velocities that rapidly change in magnitude and direction) and complex geochemistry with 10 primary aqueous species, 43 secondary aqueous complexes, and kinetic multirate surface complexation considering two surface complexes and 50 site fractions. Since the ratio of geochemical transport to flow degrees of freedom is 10 to one, this problem presents a unique challenge for efficient parallel computing where the user must simultaneously consider the number of degrees of freedom per process for both flow and geochemical transport. If the number of chemical dofs per process is too large, the simulation may not complete in a reasonable amount of time or within time limits dictated by the supercomputer's scheduling policy. Assigning too few flow dofs per process may result in poor parallel performance.
[66]The  IFRC scenario domain is discretized with 432 K grids cells measuring
  . At one and 10 dofs per grid cell, the total number of flow and geochemical transport dofs are 432 K and 4.32 M, respectively. Simulations were run on 32–16,384 Jaguar XK6 processor cores incremented by powers of 2. Figure 10 presents the total wall-clock time required to complete the simulation versus the number of processes employed where the total time is divided between Flow, Geochemical Transport, and time spent in Other portions of the code (the major contributors being initialization and checkpointing). The slope of ideal speedup is plotted for comparison purposes. The corresponding relative strong scaling efficiencies are shown in Figure 11. The overall scalability of the code is near linear (Total efficiency
  % in Figure 1) out to 512 processes. Beyond 512 processes, the scalability of the flow solution and Other portions of the code begins to degrade dramatically.
Figure 10.
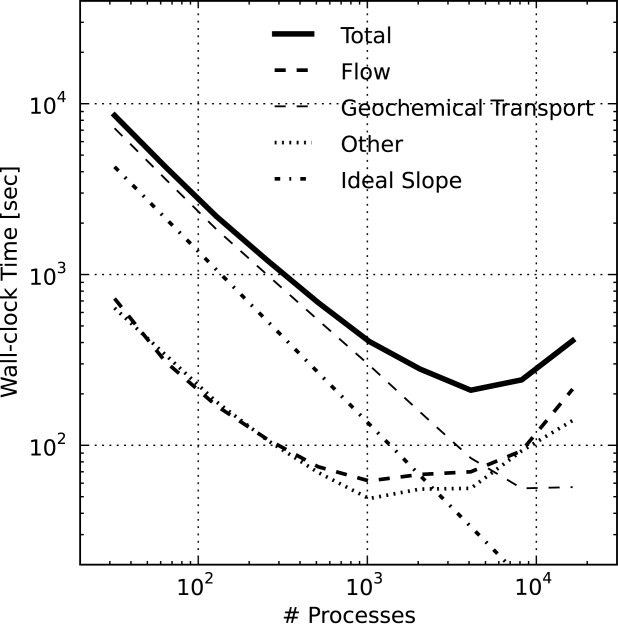
PFLOTRAN wall-clock time for the IFRC problem scenario where the Total time is divided into time spent in Flow, Geochemical Transport, and Other (i.e., initialization, I/O). Ideal Slope indicates perfect scalability. Note that beyond 128 processes, the size of the IFRC flow problem on each process is too small to expect good scalability (i.e., well below 10 K flow dofs/process).
Figure 11.
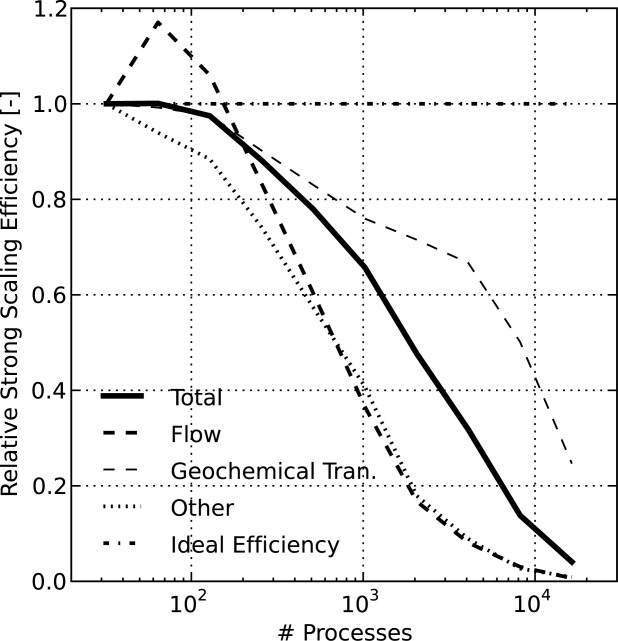
PFLOTRAN relative strong scaling efficiency for the IFRC problem scenario where the efficiency for the entire simulation (Total) is divided into the Flow, Geochemical Transport, and Other (i.e., initialization, I/O) components. Ideal efficiency is 1.0. The superlinear efficiency for Flow is likely due to caching effects. Note that beyond 128 processes, the size of the IFRC flow problem on each process is too small to expect good scalability (i.e., well below 10 K flow dofs/process).
[67]As discussed earlier, the time spent in initialization and I/O (i.e., Other) for the copper leaching and regional doublet scenarios was negligible. However, this was not the case with the IFRC scenario. The major contributors to Other were time spent in initialization and checkpointing. The initialization stage of the code can be broken down into time spent restarting the simulation (i.e., reading checkpointed solution), reading boundary and initial condition data, and reading HDF5 files containing material ids, permeabilities, initial pressures, and initial concentrations. Note that initial conditions (i.e., pressure, concentration, etc.) are still read when restarting a simulation, though they are overwritten. A breakdown of the time spent in initialization is shown in Figure 12 where Init Stage, the total time spent in initialization, is divided into the three major contributors: Restart, Reading Condition Data, and HDF5. Below 1024 processes, the performance of initialization stage scales well (i.e., the time spent mainly in I/O remains small at  s). However, this figure clearly illustrates the presence of I/O contention at larger process counts. It should be noted that the initialization time varied greatly between jobs on Jaguar suggesting that other jobs running on the supercomputer may contribute to the I/O contention, a known issue on Jaguar. The performance of checkpointing at the end of the simulation (the other major contributor to Other in Figure 10) was nearly identical to Restart. The use of PFLOTRAN's two-stage I/O capability would reduce the time spent in HDF5, but the capability is not yet supported with checkpoint/restart.
Figure 12.
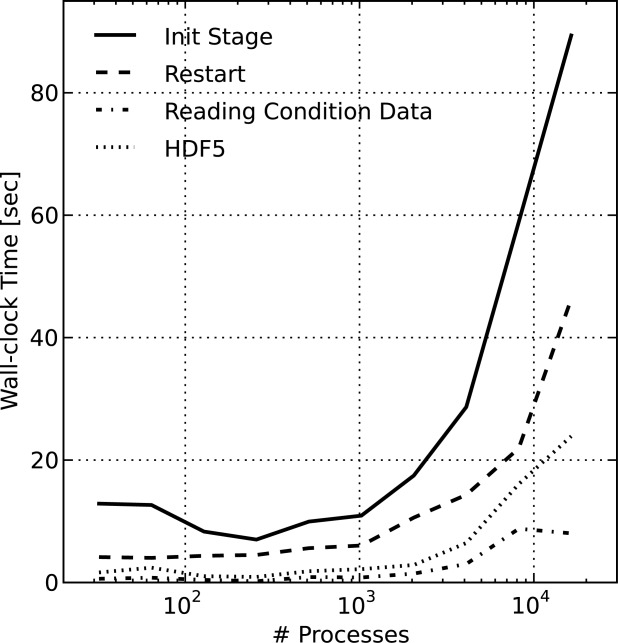
PFLOTRAN wall-clock time for the initialization stage (Init Stage) of the IFRC problem scenario where the initialization time is divided into time spent in Restart and reading HDF5 files and initial/boundary conditions (Reading Condition Data). Note that up to 1024 processes, within the realm of realistic problem size per process for good scalability from the flow and transport code, the initialization stage scales well (i.e., it remains small, at or below 13 s).
[68]Had the IFRC scenario been executed without checkpoint/restart, PFLOTRAN's overall performance based on total wall-clock time would have been much better at large process counts for two reasons. First, time spent in checkpoint/restart, the largest contributors to Other, would not have existed. Second, the simulation would have started at time 0, not 353 h into the experiment, providing a longer runtime over which the growing initialization time (i.e., Reading Condition Data and HDF5) could be amortized across time spent in the more scalable flow and geochemical transport. Thus, as discussed earlier, the performance of initialization and I/O (i.e., Other) should be reported separately from the process model solution times (i.e., Flow and Geochemical Transport).
[69]To further study the performance of the physicochemical process models, Figures 13 and 14 illustrate a breakdown of the total wall-clock times for the flow and geochemical transport shown in Figure 10, respectively. These total times are divided among the nonlinear and linear solves, residual and Jacobian evaluations, and global reductions. These times are not mutually exclusive (i.e., the nonlinear solve includes the residual and Jacobian evaluations, linear solve; the linear solve includes most but not all global reductions, etc.). The plots include vertical lines with horizontal dashes signifying the threshold beyond which (i.e., to the right of which) the number of dofs per process drops below 10 K.
Figure 13.
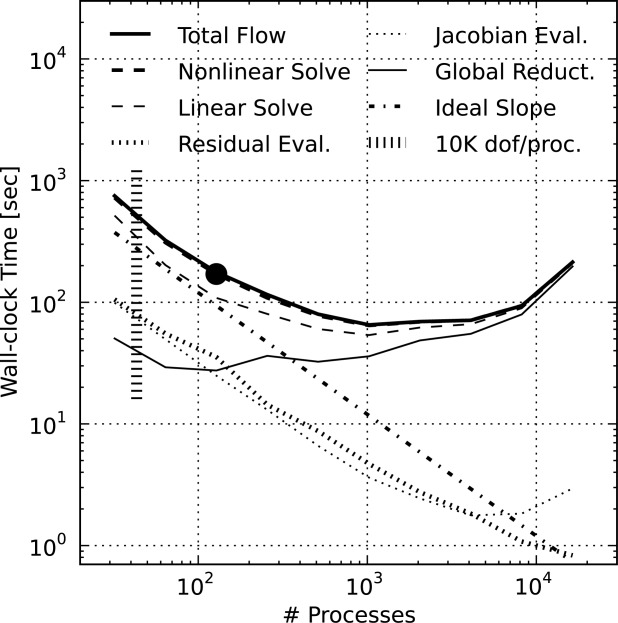
PFLOTRAN wall-clock time for the flow stage of the IFRC problem scenario where the Total Flow time is divided into time spent in the Nonlinear Solve, Linear Solve, Residual Evaluation, Jacobian Evaluation, and Global Reductions. Ideal Slope indicates perfect scalability. The Nonlinear Solve and Linear Solve are not mutually exclusive. Note that beyond 128 processes, the size of the IFRC flow problem on each process is too small to expect good scalability (i.e., well below 10 K flow dofs/process).
Figure 14.
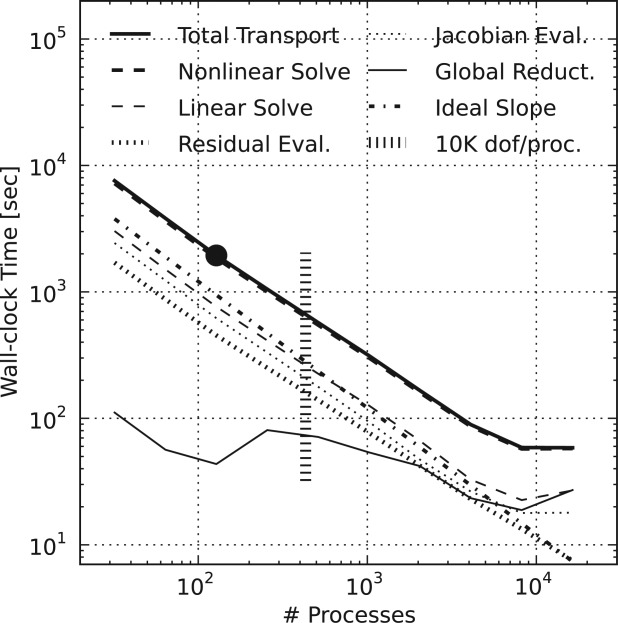
PFLOTRAN wall-clock time for the geochemical transport stage of the IFRC problem scenario where the Total Transport time is divided into time spent in the Nonlinear Solve, Linear Solve, Residual Evaluation, Jacobian Evaluation, and Global Reductions. Ideal Slope indicates perfect scalability. The Nonlinear Solve and Linear Solve are not mutually exclusive. Due to the larger problem size per process relative to flow (i.e., 10×), the geochemical transport stage scales well out to 8192 processes or 527 dofs per process.
[70]From Figure 3, it is clear that, although superlinear at small numbers of processes (see also Figure 11), the scaling of the flow solution is far from ideal at large process counts, tailing off at 128 processes ( dofs per process). The figure demonstrates that the degradation in parallel performance is mainly attributable to performance degradation in the linear Krylov solver likely due to increased time spent in global reductions and a growth in linear solver iterations (see Figure 15). Note that growing linear solver iterations increases the number of global reductions, compounding performance degradation attributable to global reductions. The residual and Jacobian evaluations scale well out to 1024–2048 processes.
Figure 15.
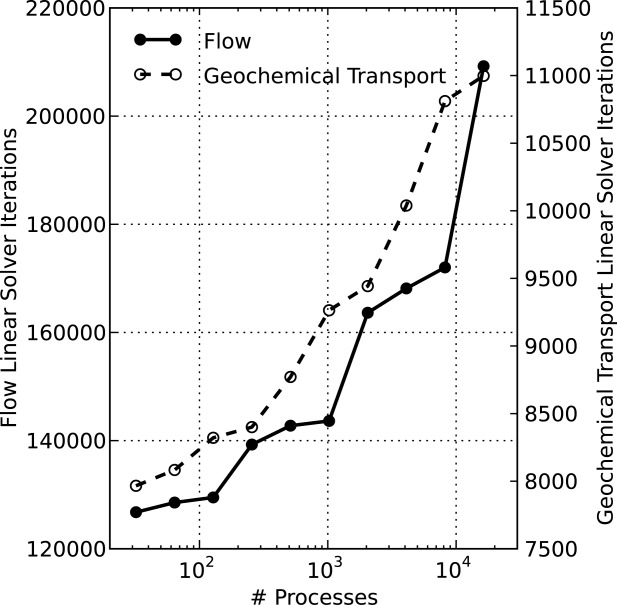
Number of flow and geochemical transport linear BCGS solver iterations in simulation versus number of processes employed for the IFRC scenario.
[71]On the other hand, geochemical transport scales much better, with perfect scalability up to 128 processes ( dofs per process) and near linear scalability out to 4096 processes (
 dofs per process). The time spent in global reductions does jump between 128 and 256 processes. However, the total time spent in global reductions is sufficiently small so as to not adversely impact parallel performance until after 4096 processes.
[72]The performance of the geochemical transport solver is similar to that of the copper leaching scenario. In both cases, a global implicit method is employed tightly coupling transport and geochemical reaction within a single large Jacobian matrix. Recall from the copper leaching scenario (section 4.1) that with large numbers chemical components tightly coupled through geochemical reaction, the systems of equations being solved are diagonally dominant and well-suited for the block Jacobi preconditioner. Therefore, the geochemical transport solution scales to far fewer dofs per process than is possible with the flow solution, where for flow there is too little work (too few dofs per process) at high process counts to outweigh the increasing number of linear solver iterations and growing demands of parallel communication.
[73]Note that at the minimum flow wall-clock time ( s on 1024 processes), the number of dofs per process is
  . At 2048 processes, PETSc decomposes the domain with
  processes in x, y, z. However, this decomposition does not divide evenly into the number of grid cells in each direction (i.e.,
  cells). Therefore, at 2048 processes, the number of flow dofs per process, which is equivalent to the number of grid cells per process, ranges between 147 (
 cells) and 256 (
 cells) and a load imbalance (calculated based on equation (7)) of up to 74%, i.e.
|
> |
(8) |
is introduced. Load imbalance is often reflected through delay at synchronization points in the simulation such as global communication (i.e., an increase in communication time). The large black dots in Figures 3 and 4 reflect the number of processes (i.e., 128) employed per simulation when ensembles of realizations are simultaneously run on tens of thousands of processes on the supercomputer [Chen et al., 2013] and demonstrate that the supercomputer is being utilized within the efficient spectrum of the speedup curves.
[74]Figure 5 shows the number of linear solver iterations for flow and geochemical transport. Note that the growth in solver iterations is not linear. The slope of the lines tends to increase when employing larger numbers of processes. The plot also shows significant jumps in the number of solver iterations for flow at 256, 2048, and 16,384 processes. At these process counts, the number of processes in the z-direction have been doubled over the previous count as shown in Table1. This phenomenon suggests strong vertical coupling of flow (pressure). As the number of processes in the z-direction doubles, the only difference in the solution process is that the coefficients outside the local block within the Jacobian, which represent coupling in the z-direction across processes, are dropped by the block ILU preconditioner, degrading iterative Krylov solver convergence. Were these coefficients smaller, the impact on convergence may be much less.
Table 1.
Decomposition of Hanford 300 Area IFRC Scenario for 32–16,384 Processes
| Total Number of Processes | Number in X | Number in Y | Number in Z |
|---|---|---|---|
| 32 | 4 | 4 | 2 |
| 64 | 8 | 4 | 2 |
| 128 | 8 | 8 | 2 |
| 256 | 8 | 8 | 4 |
| 512 | 16 | 8 | 4 |
| 1024 | 16 | 16 | 4 |
| 2048 | 16 | 16 | 8 |
| 4096 | 32 | 16 | 8 |
| 8192 | 32 | 32 | 8 |
| 16,384 | 32 | 32 | 16 |
[75]The iteration counts for geochemical transport exhibit the opposite effect, but to a lesser degree. With transport it appears that coupling is weaker in the vertical (z-direction) than in the horizontal, though the contrast is much smaller. This makes sense given flow (velocities) at the Hanford 300 Area IFRC site is predominantly horizontal [Hammond and Lichtner, 2010]. This behavior was exhibited earlier for the copper leaching scenario where flow was horizontal. The plateaus in the iteration counts within Figures 4 and 6 occur when the number of processes in the z-direction double.
[76]In the end, the modeler must weigh the trade-offs of iterative solver performance for flow and transport when choosing a decomposition. To do so, a minimum allowable relative strong scaling efficiency can be set for the combined performance. In the case of the IFRC scenario, a minimum allowable efficiency of 75% would dictate that 512 is the maximum number of processes that can be employed for scalable simulation (see Figure 1). At that process count, the simulation completes in under 12 min, well within the time constraints of any supercomputer queueing policy.
4.4. PFLOTRAN Weak Scaling
[77]As discussed in section 3, a weak scalability analysis measures a code's parallel performance with a fixed problem size per process and increasing process counts. There are two distinct approaches to implement weak scalability: keep the grid resolution fixed and grow the size of the problem domain, or keep the problem domain fixed and refine the grid resolution. For this work, the latter was chosen since it makes the most sense from a practical standpoint as a single real-world problem domain does not typically vary in size. With a fixed problem domain and grid refinement, the simulated problem changes with increasing process counts since the grid resolution increases altering the spectrum of eigenvalues for flow and transport. For this reason, it is difficult to expect good weak scalability with a Newton-Krylov solver, unless the Krylov solver is preconditioned with a multilevel technique (e.g., multigrid). This behavior is demonstrated in Figure 16 where wall-clock time, Newton iterations, and linear Krylov iterations are compared in a weak scalability sense for flow and transport with the (homogeneous) regional doublet problem from section 4.2. As discussed in section 2.3.1, the default PETSc stabilized biconjugate gradient method (BCGS) with block Jacobi preconditioning (point-block ILU[0] in each block) are employed to solve the linear systems of equations for both flow and transport.
Figure 16.
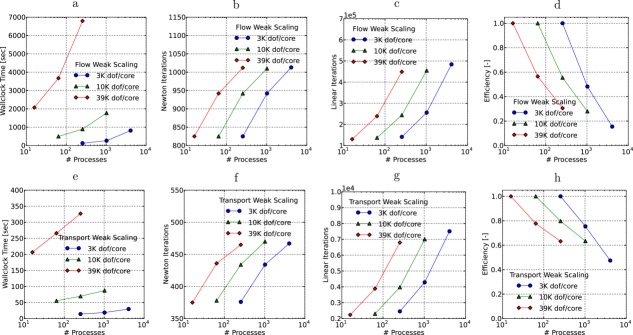
(a and e) Regional doublet wall-clock time, (b and f) Newton iterations, (c and g) linear iterations and (d and h) efficiency for the (a–d) flow and (e–h) transport weak scalability comparison.
[78]For ideal weak scalability, the wall-clock times in Figures 6a and 6e and efficiencies in Figures 6d and 6h should be flat indicating no increase in wall-clock time for a fixed problem size per process. However, this is not the case as wall-clock time grows and efficiency drops with increasing process count. The main cause of the increase in wall-clock time is the growth in linear Krylov solver iterations (see Figures 6c and 6g), which is directly correlated to wall-clock time. This is a well-understood phenomenon, and often multilevel solvers (or preconditioners) such as algebraic or geometric multigrid are employed to improve performance (limit growth in linear iteration count).
[79]Multigrid solvers work well for elliptic or parabolic PDEs where the initial guess for the solution is far from the final solution (i.e., large initial error). Multigrid with its smoothing on a hierarchy of grid resolutions resolves a wide spectrum of error (i.e., high to low frequency) [Briggs et al., 2000; Trottenberg et al., 2001]. The more general Krylov solver, however, acts like a smoother on a single grid level, removing high frequency error quickly, but low frequency error tends to persist requiring large numbers of iterations to resolve. From this viewpoint, multigrid can be more efficient for a select set of problems (e.g., groundwater flow), and problem size can often increase with little to no increase in multigrid iteration count.
[80]However, multigrid solvers are not appropriate for all systems of PDEs [Greenbaum, 1997], and they may introduce new challenges. As problem size grows, levels of grid refinement are often added to the grid hierarchy to preserve optimal convergence, but this comes with algorithmic cost that may exceed the Krylov solvers' in terms of time to solution. Kollet et al. [2010] illustrates this phenomenon in Figures 1b and 2 of their work where the Solver Setup scaled parallel efficiency decreases to near zero and relative compute time increases to 0.1 as the number of processes approaches 16,384. Baker et al. [2012] demonstrates that this growth in multigrid setup time can be reduced by optimizing hypre's parameters (e.g., number of boxes, box size, etc.).
[81]Another challenge for multigrid is that many subsurface problems such as geochemical transport are transient with hyperbolic terms (i.e., advection) in their PDEs requiring fine temporal resolution. The equations defining such processes often produce systems of equations with diagonally dominant matrices for which general Krylov methods and conventional preconditioners are very effective, for the same reason pointwise Jacobi iteration is effective for diagonally dominant matrices [Golub and Van Loan, 1996]. On the other hand, the application of multigrid solvers to system PDEs that represent complex multiphase flow and advection-dominated geochemical transport scenarios remains a young but active area of research [Lee, 2009; Guo et al., 2013]. These systems do not have the nice properties of elliptic PDEs [Hackbusch, 1985; Brandt and Livne, 2011].
[82]It is the authors' experience that many subsurface problems involve a fixed domain, and one simply wants to solve the problem in less time using more processes to the extent possible, and strong scalability provides such guidance. Unfortunately, from a parallel performance viewpoint, researchers often report weak scalability for multigrid solvers without any information on strong scalability. Given that multigrid methods excel as problem size grows, this is not surprising. However, it is difficult to assess the strong-scaling performance of multigrid relative to Krylov solvers in these cases since only one side of the scalability picture is presented (i.e., weak scaling). The converse can be said of those presenting solely strong scalability performance results.
5. Discussion
[83]The development of a scalable and efficient parallel subsurface simulator is no easy task. However, careful and deliberate design with iterative input from experienced domain scientists, computer scientists, and computational scientists and feedback from end users can greatly enhance the likelihood for success. The open-source PFLOTRAN project is an example of such an effort. Clearly, PFLOTRAN's weak-scaling performance can be enhanced, and the PFLOTRAN and PETSc developers are actively working together to improve this performance [McInnes et al., 2013]. However, the PFLOTRAN performance presented in section 4 demonstrates the code's strong scalability on a wide range of physicochemical process model scenarios, problem sizes, and processor core configurations. Just glancing at Figures 10–14, the reader may perceive that PFLOTRAN is not scalable at large process counts. However, one must judge performance within the context of problem size per process (e.g., work per process). Should the decomposed problem size per process be too small (too little work per process), PFLOTRAN's parallel performance is expected degrade due to increasing Krylov solver iterations counts and a growing cost of communication, as demonstrated in Figures 13 and 14 where the time spent in global reductions increases. By maintaining PFLOTRAN's problem size per process at 10 K or greater, strong scalability is better ensured.
[84]PFLOTRAN's scalable performance thus far can be attributed to several choices made by the developers early on in the development process
[85]First, the developers attribute much of their success with respect to parallel scalability to the choice of using the PETSc library (i.e., an efficient parallel framework). Because solvers and parallelism are largely handled by PETSc, the PFLOTRAN source code can remain at a manageable size and PFLOTRAN developers have more time to focus on application-specific code. Furthermore, excellent support (in terms of guidance, response time, and code modification/enhancement) has been provided by the PETSc developers. Though PETSc offers a stable release version, the development branch is entirely public and PFLOTRAN development tracks this branch. This means that various improvements made by the PETSc community can immediately be leveraged by PFLOTRAN and, through close collaboration with the PETSc developers, PFLOTRAN requirements have led to improvements in PETSc.
[86]Second, is the decision to employ distributed-memory, domain decomposition-based parallelism as the primary approach to parallelization as opposed to solely process-level techniques such as pthreads, OpenMP, CUDA, or OpenCL, which can require a great deal of tuning for compiler/hardware configuration, provide limited performance for solving implicit systems of sparse PDEs, and have difficulty scaling beyond the number of processes provided by a single shared memory node. Attempts to parallelize code solely through these process-level techniques have difficulty scaling beyond tens of processes [e.g., Gwo et al., 2001].
[87]Next in line is the choice of binary HDF5 for parallel I/O with the two-stage I/O option provided by collaborators [Sripathi, 2010]. HDF5 enables the simulation of large and complex user-defined data sets where individual parameter values can be imported on a cell by cell basis. The library also enables output operations to complete on many tens to hundreds of thousands of processes [Hammond et al., 2012].
[88]Finally, the decision to open-source PFLOTRAN helps improve its scalability by allowing the user community to interrogate the code, suggest improvements, and most critically, exercise the capability on user-defined problems with institution-specific hardware, all of which stress the performance of various portions of the code. Without this user interaction, cross-platform scalability would be more difficult.
[89]It should also be noted that PFLOTRAN's object-oriented design has little to no impact on performance. During the code's refactor as part of the SciDAC-2 project, the performance of the traditional sequential and new object oriented versions of PFLOTRAN's biogeochemical reaction algorithms were compared, and neither was deemed to run more optimally. But even if the object oriented version were somewhat slower (e.g., a few percent), its flexibility and modular design could be well worth any minor losses in performance in many cases of interest. Clearly, many other choices factored into PFLOTRAN development, but these constitute the major choices thus far, and there are yet many improvements to be made.
6. Summary and Conclusions
[90]The purpose of this research was to demonstrate the scalability of the object-oriented PFLOTRAN code on real-world problem scenarios and provide a reference point for the performance of a subsurface simulator employing HPC. One of the keys to successful high performance computing is the ability to demonstrate parallel performance, whether good or poor (to inform the user) and explain the poor performance in terms of physical hardware or algorithmic issues. For PFLOTRAN that was demonstrated in section 4 where parallel performance was assessed on three realistic problem scenarios: (1) in situ leaching of copper from an ore deposit in a 5-spot flow regime (copper leaching), (2) variably saturated flow and conservative solute transport within a regional aquifer with a doublet well configuration (regional doublet), and (3) a real-world experiment at the Hanford 300 Area IFRC site involving uranium surface complexation within an extremely transient, variably saturated groundwater flow domain (IFRC).
[91]The performance of PFLOTRAN on these problems was discussed in detail, with the intent of providing subsurface scientists with improved understanding of the parallel scalability possible with today's supercomputing resources and the potential benefit that high performance computing may provide to their research (i.e., speedup that will enable larger and more complex simulations to be executed in less time). It was demonstrated that PFLOTRAN scales well on all three problems in the context of strong scaling when the number of degrees of freedom per process (calculated as a function of domain decomposition) is maintained at or above 10 K dofs/process. With the exception of the 10 M dof regional doublet scenario, PFLOTRAN scaled near linearly well below 10 K dofs/process, and in the case of geochemical transport with large numbers of chemical species (e.g., 10–12), down to hundreds of dofs/process. Note that Jaguar is a leadership-class supercomputer with an optimized XK6 interconnect for communication. Custom, off-the-shelf systems may require larger problem sizes per process to ensure good parallel performance. For this reason, it is important that users develop runtime or speedup curves on the platform of interest in order to verify that a code is being executed within the scalable spectrum of parallel performance.
[92]All three test scenarios were diagonally dominant subsurface problems (i.e., in terms of matrix coefficients in the nonlinear systems of equations being solved) with complex biogeochemistry, advection-dominated transport, and/or highly transient groundwater flow (small time steps). Certainly, the addition of a robust multigrid solver (or preconditioner) would serve the PFLOTRAN well as demonstrated in the lackluster weak scalability for the regional doublet scenario (see section 4.4). However, such multilevel algorithms have limited utility in the context of multiphase flow, advection-dominated transport, and reactive biogeochemical transport as the development of block smoothers for system PDEs remains an active area of research [Lee, 2009; Guo et al., 2013].
[93]Section 4 demonstrated that solver algorithms exhibit sensitivity to the physical decomposition and distribution of subsurface processes across computing processes. In the case of the Hanford IFRC scenario (section 4.3) pressure exhibited a stronger sensitivity to decomposition in the vertical whereas the opposite was true for uranium transport, but due to sequential coupling, both were solved separately with the same decomposition. Such phenomenon must be considered when choosing a more optimal decomposition.
[94]It is strongly recommended that researchers developing and/or utilizing parallel simulators on supercomputers establish benchmark problems such as those presented in this work (but more relevant to their respective fields), execute the problems employing a wide range of process counts (both in a strong-scaling and weak-scaling sense), and develop parallel speedup or efficiency curves based on overall wall-clock times to assess the performance of the code. By doing so, the user can better learn and understand the strengths and limitations of the simulator and supercomputer and employ parallel computing in a manner that is hopefully as efficient as possible.
Appendix A Analysis of In Situ Copper Leaching 49 K Scenario Performance on 1–8 Processes
[95]To better explain the degradation in performance between 1–8 processes on the 49 K copper leaching scenario (i.e., section 4.1.1), a brief description of the Jaguar XK6 node architecture and the AMD Interlagos processor is required. Figure 17 illustrates the configuration of processor cores and cache within a 16 core AMD Interlagos processor. Each Jaguar XK6 compute node contains a single Interlagos processor composed of two 8-core NUMA (nonuniform memory access) nodes that reside on separate dies connected via HyperTransport links. Each NUMA node contains four “bulldozer” compute modules, each with two cores. Level I cache is unique to each core, while Level II cache is shared by the two cores within a bulldozer compute unit. Level III cache is shared by all eight cores within a NUMA node, and main memory is shared by all NUMA nodes, compute units, and cores. It is much faster for a NUMA node to access local memory than that residing on the other die. The high degree of resource sharing between modules causes many numerical kernels to display rather different performance characteristics than those observed on previous-generation AMD processors.
Figure 17.
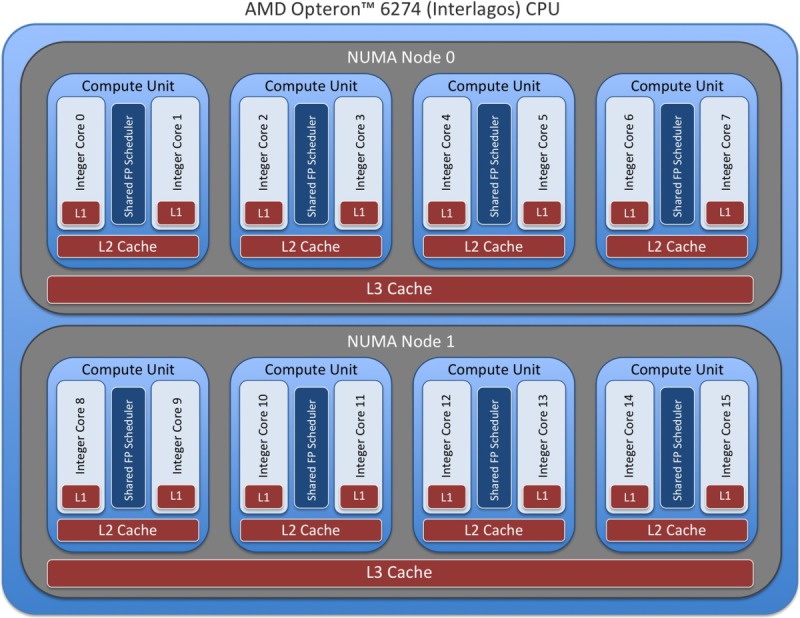
Configuration of XK6 Interlagos processor (Image courtesy of the Oak Ridge Leadership Computing Facility, Oak Ridge National Laboratory).
[96]For 1–8 processes on the 49 K copper leaching scenario, the less than ideal performance is for the most part attributable to an increase in memory contention within a Jaguar node as the number of cores employed increases (In this work, the term contention refers to competition between processor cores for cache and memory bandwidth, but not main memory given each node possesses sufficient memory to run this problem on 16 cores.). A simple comparison of processor core utilization illustrates this contention.
[97]Figure 18 illustrates the wall-clock time for the 49 K dof problem run on 16 cores versus the number of processes employed per node. The colored bars correspond to approaches for allocating processor cores within the node. The performance for each of these configurations is described below
Figure 18.
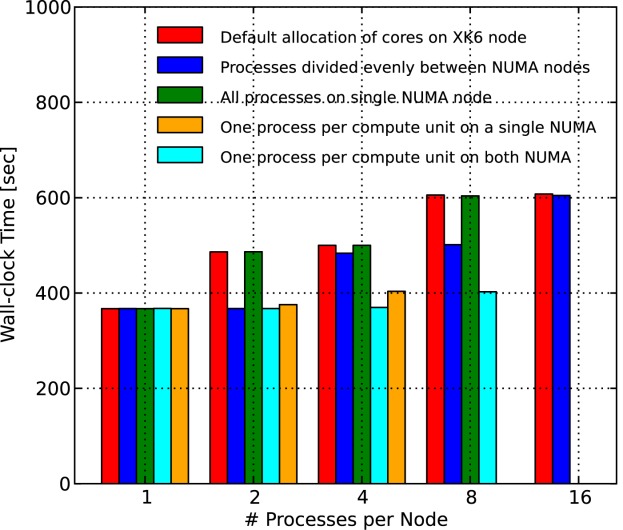
Comparison of wall-clock time versus processor core configuration on an Interlagos processor for the 49 K copper leaching scenario. “Default” refers to the results presented in Figure 3.
[98]1. Default allocation of cores on XK6 node: The default approach to allocating cores is to employ all cores within a compute unit or NUMA node before employing the next. Therefore, a job requesting four processes per XK6 node with the default configuration will employ the four cores in first two compute units (two cores per compute unit) on the first NUMA node, the remaining 12 cores (six compute units or 1.5 NUMA nodes) remaining idle. With the default approach in Figure 18, performance deteriorates between 1–2 and 4–8 processes per node.
[99]2. Processes divided evenly between NUMA nodes: This approach follows the default allocation within a NUMA node. However, processes are split evenly between NUMA nodes. Therefore, a job requesting four processes per XK6 node will employ four cores in two compute units (two cores per compute unit), but the two compute units reside on separate NUMA nodes. In this case, performance deteriorates between 2–4 and 8–16 processes per node.
[100]3. All processes on single NUMA node: This approach is identical to the default approach, but is limited to one NUMA node, thus no 16-process per node entry. This result further confirms the results for the default approach to allocation up to eight cores.
[101]4. One process per compute unit on a single NUMA: In this case, only a single core is allocated per compute unit and all compute units reside on a single NUMA node. Therefore, a job requesting four processes per XK6 node will employ four cores in four separate compute units (one core per compute unit) all on the same NUMA node. No more than four cores may be employed due to the limitation of a single NUMA node. Note the slight degradation in performance at two processes and larger wall-clock time at four processes per node.
[102]5. One process per compute unit on both NUMA: This approach mixes two of the earlier approaches. First, only one core is allocated per compute unit and second, the number processes is evenly distributed between NUMA nodes. A job requesting four processes per XK6 node will employ four cores in four separate compute units (one core per compute unit) with two compute units per NUMA node. In this case, performance is even through four processes per node and with a slightly larger wall-clock time at eight processes per node, though still much faster than the alternative approaches.
[103]It is well known that as larger numbers of cores are employed per node, performance degrades and wall-clock times increase, and in the end this will explain the less than ideal performance on 1–8 processes in Figure 3. However, what is the root cause of this inferior performance? Comparison of the approaches to allocating cores in Figure 8 suggests that (1) contention within the compute units is the primary cause, and (2) contention between compute units and between NUMA nodes impacts performance much less. Contention between cores within a compute unit is demonstrated by the default and all processes on single NUMA node scenarios where wall-clock times jump immediately at two processes per node, whereas the other three scenarios remain constant at two processes per node, and only the even distribution between NUMA increases at four processes per node (since each NUMA employs two cores in a single compute unit). Note also that the one process per compute unit scenarios never exhibit the large increase in wall-clock time. The slight growth in the orange bar (one process per compute unit on a single NUMA) at four processes per node is due to contention between single-core compute units in a single NUMA. The rise in the cyan-colored bar (one process per compute unit on both NUMA) at eight processes per node demonstrates slight contention between NUMA.
[104]It should be noted that contention within fully-packed nodes (16 processes per node) is not fully reflected in Figure 8 since the internodal communication employed for the 1–8 process per node scenarios no longer exists (i.e., at 16 processes per node, all cores reside on a single node, whereas the lower process per node scenarios distribute cores across more than one node and thus require internodal communication). However, this degradation is likely minimal considering the short hop between neighboring nodes on a switch in the communication interconnect.
[105]Figure 19 demonstrates PFLOTRAN performance employing 1–16 processes with alternative processor core configurations. From these results, it is clear that the degradation in performance between 1–8 cores is primarily due to the contention within the node, most likely the contention between cores within a compute unit mentioned earlier, as the 1 core per node scenario scaling is nearly linear at 16 processes and the single core per compute unit (1 per CU, … NUMA) scenarios also fair well. Thus, one could argue that the lack of scalability at 1–8 processes in Figures 3 and 19 is primarily due to hardware limitations and less algorithmic.
Figure 19.
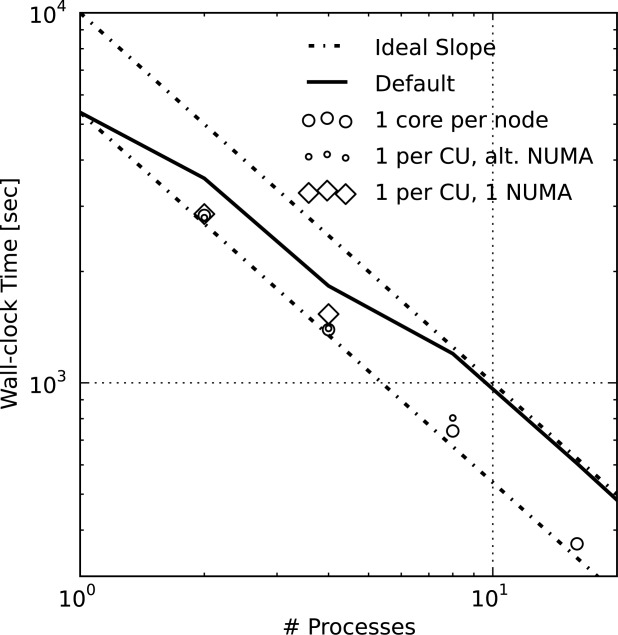
Wall-clock time for geochemical transport versus process count for the 49 K copper leaching scenario with alternative processor core configurations. “Default” refers to the results presented in Figure 3.
Appendix B Summary of Problem Scenarios
[106]Additional details regarding the configuration of the three example problems analyzed in this work are presented in Tables4.
Table B3.
Details of the Hanford 300 Area IFRC Scenario
| Scenario | IFRC |
|---|---|
| Domain | 120 m × 120 m × 15 m |
| Grid size | 120 × 120 × 30 |
| Number of primary species | 10 |
| Number of secondary species | 43 |
| Number of minerals | 1 (Calcite) |
| Number of site fractions | 50 |
| Total flow dofs | 432,000 |
| Total transport dofs | 4,320,000 |
| Initial time step size | 1 h (at restart) |
| Max. time step size | 1 h |
| Simulation duration | 509 h |
| Number of flow time steps | 701 |
| Number of transport time steps | 809 |
Table B1.
Details of the Copper Leaching Scenarios
| Scenario | 49 K | 3.1 M |
|---|---|---|
| Domain | 16 m × 16 m × 128 m | 16 m × 16 m × 128 m |
| Grid size | 32 × 32 × 4 | 32 × 32 × 256 |
| Number of primary species | 12 | 12 |
| Number of secondary species | 32 | 32 |
| Number of minerals | 10 | 10 |
| Total dofs | 49,152 | 3,145,728 |
| Initial time step size | 0.001 y | 0.001 y |
| Max. time step size | 0.01 y | 0.01 y |
| Simulation duration | 2 y | 2 y |
| Number of time steps | 1512 | 1420 |
Table B2.
Details of the Regional Doublet Scenarios
| Scenario | 102 K | 630 K | 2.5 M | 10 M | 102 K heterogeneous |
|---|---|---|---|---|---|
| Domain | 5 km × 2.5 km × 100 m | 5 km × 2.5 km × 100 m | 5 km × 2.5 km × 100 m | 5 km × 2.5 km × 100 m | 5 km × 2.5 km × 100 m |
| Grid size | 100 × 51 × 20 | 250 × 126 × 20 | 500 × 251 × 20 | 1000 × 501 × 20 | 100 × 51 × 20 |
| Total dofs | 102,000 | 630,000 | 2,510,000 | 10,020,000 | 102,000 |
| Initial time step size | 0.01 y | 0.01 y | 0.01 y | 0.01 y | 0.01 y |
| Max. time step size | 0.1 y | 0.1 y | 0.1 y | 0.1 y | 0.1 y |
| Simulation duration | 10 y | 10 y | 10 y | 10 y | 10 y |
| Number of flow time steps | 140 | 198 | 225 | 239 | 152 |
| Number of transport time steps | 140 | 198 | 225 | 239 | 152 |
Acknowledgments
[107]We thank two anonymous reviewers that greatly improved the manuscript. This research was funded by the U.S. Department of Energy (DOE) through the Office of Biological & Environmental Research, Subsurface Biogeochemical Research, PNNL Science Focus Area under DOE contract DE-AC05–76RL01830. Additional support was provided by OFM Research. Supercomputing resources were provided by the DOE Office of Science Innovative and Novel Computational Impact on Theory and Experiment (INCITE) program with allocations on OLCF Jaguar at Oak Ridge National Laboratory.
References
- Abhyankar S, Smith B. Stevens K. Preliminary implementation of hybrid MPI/pthread programming model in PETSc, Preprint ANL/MCS-P2011-0112. Argonne Natl. Lab. 2012 [Google Scholar]
- Adams MF, Bayraktar H, Keaveny T. Papadopoulos P. High Performance Networking and Computing, Gordon Bell Award; 2004. Ultrascalable implicit finite element analyses in solid mechanics with over a half a billion degrees of freedom, in ACM/IEEE Proceedings of SC2004. doi: 10.1109/SC.2004.62. [Google Scholar]
- Akcelik V, Bielak J, Biros G, Epanomeritakis I, Fernandez A, Ghattas O, Kim EJ, O'Hallaron D. Tu T. High resolution forward and inverse earthquake modeling on terascale computers. 2003. Proceedings of SC2003, a winner of the Gordon Bell Prize for special achievement at SC2003.
- Anderson WK, Gropp WD, Kaushik DK, Keyes DE. Smith BF. High Performance Networking and Computing, winner of Gordon Bell Special Prize at SC 99; 1999. Achieving high sustained performance in an unstructured mesh CFD application, in ACM/IEEE Proceedings of SC 99. [Google Scholar]
- Baker AH, Falgout RD, Kolev TV, Yang UM. In: Scaling hypre's multigrid solvers to 100,000 cores, in High-Performance Scientific Computing: Algorithms and Applications. Berry M, et al., editors. London: Springer; 2012. pp. 13–279. [Google Scholar]
- Balay S, Gropp WD, McInnes LC. Smith BF. Efficient management of parallelism in object oriented numerical software libraries. In: Langtangen HP, editor; Arge E, Bruaset AM, editors. Modern Software Tools in Scientific Computing. Birkhäuser Basel, Switzerland: 1997. pp. 163–202. [Google Scholar]
- Balay S, Brown J, Buschelman K, Eijkhout V, Gropp WD, Kaushik D, Knepley MG, McInnes LC, Smith BF. Zhang H. PETSc Users Manual, Tech. Rep. ANL-95/11—Revision 3.3. Argonne, Ill: Argonne Natl. Lab; 2012. [Google Scholar]
- Barry DA. Supercomputers and their use in modeling subsurface solute transport. Rev. Geophys. 1990;28(3):277–295. [Google Scholar]
- Brandt A. Livne OE. Multigrid Techniques: 1984 Guide With Applications to Fluid Dynamics, Revised Edition, Classics in Applied Mathematics. Vol. 67. Philadelphia, Pa: Soc. for Ind. and Appl. Math; 2011. [Google Scholar]
- Briggs WL, Henson V. McCormick SF. A Multigrid Tutorial. 2nd ed. Philadelphia, Pa: Soc. for Ind. and Appl. Math; 2000. [Google Scholar]
- Brown DL, Chesshire GS, Henshaw WD. Quinlan DJ. Overture: An object-oriented software system for solving partial differential equations in serial and parallel environments, Technical Report. Lab., N. M: Los Alamos Natl; 1997. [Google Scholar]
- Chen X, Hammond G, Murray C, Rockhold M, Vermeul V. Zachara J. Applications of ensemble-based data assimilation techniques for aquifer characterization using tracer data at Hanford 300 Area. Water Resour. Res. 2013;49:7064–7076. doi: 10.1002/2012WR013285. [Google Scholar]
- Chen XY, Murakami H, Hahn MS, Hammond GE, Rockhold ML, Zachara JM. Rubin Y. Three-dimensional Bayesian geostatistical aquifer characterization at the Hanford 300 Area using tracer test data. Water Resour. Res. 2012;48:W06501. doi: 10.1029/2011WR010675. [Google Scholar]
- Decyk VK, Norton CD. Szymanski BK. Expressing object-oriented concepts in Fortran 90. SIGPLAN Fortran Forum. 1997;16(1):13–18. doi: 10.1145/263877.263880. [Google Scholar]
- Falgout RD, Yang UM. In: Hypre: A library of high performance preconditioners, in Computational Science-ICCS 2002, Part III. Sloot PMA, et al., editors. Springer Berlin Heidelberg; 2002. pp. 632–641. LNCS 2331. [Google Scholar]
- Golub GH. Van Loan CF. Matrix Computations. 3rd ed. Baltimore, Md: Johns Hopkins Univ. Press; 1996. [Google Scholar]
- Greenbaum A. Iterative Methods for Solving Linear Systems. Philadelphia, Pa: Soc. for Ind. and Appl. Math; 1997. [Google Scholar]
- Guo LJ, Huang H, Gaston DR, Permann CJ, Andrs D, Redden GD, Lu C, Fox DT. Fujita Y. A parallel, fully coupled, fully implicit solution to reactive transport in porous media using the preconditioned Jacobian-Free Newton-Krylov Method. Adv. Water Resour. 2013;53:101–108. doi: 10.1016/j.advwatres.2012.10.010. [Google Scholar]
- Gwo JP, D'Azevedo EF, Frenzel H, Mayes M, Yeh GT, Jardine PM, Salvage KM. Hoffman FM. HBGC123D: A high-performance computer model of coupled hydrogeological and biogeochemical processes. Comput. Geosci. 2001;27(10):1231–1242. doi: 10.1016/s0098–3004(01)00027-9. [Google Scholar]
- Hackbusch W. Multi-Grid Methods and Applications, Springer Series in Computational Mathematics. Vol. 4. London: Springer; 1985. [Google Scholar]
- Hammond GE. Lichtner PC. Field-scale model for the natural attenuation of uranium at the Hanford 300 Area using high-performance computing. Water Resour. Res. 2010;46:W09527. doi: 10.1029/2009WR008819. [Google Scholar]
- Hammond GE, Valocchi AJ. Lichtner PC. Application of Jacobian-free Newton-Krylov with physics-based preconditioning to biogeochemical transport. Adv. Water Resour. 2005;28(4):359–376. [Google Scholar]
- Hammond GE, Lichtner PC. Rockhold ML. Stochastic simulation of uranium migration at the Hanford 300 Area. J. Contam. Hydrol. 2011;120–121:115–128. doi: 10.1016/j.jconhyd.2010.04.005. [DOI] [PubMed] [Google Scholar]
- Hammond GE, Lichtner PC, Lu C. Mills RT. PFLOTRAN: Reactive flow and transport code for use on laptops to leadership-class supercomputers, in. In: Parker JC, editor; Zhang F, Yeh G, editors. Groundwater Reactive Transport Models. Sharjah: Bentham Sci; 2012. pp. 141–159. [Google Scholar]
- Jones JE. Woodward CS. Newton-Krylov-multigrid solvers for large-scale, highly heterogeneous, variably saturated flow problems. Adv. Water Resour. 2001;24:763–774. [Google Scholar]
- Karypis G. Schloegel K. ParMETIS: Parallel Graph Partitioning and Sparse Matrix Ordering Library, Version 4.0. Minneapolis, Minn: Univ. of Minnesota, Dep. of Comput. Sci. and Eng; 2011. [Google Scholar]
- Keyes DE. Lai C-H, editor. How scalable is domain decomposition in practice? 1999. paper presented at the 11th International Conference on Domain Decomposition Methods, Domain Decomposition Press, Bergen, Norway.
- Kolditz O, et al. OpenGeoSys: An open-source initiative for numerical simulation of thermo-hydro-mechanical/chemical (THM/C) processes in porous media. Environ. Earth Sci. 2012;67(2):589–599. doi: 10.1007/s12665-012-1546-x. [Google Scholar]
- Kollet SJ. Maxwell RM. Integrated surface-groundwater flow modeling: A free-surface overland flow boundary condition in a parallel groundwater flow model. Adv. Water Resour. 2006;29(7):945–958. [Google Scholar]
- Kollet SJ, Maxwell RM, Woodward CS, Smith S, Vanderborght J, Vereecken H. Simmer C. Proof of concept of regional scale hydrologic simulations at hydrologic resolution utilizing massively parallel computer resources. Water Resour. Res. 2010;46:W04201. doi: 10.1029/2009WR008730. [Google Scholar]
- Kumar V, Grama A, Gupta A. Karypis G. Introduction to Parallel Computing: Design and Analysis of Algorithms. Calif: Benjamin-Cummings, Redwood City; 1994. [Google Scholar]
- Lee B. Guidance for choosing multigrid preconditioners for systems of elliptic partial differential equations. SIAM J. Sci. Comput. 2009;31(4):2803–2831. doi: 10.1137/070703636. [Google Scholar]
- Lichtner PC. In: Modeling reactive flow and transport in natural systems, in Proceedings of the Rome Seminar on Environmental Geochemistry. Ottonello G, Marini L, editors. Pisa, Italy: Castelnuovo di Porto May 22–26, Pacini Editore; 1996. pp. 5–72. [Google Scholar]
- Lichtner PC. FLOTRAN User's Guide: Two-Phase Nonisothermal Coupled Thermal–Hydrologic–Chemical (THC) Reactive Flow & Transport Code. Los Alamos Natl. Lab., LA-UR-01–2348. 2001 [Google Scholar]
- Lichtner PC. Hammond GE. Using high performance computing to understand roles of labile and nonlabile U(VI) on Hanford 300 Area plume longevity. Vadoze Zone J. 2012;120–121:115–128. [Google Scholar]
- Lu B. Wheeler MF. Iterative coupling reservoir simulation on high performance computers. Pet. Sci. 2009;6(1):43–50. doi: 10.1007/s12182-009-0008-x. [Google Scholar]
- McInnes LC, Smith B, Zhang H. Mills RT. Hierarchical Krylov methods and nested Krylov methods for extreme-scale computing. Parallel Comput. 2013 doi: 10.1016/j.parco.2013.10.001, in press. [Google Scholar]
- Mills RT, Hammond GE, Lichtner PC, Sripathi V, Mahinthakumar G. Smith BF. Modeling subsurface reactive flows using leadership-class computing, paper presented at the 5th Annual Conference of Scientific Discovery through Advanced Computing (SciDAC 2009) J. Phys. Conf. Ser. 2009;180 doi: 10.1088/1742–6596/180/1/012062. [Google Scholar]
- Mills RT, Sripathi V, Mahinthakumar G, Hammond GE, Lichtner PC. Smith BF. Engineering PFLOTRAN for scalable performance on Cray XT and IBM BlueGene architectures. 2010. Proceedings of the SciDAC 2010 Annual Meeting, Chattanooga, Tenn.
- Minden V, Smith B. Knepley M. Preliminary implementation of PETSc using GPUs. 2010. paper presented at the 2010 International Workshop of GPU Solutions to Multiscale Problems in Science and Engineering, Supercomputing Center of Computer Network Information Center, Chinese Academy of Sciences (CAS) in Beijing, the Graduate University of CAS, and the Chinese Society of Theoretical and Applied Mechanics, Harbin, China.
- Navarre-Sitchler AK, Maxwell RM, Siirila ER, Hammond GE. Lichtner PC. Elucidating geochemical response of shallow heterogeneous aquifers to CO2 leakage using high-performance computing: Implications for monitoring of CO2 sequestration. Adv. Water Resour. 2013;53:45–55. doi: 10.1016/j.advwatres.2012.10.005. [Google Scholar]
- Nowak T, Kunz H, Dixon D, Wang WQ, Goerke UJ. Kolditz O. Coupled 3-D thermo-hydro-mechanical analysis of geotechnological in situ tests. Int. J. Rock Mech. Min. Sci. 2011;48(1):1–15. doi: 10.1016/j.ijrmms.2010.11.002. [Google Scholar]
- Oral HS, Wang F, Dillow DA, Miller RG, Shipman GM, Maxwell DE, Becklehimer JL, Larkin JM. Henseler D. Reducing application runtime variability on Jaguar XT5. 2010. paper presented at the 2010 Cray Users Group Conference, Cray User Group, Edinburgh, Scotland.
- Petrini F, Kerbyson DJ. Pakin S. The case of the missing supercomputer performance: Achieving optimal performance on the 8,192 processors of ASCI Q. 2003. paper presented at the 2003 ACM/IEEE Conference on Supercomputing, SC '03, New York ACM55doi: 10.1145/1048935.1050204.
- Reynders JV, Hinker PJ, Cummings JC, Atlas SR, Banerjee S, Humphrey WF, Karmesin SR, Keahey K, Srikant M, Tholburn MD. POOMA: A framework for scientific simulations on parallel architectures. In: Wilson V. Gregory, Paul Lu., editors. Parallel Programming in C++ Cambridge, Mass: MIT Press; 1996. pp. 547–588. chap. 16. [Google Scholar]
- Smith B, McInnes LC, Constantinescu E, Adams M, Balay S, Brown J, Knepley M. Zhang H. PETSc's software strategy for the design space of composable extreme-scale solvers, Preprint ANL/MCS-P2059-0312, Argonne Natl. Lab. 2012. DOE Exascale Research Conference, ortland, Oreg, 16-18Apr.
- Sripathi V. Performance analysis and optimization of parallel I/O in a large scale groundwater application on petascale architectures. Raleigh, N. C: North Carolina State Univ; 2010. Master's thesis. [Google Scholar]
- The HDF Group. 2012. HDF5-1.8.9 [Available at www.hdfgroup.org/HDF5.]
- Tompson AFB, Falgout RD, Smith SG, Bosl WJ. Ashby SF. Analysis of subsurface contaminant migration and remediation using high performance computing. Adv. Water Resour. 1998;22(3):203–221. [Google Scholar]
- Trottenberg U, Oosterlee CW. Schüller A. Multigrid. New York: Elsevier; 2001. [Google Scholar]
- US DOE. NEAMS: Nuclear Energy Advanced Modeling & Simulation Program. 2013. Available at http://energy.gov/ne/nuclear-reactor-technologies/advanced-modeling-simulation.]
- VisIt. VisIt User's Manual, Version 1.5. 2005. Available at https://wci.llnl.gov/codes/visit.]
- White MD, Oostrom M, Rockhold ML. Rosing M. Scalable modeling of carbon tetrachloride migration at the Hanford site using the STOMP simulator. Vadose Zone J. 2008;7(2):654–666. doi: 10.2136/vzj2007.0070. [Google Scholar]
- White SP, Creighton AL, Bixley PE. Kissling WM. Modeling the dewatering and depressurization of the Lihir open-pit gold mine. Papua New Guinea, Geothermics. 2004;33(4):443–456. doi: 10.1016/j.geothermics.2003.09.011. [Google Scholar]
- Wu YS, Zhang KN, Ding C, Pruess K, Elmroth E. Bodvarsson GS. An efficient parallel-computing method for modeling nonisothermal multiphase flow and multicomponent transport in porous and fractured media. Adv. Water Resour. 2002;25(3):243–261. [Google Scholar]
- Yabusaki SB, Fang YL, Williams KH, Murray CJ, Ward AL, Dayvault RD, Waichler SR, Newcomer DR, Spane FA. Long PE. Variably saturated flow and multicomponent biogeochemical reactive transport modeling of a uranium bioremediation field experiment. J. Contam. Hydrol. 2011;126(3–4):271–290. doi: 10.1016/j.jconhyd.2011.09.002. [DOI] [PubMed] [Google Scholar]
- Yamamoto H, Zhang K, Karasaki K, Marui A, Uehara H. Nishikawa N. Numerical investigation concerning the impact of CO2 geologic storage on regional groundwater flow. Int. J. Greenhouse Gas Control. 2009;3(5):586–599. [Google Scholar]
- Zhang K, Wu YS. Bodvarsson GS. Parallel computing simulation of fluid flow in the unsaturated zone of Yucca Mountain, Nevada. J. Contam. Hydrol. 2003;62–63:381–399. doi: 10.1016/s0169-7722(02)00159-6. [DOI] [PubMed] [Google Scholar]


