Abstract
The MITOMAP database of human mitochondrial DNA (mtDNA) information has been an important compilation of mtDNA variation for researchers, clinicians and genetic counselors for the past twenty-five years. The MITOMAP protocol shows how users may look up human mitochondrial gene loci, search for public mitochondrial sequences, and browse or search for reported general population nucleotide variants as well as those reported in clinical disease. Within MITOMAP is the powerful sequence analysis tool for human mitochondrial DNA, MITOMASTER. The MITOMASTER protocol gives step-by-step instructions showing how to submit sequences to identify nucleotide variants relative to the rCRS, to determine the haplogroup, and to view species conservation. User-supplied sequences, GenBank identifiers and single nucleotide variants may be analyzed.
Keywords: biological database, information retrieval, human mitochondrial DNA, haplogroups, species conservation, GenBank sequences, single nucleotide variants
Introduction
The MITOMAP database of human mitochondrial DNA (mtDNA) information has been an important resource for information about the human mitochondrial DNA (mtDNA) for researchers, clinicians and genetic counselors for the past twenty-five years. Essential information about the mitochondrial reference sequence is provided along with an extensive compilation of mtDNA variants. The MITOMAP curators search research literature for published reports of mitochondrial DNA variants and index those variants in the database. Those variants which are reported as having possible association with disease are noted. A new addition to MITOMAP is the inclusion of data from full-length human mtDNA sequences in GenBank.
The MITOMAP protocol section shows how users may look up human mitochondrial gene loci, search for public mitochondrial sequences, and browse or search for reported general population nucleotide variants as well as those reported in clinical disease. Within MITOMAP is the powerful sequences analysis tool for human mitochondrial DNA, MITOMASTER.
The MITOMASTER protocol section gives step-by-step instructions showing how to submit sequences to identify nucleotide variants relative to the rCRS, to determine the haplogroup, and to view species conservation. User-supplied sequences, GenBank sequences and single nucleotide variants may be analyzed.
Basic Protocol 1: Exploring mtDNA Variants with MITOMAP
The MITOMAP database can be accessed at http://www.mitomap.org (Figure 1).
Figure 1. The home page of www.mitomap.org.
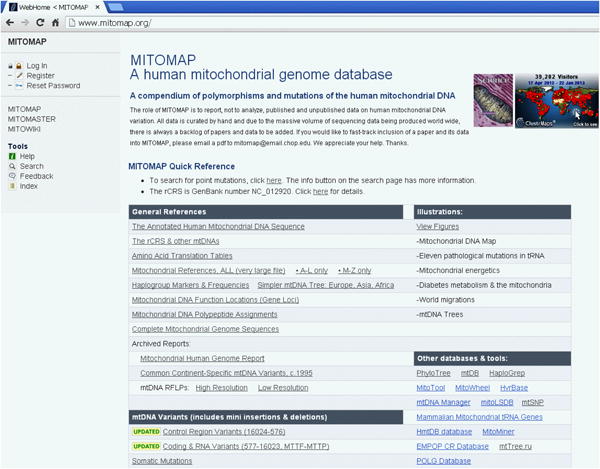
MITOMAP consists of three main sections: 1) Background information about the human mitochondrial DNA; 2) An annotated listing of mtDNA variants, both general population and patient; and 3) The MITOMASTER analysis tool (Basic Protocol 2).
Necessary Resources
Hardware
Internet connection
Software
An up-to-date web browser such as Firefox, Chrome, Safari, or Internet Explorer (version 9 or higher)
MITOMAP's Background Information about Human Mitochondrial DNA
Access the MITOMAP database at http://www.mitomap.org. Several pages of important background information are available, shown in Figure 2.
-
Click on Link1, The Annotated Human Mitochondrial DNA Sequence (Figure 3) to find the information about the revised Cambridge reference sequence (Andrews et al., 1999) and the sequence itself.
This is critical information because for many years researchers mistakenly used either the original but outdated version of the reference sequence (Anderson et al., 1981) or an African Yoruban sequence which was listed as the primary reference sequence in GenBank for several years (AF347015 / formerly RefSeq NC_001807.4). Use of the Yoruban sequence on DNA sequencing chips has often resulted in confusion and, occasionally, misinterpretation of data.
Click on Link 2, The rCRS & other mtDNAs (Figure 4) to go to a companion page where you will find the version history of the rCRS, links to other representative mtDNA sequences from different continental populations as well as search tools to retrieve full length mtDNA sequences from GenBank.
Click on the “search for complete human mtDNAs in GenBank” link (Figure 4, red arrow) to retrieve sequences with a minimum length of 15400 bp and a maximum of 16600 bp.
Click on the link “complete eukaryote (non-human) genomes in GenBank: (Figure 4, blue arrow) to retrieve mtDNA sequences of other species. In February 2013, these searches returned 17851 full-length human mitochondrial DNA sequences and 9608 complete non-human mitochondrial DNA sequences.
Click on Link 3, Amino Acid Translation Table (Figure 5) to take you to the human mitochondrial genetic code, with important notes as to the differences between it and the nuclear genetic code.
Click on Link 4, Mitochondrial References to browse a library of the ∼5000 publications indexed by the Mitomap curators, with links to PubMed.
Select Link 5, Haplogroup Markers and Frequencies to reach background haplotyping information (Figure 6-7). Helpful maps of world migrations and haplogroup relationships are located nearby (Figures 8-9).
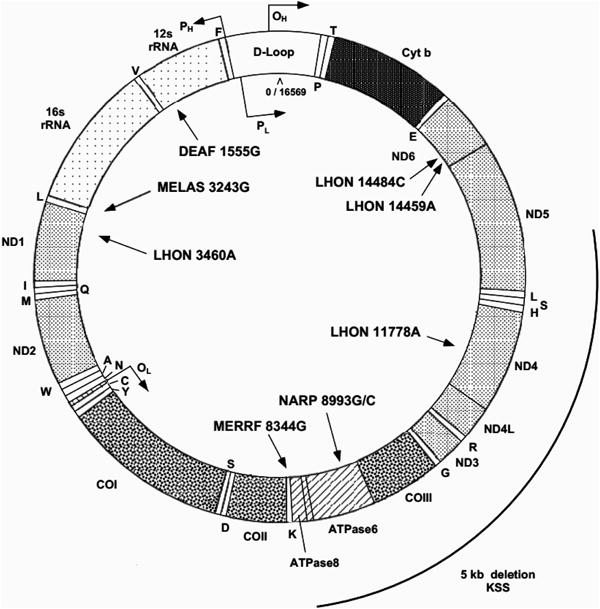
Click on Mitochondrial DNA Function Locations (Link 6) to pull up delineated positions of gene loci (Figure 10). Mitomap's classic map of loci with selected pathological DNA variants is available in the adjacent section of illustrations (Figure 11).
Figure 2. Essential mtDNA Background Information.
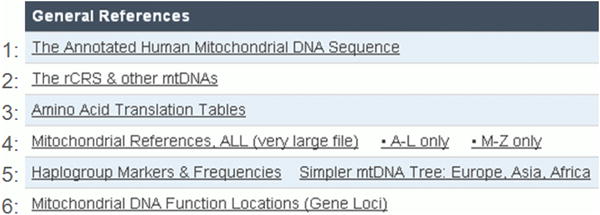
Figure 3. The rCRS.
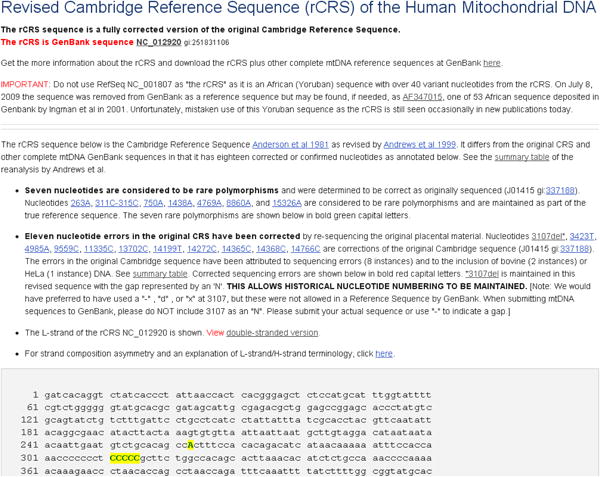
Figure 4. Complete Mitochondrial DNA Sequences.
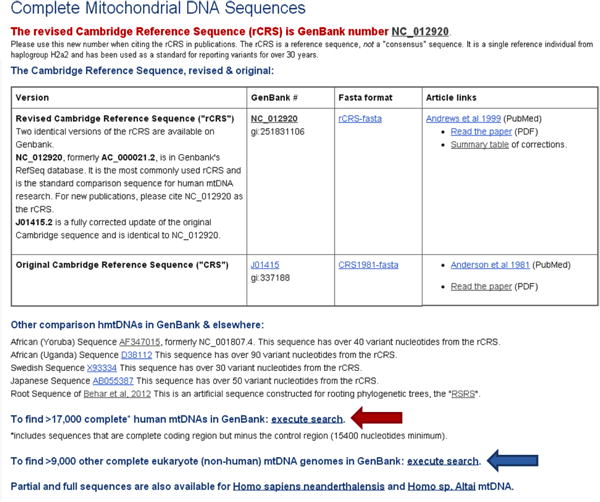
Figure 5. The mitochondrial genetic code.
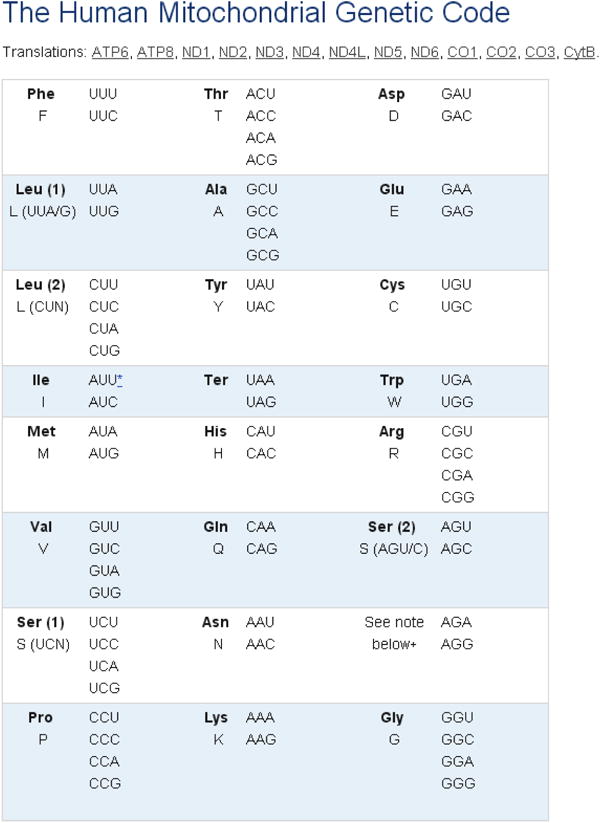
Figure 6. Haplogroup Frequency Estimates.
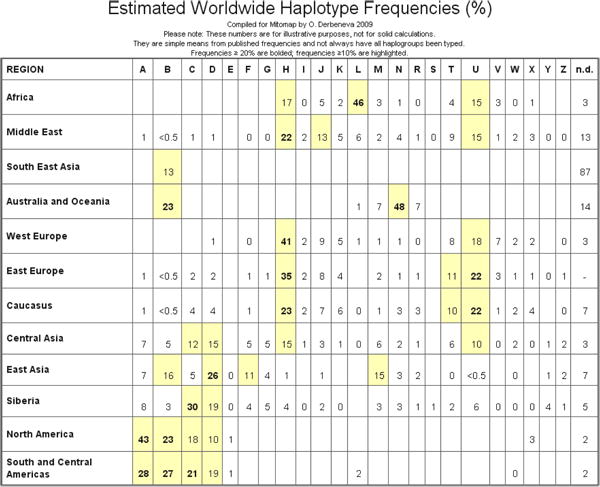
Figure 7. Diagnostic RFLP and SNPs for Major Haplogroups.
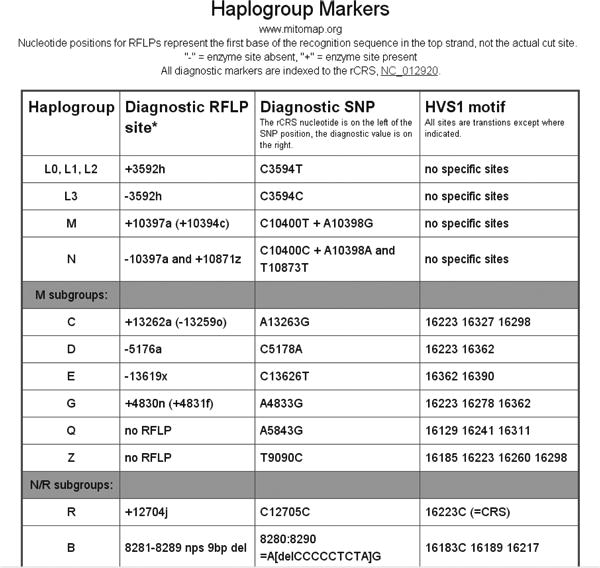
Figure 8. mtDNA Haplogroup Migration Map.
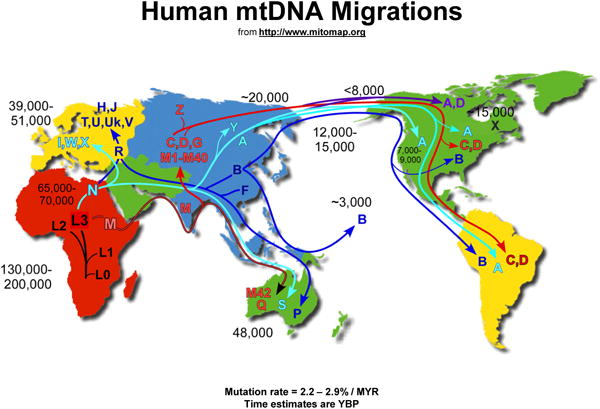
Figure 9. Simplified Mitochondrial Haplogroup Relationships.
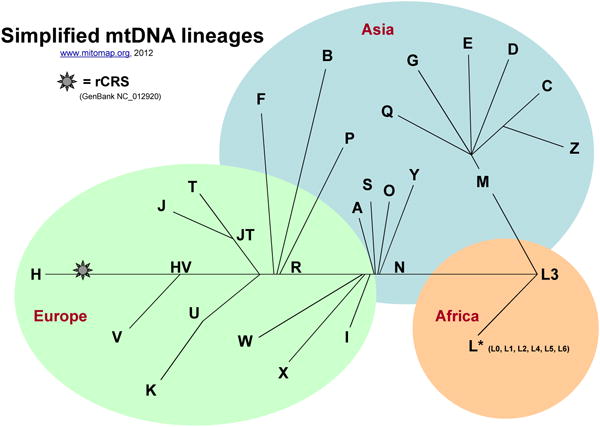
Figure 10. Mitochondrial Functional Locations.
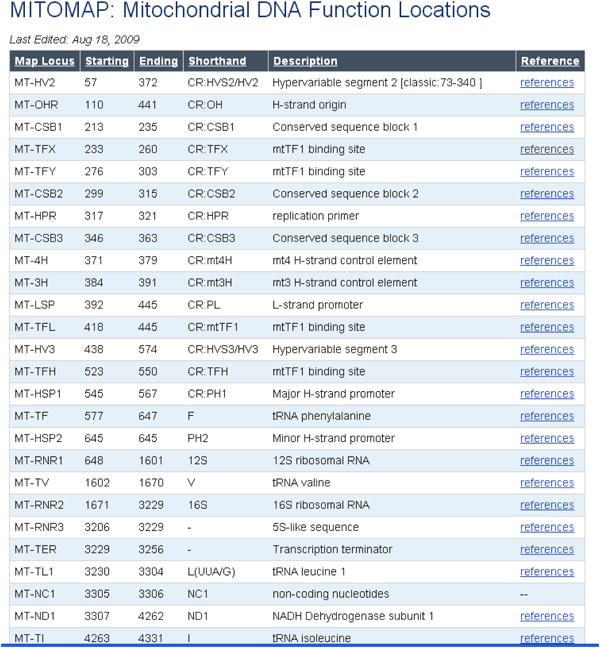
Figure 11. Gene map of the human mitochondrial DNA with representative disease variants shown.
Human Mitochondrial DNA Variants
-
10
An extensive database of published mitochondrial DNA variants is available. These can be searched (Figure 12a, http://www.mitomap.org/bin/view/Main/SearchAllele) or browsed (Figure 13).
-
11
To search for variants,
Figure 12a.

Search box for specific variant(s).
Figure 13.
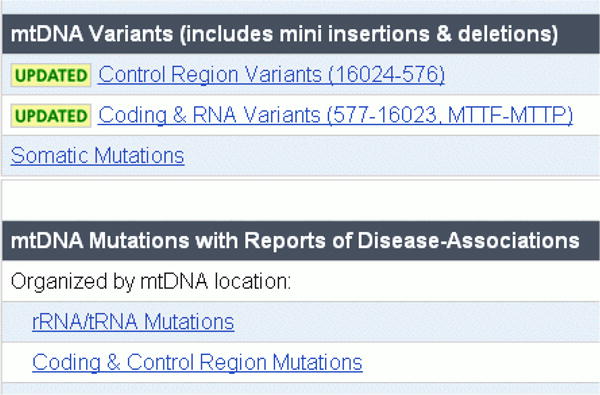
Links to MITOMAP Variants. Variants are organized into two categories – general variants (top section) and those with reports of possible disease-associations (lower section).
Locate the bulleted “to search for point mutations, click here” link in the “Mitomap Quick Reference” section near the top of the MITOMAP home page (Figure 12a). Click “here” to open the Allele Search box (Figure 12b).
Enter
Figure 12b.

Search box for specific variant(s). In this example, a single position is queried.
a single nucleotide position in the “Start” box or
a range of up to 100 nucleotides by also entering a position number in the “End” box.
-
12
Click the “Search” button. Results will return as a listing of reported variants and their references as seen in Figure 12c.
Figure 12c.
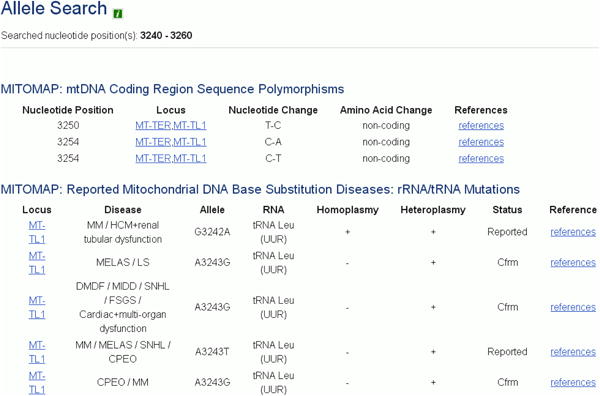
Results for variant search. In this example, a range was queried. This screenshot shows only a portion of the results returned.
Population Variants
-
13
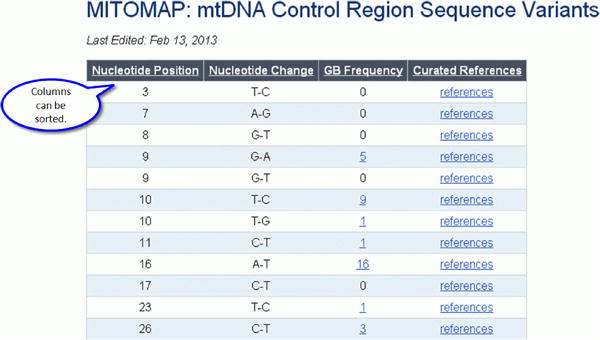
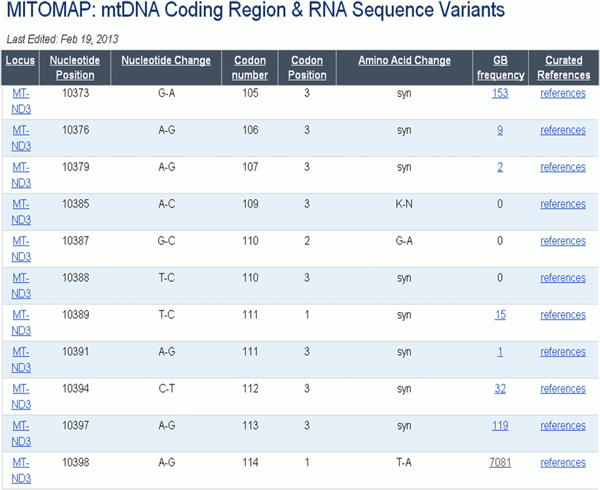
There are two links for Control Region Variants and Coding/RNA Variants. Information is listed for nucleotide position, rCRS nucleotide, variant nucleotide, and, for coding region variants, amino acid change and codon position.
Click on the link Control Region Variants (16024-576) to find variants located between tRNA Proline and tRNA Phenylalanine.
-
Click on the link Coding & RNA Variants (577-16023, MTTF-MTTP) to find variants located in the region including the beginning of tRNA Phenylalanine through the end of tRNA Proline.
New for 2013 is the frequency of each variant in a large set of over 18,000 human mitochondrial DNA sequences from GenBank. These sequences have a minimum length of 15.4 kb and are extracted from GenBank on a quarterly basis.
-
14
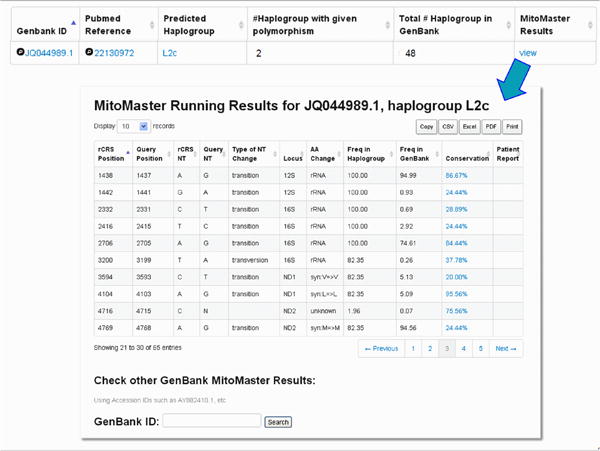
Click on the GB set frequency for a given variant to retrieve a listing of sequences which contain the variant of interest (Figure 16) and the relevant Pub Med reference. In addition, MITOMAP's companion analysis tool MITOMASTER (detailed in Protocol 2) predicts haplogroup for each sequence, calculates the number of different haplogroups seen carrying this variant, and displays the total number of each haplogroup found in the GenBank set of sequence. Clicking on each ID and haplogroup yields more information (Figures 16-20). Haplotyping is based on Phylotree (van Oven and Kayser, 2009) and is generated by MITOMASTER using the Haplogrep engine (Kloss-Brandstatter et al., 2011).
Figure 16. Details of GB set frequency.
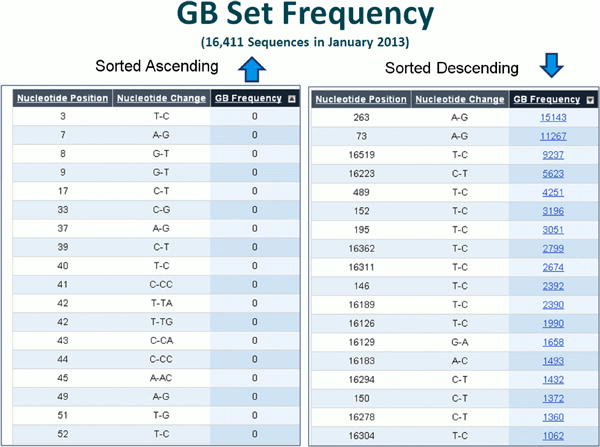
Figure 20. MITOMASTER analysis report on each sequence.
Patient Variants
-
15
To locate information about reported mtDNA variation in patients click on one of the links listed in the section “mtDNA Mutations with Reports of Disease-Associations”, shown in Figure 13.
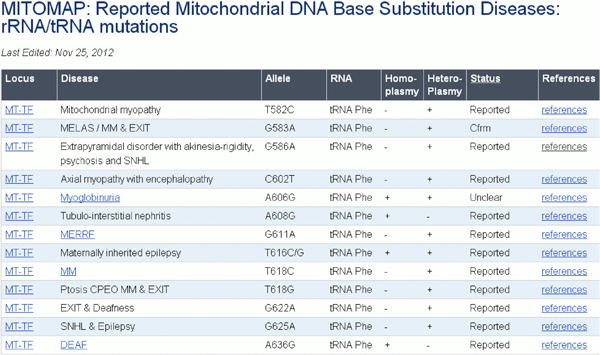
Variants reported as having possible association with disease are grouped into two categories: those found in the Coding or Control Region (Figure 21) and those found in the mitochondrial rRNA or tRNA loci (Figure 22). In addition to the same information presented in the population variant tables, reports of heteroplasmy are indicated as well as a general category of pathogenicity. A pathogenic status of “Reported” indicates that a publication has considered the mutation as possibly pathologic. A status of “Cfrm” (confirmed) indicates that several independent laboratories have published strong evidence of the pathogenicity of a specific mutation. These mutations are generally accepted by the mitochondrial research community as being pathogenic.
Figure 21. Reported Coding and Control Region mutations found in patients.
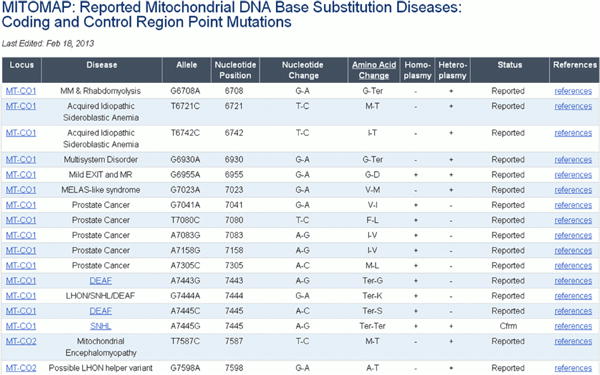
Figure 22. Reported rRNA and tRNA mutations found in patients.
Basic Protocol 2: Analyzing mtDNA Variants with MITOMASTER
Mitochondrial sequence analysis typically begins with specialized mitochondrial SNP genotyping microarrays, using Sanger-based capillary sequencing, or various forms high-throughput sequencing. MITOMASTER is designed to accommodate output from each of three strategies. Small batches of sequence can be “copy-and-pasted” into a text field or uploaded from FASTA-formatted files. Query by GenBank ID is available for individual or multiple record numbers. Single nucleotide variants, identified by microarray, can be submitted using the SNV Query tab.
Necessary Resources
Hardware
Internet connection
Software
An up-to-date web browser - MITOMASTER is optimized for Firefox, Chrome, or Safari. If Internet Explorer is used, it must be version 9 or higher.
Files
Your data of interest, either as a FASTA file (such as sequence.fasta, downloaded in this protocol) or as a text file from which you can copy and paste
Sequence Query Walk-Through
Navigate to http://www.ncbi.nlm.nih.gov/nuccore/EU915478. This sequence, a full length mitochondrial sequence, can demonstrate some of the features (Figure 23):
-
Click on the “Send” popup dialog link in the upper right of the main section of the sequence record. Select “File” as a destination and FASTA as a format (Figure 24).
The file will be saved to your local drive as “sequence.fasta” in your default download folder. Make a note of this folder location. For details of the FASTA format, see http://www.bioinformatics.nl/tools/crab_fasta.html.
-
Navigate to http://mitomaster.mitomap.org/. This is also accessible as a frame within the MITOMAP website at http://mitomap.org/MITOMASTER. You may also use the MITOMASTER link on the left menu of the MITOMAP home page.
Please note that currently the only browsers supported are Chrome, Mozilla, Firefox, and Internet Explorer 9 or higher.
By default the “Sequence” tab in the top menu is selected (Figure 25).
Skip Step 1 for now. We will discuss this feature later in the walk-through. By default, 45 species are selected for comparison.
Click “Select File” in Step 2, Option 1 and navigate to the ‘sequence.fasta’ file which you downloaded earlier.
Click “Submit”. The Alignment Summary page (Figure 26) is then shown after the sequence is processed:
Figure 23. Sample Sequence EU915478 at GenBank.
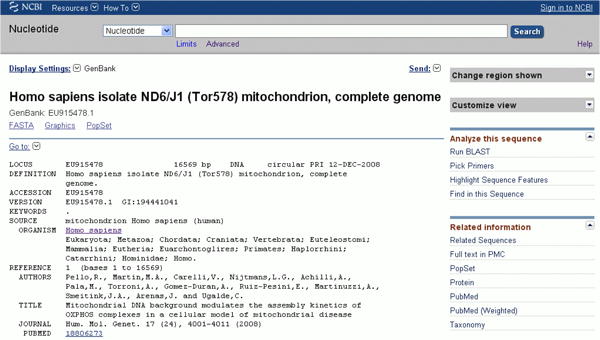
Figure 24. Send FASTA dialog box.
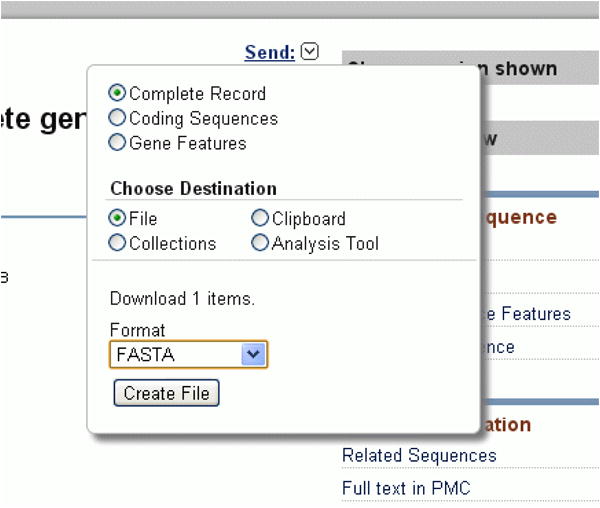
Figure 25. Submit Sequence screen.
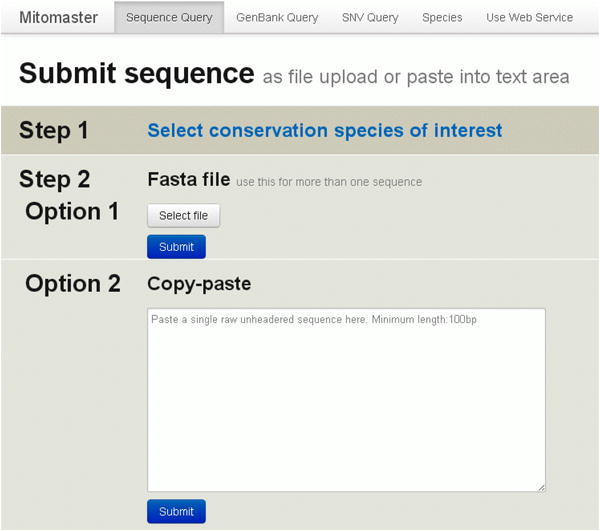
Figure 26. Alignment Summary.
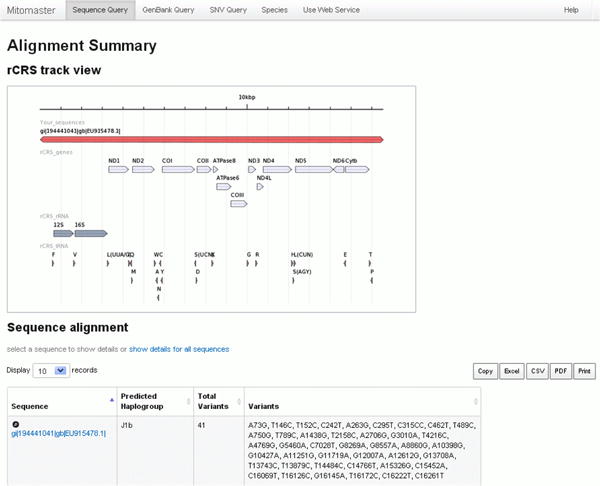
There are two portions to the Alignment Summaryscreen:
rCRS track view
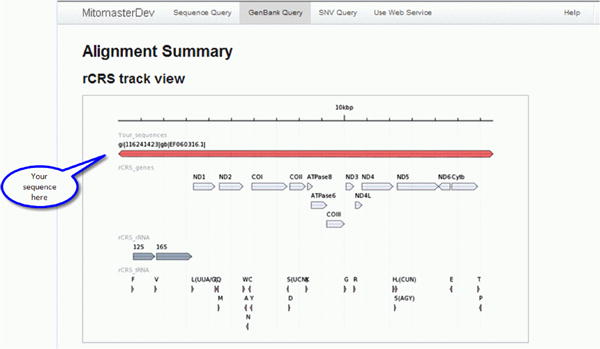
The rCRS track view shows the coverage of the query sequence with respect to the rCRS reference sequence. The example sequence EU915478, indicated by a bar at the top of the screen, displays complete coverage. This is expected as it is a full-length sequence. Tracks below the query sequence correspond to the locations of protein coding genes, ribosomal RNAs, and transfer RNAs.
Sequence alignment
For each query sequence analyzed you will find (1) the predicted haplogroup as calculated by HaploGrep, (2) the total number of variants relative to the rCRS, and (3) a condensed list of the variants observed. In the example given (Figure 28, circled in blue), the predicted haplogroup is J1b, the total number of variants detected is 41, with a summary listed in the right-most column.
Figure 28. Sequence Alignment, areas of interest circled.

-
7
Next, click on the sequence name to bring up the Alignment Details page (Figure 29). In the example above, you will click on “gi|194441041|gb|EU915478.1” (Figure 28, blue arrow). The sequence name is taken from the first line of the ‘sequence.fasta’ file. After clicking on the sequence name, the Alignment Details page will open (Figure 29).
The Alignment Detail page (Figure 29) shows the rCRS reference position, the query sequence position, the reference base and query base with respect to the L-strand of the rCRS (NC_012920). The mutation type (substitution type or indel type), the locus or loci intersected, and the predicted transcript effect, if any.
-
8
The amount of information displayed can be adjusted with the drop-down menu at the top, ‘Display 10 records’. The default value is 10 records per page, but more records (25, 50, 100 or “All”) can be selected.
-
9
Each column can be sorted by clicking the column headers. To explore the data columns, first click on the header “Patient Report” twice to sort descending (Figure 30).
In Figure 30, the Patient Report column shows variants in this sequence which have been published in the literature as possibly having some disease association in patients with Leber Hereditary Optic Neuropathy (LHON), cyclic vomiting and AD/PD. Do not assume that a listing of a published patient report is a confirmation of a variant's disease association. In this screenshot, 14484C is a well known LHON mutation; however, 3010A is a relatively common variant, found in 17% of all sequences in the mined GenBank set (currently numbering over 18,000) and in 98% of haplogroup J1b sequences. Please read more in the Commentary section about interpreting disease reports.
-
10
For coding mutations, a Conservation value is calculated based on the user's initial selection of species. By default, 45 species are used.
Figure 29. Alignment Detail.
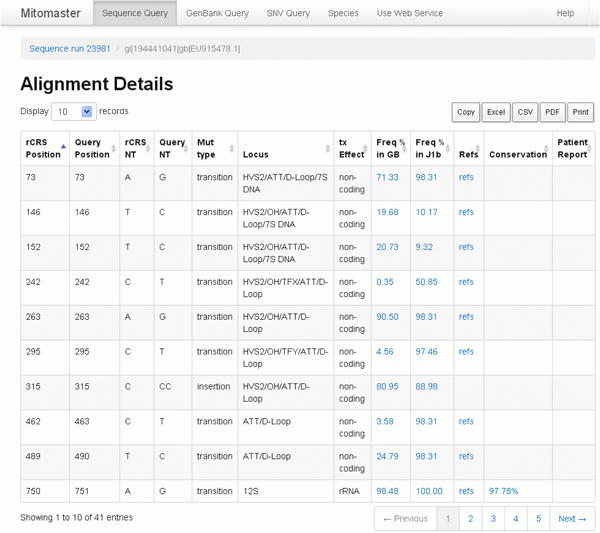
Figure 30. Alignment Details, areas of interest circled.
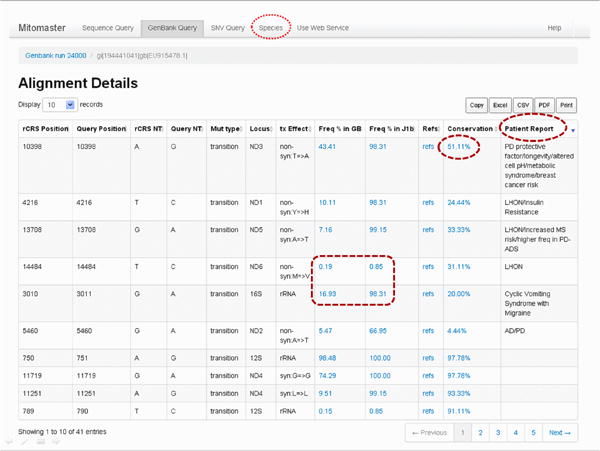
To explore this, select the first Conservation value (51.11%, circled in red dashes in the above figure).
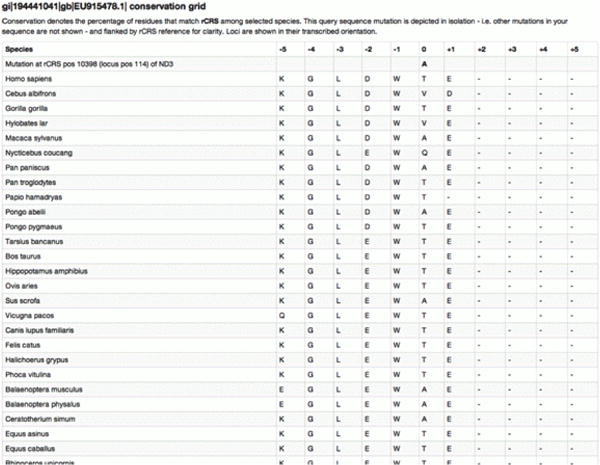
Open this blue ‘51.11%’ link in a new tab or window by right-clicking if using a PC or control-clicking if using a Mac. This will open the Conservation Grid (Figure 31A). Keep this window or tab open.
Figure 31A. Conservation Grid.
-
11
Also open the Species link found in the top menu bar (Figure, 30, circled in red dots) in a new tab. Keep this window or tab open as well.
-
12
First, let's examine the Conservation Grid (Figure 31A). Amino acid conservation is shown for genic mutations. Note the query sequence has an ‘A’ residue while rCRS has a ‘T’ residue. Finally, 23 of the 45 species (51.11%) have the ‘T’ residue at that position – note this is the fraction which matches the rCRS value, not the query residue.
-
13
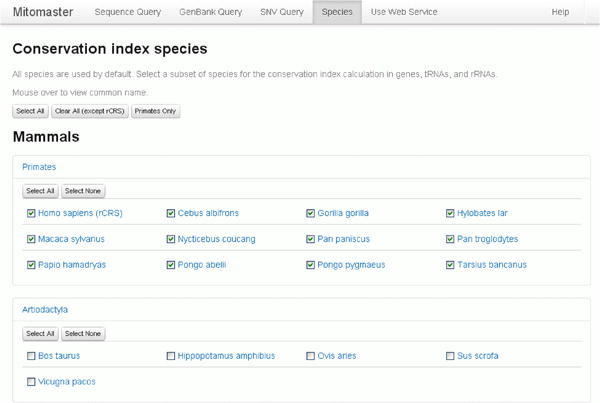
Now examine the “Species Selection” tab or window (Figure 31B). Species are subcategorized into checkbox groups. Users select which species are used in the conservation index calculations.
-
14
As an example, click on both “Primates” and “Artiodactyla” to open the drop-down view of the contents of these two categories. You many move your mouse to hover over any genus/species name to view the common name. Click each category name again to close the drop downs.
-
15
Another popular selection option is to use the “Select All”, “Clear All” or “Primates Only” at the top of the page.
-
16
Click on “Primates Only” – the change in selected species is instant. Subsequent queries will use this subset of 12 primate species only.
Figure 31B. Conservation Grid of Species.
GenBank queries
-
17
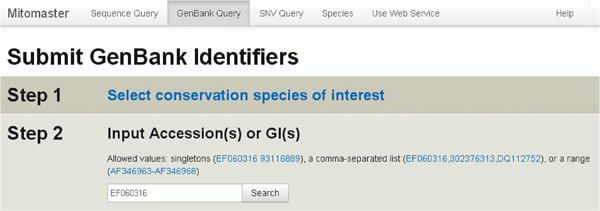
To aid basic research, Mitomaster offers one-step analysis of any human mitochondrial sequences stored in GenBank — 104,705 sequences at the time of this publication (17,869 sequences 15.40kb-16.66kb in length plus another 86,836 sequences less than 15.4 kb). One or more GenBank sequence identifiers can be used as query parameters; Mitomaster fetches these sequences using the NCBI web service and returns reports. Acceptable inputs are single GenBank accession number or GI sequence identifier (e.g., EF060316 or 93116889), a comma-separated list of identifiers with or without intervening spaces (e.g., EF060316, 302376313, DQ112752 or EF060316,302376313,DQ112752), or a range of sequence numbers (AF346963-AF346968). Data reports are produced as described earlier in walk-through of the FASTA sequence analysis. (Figure 32)
Figure 32. Submitting GenBank Identifiers.
SNV submission
-
18
Single Nucleotide Variants can be analyzed alone, without the need of a complete sequence. Data reports are produced as described earlier in walk-through of the FASTA sequence analysis.
Single Nucleotide Variants can be formatted the following ways and may either be pasted into the “copy/paste” window or uploaded as a text file (Figure 33).
Figure 33. Single Nucleotide Variant Submission.
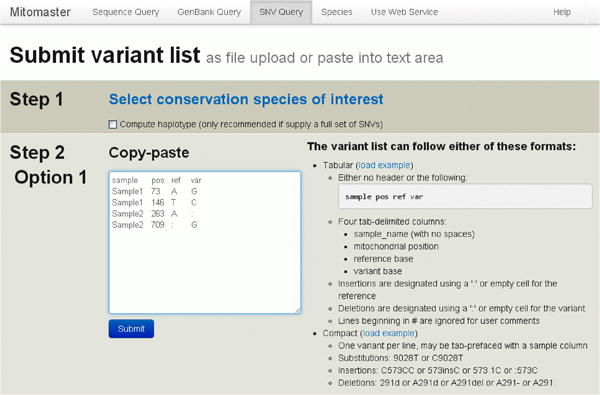
a. A four-column tab-delimited format consisting of sample name, rCRS mitochondrial position, reference base, and query base (“sample pos ref var”).
| With header row | Without header row | ||||||
|---|---|---|---|---|---|---|---|
| Sample | pos | ref | var | Sample1 | 73 | A | G |
| Sample1 | 73 | A | G | Sample1 | 146 | T | C |
| Sample1 | 146 | T | C | Sample2 | 263 | A | : |
| Sample2 | 263 | A | : | Sample2 | 709 | : | G |
| Sample2 | 709 | : | G | ||||
b. A more compact non-delimited reference-position-query format is also permitted, with or without sample names.
| With sample names | Without sample names | Without rCRS value | |
|---|---|---|---|
| Sample1 | A73G | A73G | 73G |
| Sample2 | T146C | T146C | 146C |
c. Indels can be represented using the adjacent-base notation (C573CC) or with the use of decimal positions (573.1C), explicitly (573insC), or using dash or colon symbols (:573C).
| With sample names | Without sample names | Explicit/decimal format | -/: format | |
|---|---|---|---|---|
| Sample123 | A263d | A263d | 263delA | A263- |
| Sample456 | C573CCC | 573CC | 573.1insC | :573C |
Guidelines for Understanding Results
With the recent explosion of sequence data, MITOMAP has found it necessary to augment the hand-curated portion of the database with mined sequence data from GenBank. The new GenBank frequency data is derived from sequences with size equal to or larger than the complete coding region. These sequences have been pre-loaded into MITOMASTER and represent almost all haplogroups known to date. As of August 2013 this data set contained over 18000 sequences. The size of the sequence set is expected to increase with quarterly scans of GenBank and possibly other public sequence repositories. Please keep in mind that pre-loaded sequences from GenBank have not been individually reviewed by MITOMAP.
GenBank sequences may not be of equal quality (Yao et al., 2009). Published results may have sequencing errors, partial data, and analysis mistakes that, even if corrected, still might not be downloadable as a corrected sequence directly from GenBank and might only be found as published erratum to the corresponding publications.
When considering the frequency of any particular variant in GenBank, understand that the numbers are not the true worldwide frequency but are only a reflection of the actual sequences currently collected. Many populations in the world are under-represented in sequence repositories due to remote location and economics. Some sequences in public databases are occasionally duplicated with different record numbers and therefore do not represent unique individuals. Also, multiple sequences might be from closely related family members with identical mitochondrial DNA.
More and more sequences from patients with known or suspected mitochondrial disease are now being banked in public databases. It is important to keep in mind that any human mitochondrial sequence has the potential to contain variants relevant to past, current or future disease. This is especially true in the case of diseases which develop later in life or after particular environment stressors and thus might not be evident in an individual at the time of sequencing.
COMMENTARY
Background Information
MITOMAP had its beginnings as a 1994 report to the Human Genome Committee, appearing in print form in 1995 (Wallace et al., 1995). This was the first attempt to record and document all published human mitochondrial DNA variation in the general population as well as summarizing continent-specific and disease-specific variants. It also served as a unified reference for human mitochondrial gene loci. MITOMAP was first launched as an online mtDNA database in 1996 and has been an essential tool for genetic researchers, counselors, and clinicians ever since. With its well-documented and hand-curated dataset, MITOMAP allows users to browse or search for reported mtDNA variants from both the general and clinical disease populations.
Critical Parameters
Alignment and Positional Caveats
Mitomaster uses a standard pair-wise BLAST local alignment to determine substitutions and mismatches. A local alignment will only include subsequences to achieve optimal alignment given a set of parameters, and so areas of extreme dissimilarity will be unaligned and no results will be given. This can result in truncated alignments or alignments composed of discontinuous high-scoring pairs. The genome viewer on the summary page shows the portion of the rCRS reference covered by the query sequence.
Calculation of a mutation's effect is done on an individual basis, isolated from any potential interactions of other mutation events within the query sequence. For instance, an insertion followed closely by a deletion within a protein coding gene would result in both being reported as independent frameshift mutations.
Also, be aware that insertions and deletions in regions of nucleotide polytracts (for example, “ACCCCCT”) are often reported using different conventions. Some publications list the insertion/deletion point at the beginning of nucleotide run, some at the end. Further complications arise in repetitive polytract regions (for example “CCCCCTCTACCCCCTCTAG”). This will often result in inaccurate sequence frequency numbers when MITOMASTER scans published indel reports for matches with GenBank sequences.
Large Data Sets
Large data sets may take a long time to process in MITOMASTER depending upon the number of FASTA files submitted and the server load at the time of submittal. To allow high-throughput sequence analyses using programmatic scripts, a web service utility is provided. This service is for use by programmers and database support personnel. Data may be submitted in large file batches (e.g., 100 or more sequences) to the MITOMASTER web service via script clients to programmatically submit queries using a simple POST mechanism. Sample client scripts in Perl and Python are provided on the MITOMASTER site. Input is by FASTA file, and output is in a tab-delimited text format with similar content as delivered on the interactive web application.
Pathogenicity Cautions
Mitochondrial DNA is highly variable in and between populations. New variants will continue to be discovered as more and more sequencing studies are performed. It is possible that some sporadic mutations as well as known haplogroup-defining or polymorphic variants might be involved in a disease, but to make any conclusions concerning pathogenicity, more evidence and data analyses are required. Caution is advised when using the listing of mtDNA variants found in patient groups. A status of “Confirmed” (“Cfrm”) in MITOMAP is not an assignment of pathogenicity but is a general consensus of what is reported in published literature. Researchers and clinicians are advised that additional data, searches of other databases, and/or analyses are usually required to confirm the pathological significance of some of these mutations. Such due diligence will also reduce the number of false reports of “novel” and “pathogenic” mtDNA variants in the literature.
Haplogroups
Haplogroup definition, while in some cases possible on a truncated sequencing data set, is best done using a complete mtDNA sequence. Caution is advised against popular “allelic” analysis approach where a researcher is only looking at a single nucleotide variant in relation to a disease phenotype. This approach is not directly applicable to mtDNA analysis. There are sets of different variants that are linked together and define mtDNA highly hierarchical phylogeny and haplogroup assignments. Some variants are polymorphic and could be found in many different mitochondrial lineages on different haplogroup backgrounds, some could be haplogroup-defining and rarely found anywhere else, while there are variants that are haplogroup-defining and polymorphic at the same time. The latter variants could be pathogenic on a different (non-defining) haplogroup background or in a different environment, but be non-pathogenic in their defining haplogroup. Thus they might occasionally be found in MITOMAP as being listed in both the polymorphism table and the disease table. Ethnic, geographical, and historic factors can also come into play when attempting to correlate a haplogroup with a medical condition.
Figure 14a.
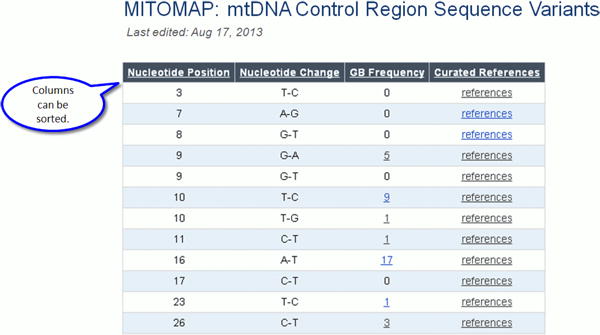
Control Region Variants.
Figure 14b.
Outside of the Control Region: Coding and RNA Variants.
Figure 15.
Variant information can be sorted.
Figure 17. GenBank ID links to sequence.
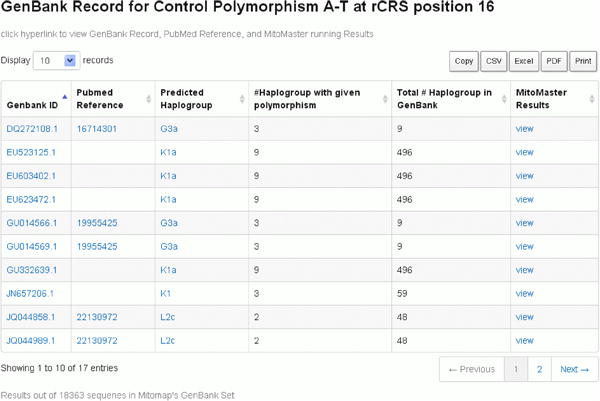
Figure 18. Pub Med ID links to publication.
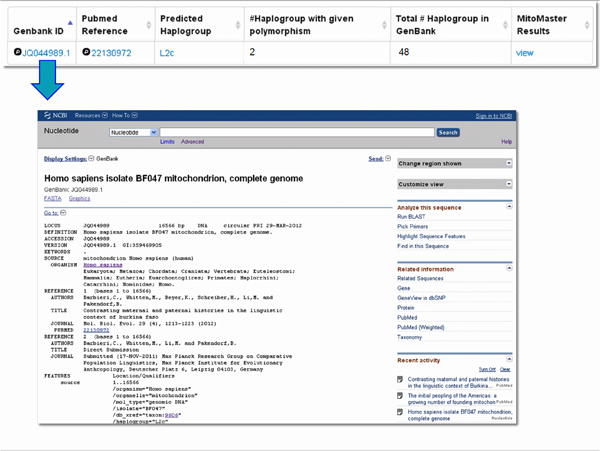
Figure 19. Predicted Haplogroup links to total listing of sequences with that haplogroup in the GenBank sequence set.
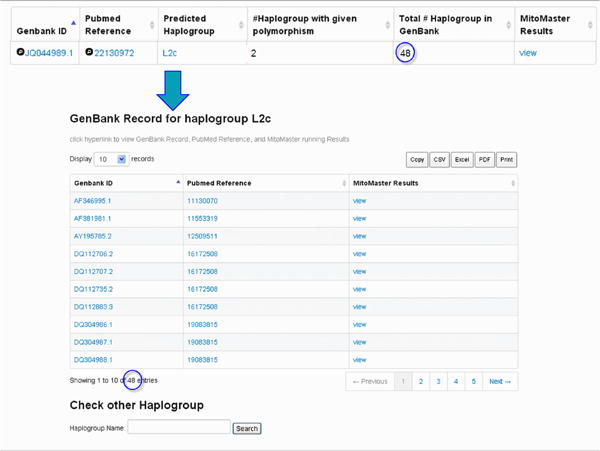
Figure 27. rCRS Track View.
Acknowledgments
This work was supported by NIH Grants NS21325, NS070298, AG24373, and DK73691 plus Simons Foundation Grant 205844 awarded to DCW.
Internet Resources
MITOMAP
MITOMASTER
Phylotree
Haplogrep
NCBI
http://blast.ncbi.nlm.nih.gov/
BLAST
http://www.ncbi.nlm.nih.gov/nuccore/NC_012920.1
The rCRS: Homo sapiens mitochondrion,complete genome
http://www.bioinformatics.nl/tools/crab_fasta.html
FASTA format
Contributor Information
Marie T. Lott, Email: LottM1@email.chop.edu, Center for Mitochondrial and Epigenomic Medicine, Children's Hospital of Philadelphia Research Institute, Philadelphia, PA; CMEM admin phone: 1-267-425-3078; CMEM admin fax: 1-267-426-0978.
Jeremy N. Leipzig, Email: LeipzigJ@email.chop.edu, Center for Biomedical Informatics, The Children's Hospital of Philadelphia Research Institute, Philadelphia, PA; phone: 1-267-426-1375; fax: 1-215-590-5245.
Olga Derbeneva, Email: DerbenevaO@email.chop.edu, Center for Mitochondrial and Epigenomic Medicine, Children's Hospital of Philadelphia Research Institute, Philadelphia, PA; phone: 1-267-425-3064; fax: 1-267-426-0978; work cell: 1-215-866-8121.
H. Michael Xie, Email: XieM1@email.chop.edu, Center for Biomedical Informatics, The Children's Hospital of Philadelphia Research Institute, Philadelphia, PA; phone: 1-267-426-0675; fax: 1-215-590-5245.
Dimitra Chalkia, Center for Mitochondrial and Epigenomic Medicine, Children's Hospital of Philadelphia Research Institute, Philadelphia, PA.
Mahdi Sarmady, Email: SarmadyM@email.chop.edu, Center for Biomedical Informatics, The Children's Hospital of Philadelphia Research Institute, Philadelphia, PA; phone: 1-267-426-1373; fax: 1-215-590-5245.
Vincent Procaccio, Email: ViProcaccio@chu-angers.fr, National Center for Neurodegenerative and Mitochondrial Diseases CHU Angers, Biochemistry and Genetics Department, Angers, France.
Douglas C. Wallace, Email: WallaceD1@email.chop.edu, Center for Mitochondrial and Epigenomic Medicine, Children's Hospital of Philadelphia Research Institute, Philadelphia, PA; Department of Pathology and Laboratory Medicine; University of Pennsylvania, Philadelphia, PA; phone: 1-267-425-3078; fax: 1-267-426-0978.
Literature Cited
- Anderson S, et al. Sequence and organization of the human mitochondrial genome. Nature. 1981;290:457–465. doi: 10.1038/290457a0. [DOI] [PubMed] [Google Scholar]
- Andrews RM, Kubacka I, Chinnery PF, Lightowlers RN, Turnbull DM, Howell N. Reanalysis and revision of the Cambridge reference sequence for human mitochondrial DNA. Nat Genet. 1999;23:147. doi: 10.1038/13779. [DOI] [PubMed] [Google Scholar]
- Kloss-Brandstatter A, Pacher D, Schonherr S, Weissensteiner H, Binna R, Specht G, Kronenberg F. HaploGrep: a fast and reliable algorithm for automatic classification of mitochondrial DNA haplogroups. Hum Mutat. 2011;32:25–32. doi: 10.1002/humu.21382. [DOI] [PubMed] [Google Scholar]
- van Oven M, Kayser M. Updated comprehensive phylogenetic tree of global human mitochondrial DNA variation. Hum Mutat (Online) 2009;30:E386–E394. doi: 10.1002/humu.20921. [DOI] [PubMed] [Google Scholar]
- Wallace DC, Lott MT, Brown MD, Huoponen K, Torroni A. Report of the committee on human mitochondrial DNA. In: Cuticchia AJ, editor. In Human Gene Mapping 1994, a Compendium. The Johns Hopkins University Press; Baltimore, MD: 1995. pp. 910–954. [Google Scholar]
- Yao YG, Salas A, Logan I, Bandelt HJ. mtDNA data mining in GenBank needs surveying. Am J Hum Genet. 2009;85:929–33. doi: 10.1016/j.ajhg.2009.10.023. author reply 933. [DOI] [PMC free article] [PubMed] [Google Scholar]
Key References
- Stajich JE, Block D, Boulez K, Brenner SE, Chervitz SA, Dagdigian C, Fuellen G, Gilbert JG, Korf I, Lapp H, Lehvaslaiho H, Matsalla C, Mungall CJ, Osborne BI, Pocock MR, Schattner P, Senger M, Stein LD, Stupka E, Wilkinson MD, Birney E. The Bioperl toolkit: Perl modules for the life sciences. Genome Res. 2002;12:1611–1618. doi: 10.1101/gr.361602. Supporting publication for Bioperl. [DOI] [PMC free article] [PubMed] [Google Scholar]
- Steinbiss S, Gremme G, Scharfer C, Mader M, Kurtz S. AnnotationSketch: a genome annotation drawing library. Bioinformatics. 2009;25:533–534. doi: 10.1093/bioinformatics/btn657. Supporting publication for AnnotationSketch. [DOI] [PubMed] [Google Scholar]
- Yao YG, Salas A, Logan I, Bandelt HJ. mtDNA data mining in GenBank needs surveying. Am J Hum Genet. 2009;85:929–33. doi: 10.1016/j.ajhg.2009.10.023. author reply 933. Important caveats about use of data mined from public sequences. [DOI] [PMC free article] [PubMed] [Google Scholar]
- Zaragoza MV, Brandon MC, Diegoli M, Arbustini E, Wallace DC. Mitochondrial cardiomyopathies: how to identify candidate pathogenic mutations by mitochondrial DNA sequencing, MITOMASTER and phylogeny. Eur J Hum Genet. 2011;19:200–207. doi: 10.1038/ejhg.2010.169. Using MITOMASTER to investigate pathogenicity. [DOI] [PMC free article] [PubMed] [Google Scholar]


