

Abstract
Much of the basic clinical information about dengue infection comes from experimental human studies conducted in the 1920s and 1940s. Albert Sabin's original laboratory records from one such study were bequeathed to Duane J. Gubler. These records were reviewed and 150 experiments were included in our analyses. Persons were inoculated with dengue virus 1 (DENV-1) and DENV-2. Median fever duration was shorter in primary DENV-2 infections compared with DENV-1, although maximum temperature and severity of illness were comparable. At 1.5–9 months after primary infection, 20 persons were inoculated with the heterologous serotype. Only one person inoculated with a heterologous serotype at < 8 weeks showed development of a clinical infection with a maximum temperature of 38°C, and 7 (88%) of 8 persons inoculated with a heterologous serotype at 4–9 months post-primary infection showed development of fever. On average, persons had a shorter incubation period in secondary infection compared with primary infection.
Introduction
The global re-emergence of dengue as a recurrent epidemic disease in the tropical and sub-tropical world makes this mosquito-borne viral disease a major public health concern. Over half of the world's population live in dengue-endemic areas, and there are an estimated 400 million infections each year.1 Currently there is no vaccine and mosquito control to prevent dengue has failed to produce sustainable results. The presence of four antigenically distinct dengue viruses (DENVs) has complicated vaccine development.2–4 Furthermore, the lack of an animal model that recapitulates the clinical features observed in human infections has limited our understanding of the mechanisms underlying severe dengue pathogenesis.5 Consequently, detailed clinical, virologic, and serologic characterization of dengue patients remains a valuable resource in providing insights into possible mechanisms that drive pathologic processes.
Critical questions about DENV biology that provide information on pathogenesis remain to be fully elucidated. In particular, given that host,6 viral, and possibly vector-related factors7–9 influence disease outcome, cross-sectional studies that compare primary and secondary infections may be confounded by many factors other than the serologic status of dengue at the point of infection. Cohort studies could address this question, although such studies are complex and resource intensive. In addition, the type and persistence of antibody and T cell responses after primary infection can also influence the clinical outcome,10 which would be difficult to control for in epidemiologic studies. These difficulties could be overcome through human dengue challenge studies, although ethical and safety concerns have severely limited the number of such studies.
Because of these considerations, researchers have relied on experimental human studies conducted by the U.S. Army in the 1920s and 1940s for basic information on incubation period, cross-protective immunity, and early clinical presentation.10–12 In particular, the work of Albert Sabin during World War II remains often cited. During 1944–1945, Albert Sabin conducted research in which human subjects were infected with dengue in an attempt to develop a dengue vaccine and diagnostic tools. He explored the degree of cross-protection to infection with a heterologous serotype at various time points after primary infection, which remains a subject that is still incompletely understood today.13 Although a report by Sabin summarized his findings, the data were not shown.10 The notebooks of Sabin detailing the findings in these human challenge studies were bequeathed to one of the authors (D.J,G,), which enabled us to conduct a detailed review of his unpublished data.
Materials and Methods
A total of eight volumes of notebooks were reviewed. The aim of each experiment, the methods used, and the findings were identified and tabulated in a spreadsheet (Excel; Microsoft, Redmond, WA). In particular, we focused on time from virus inoculation to fever onset, maximum temperature, fever duration, time to leukopenia onset, minimum white blood cell (WBC) count, duration of leukopenia, and presence of symptoms across different types of infections. Fever was defined as a temperature > 38°C and leukopenia was defined as a WBC count < 4,500 cells/μL. All data were converted to SI units before statistical analysis (see below). Graphs were generated by using Graphpad Prism (version 5.0, GraphPad Software Inc., Sna Diego, CA) and R version 2.15.0 (http://www.r-project.org/).
Statistical analysis.
The chi-square test was used to compare presence of symptoms, and Wilcoxon's rank sum test was used to compare time to fever onset, maximum temperature, fever duration, time to leukopenia onset, minimum WBC count, and duration of leukopenia in primary DENV-1 versus DENV-2 infections and in secondary dengue infections at < 4 months post-primary infection versus secondary infections at ≥ 4 months. McNemar's test was used to compare presence of symptoms, and Wilcoxon's signed rank test was used to compare time to fever onset, maximum temperature, fever duration, time to leukopenia onset, minimum WBC count, and duration of leukopenia in primary infection versus secondary infection at ≤ 10 weeks and primary infection versus secondary infection at ≥ 4 months. Statistical analyses were performed by using R version 2.15.0 and JMP® version 9 (SAS Institute, Cary, NC).
Smoothed estimates of the mean temperature function, point-wise prediction intervals, and subjects’ individual-specific temperature function estimates with measurement errors removed were generated by using a hierarchical Gaussian process model fit by maximum likelihood.14 In particular, the temperatures were first transformed as temp* = log (temp − min(temp) + 1), where log denotes the natural logarithm. The mean temperature function is modeled as a linear combination of basis functions given by 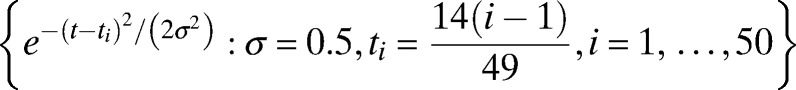 , 50 equally spaced Gaussian kernels. These basic functions are capable of approximating a very broad range of smooth functions. Conditional on the mean temperature function, each individual subject's temperature function is modeled as a Gaussian deviate from the mean function having covariance at time points ti and tj of
 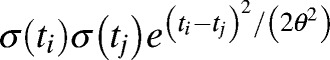 . During the times at which subjects potentially have a fever, the variability from subject-to-subject increases dramatically. To give the model sufficient flexibility to model this increase in variability, the standard deviation functions σ(t) are also modeled as a linear combination of basis functions given by
 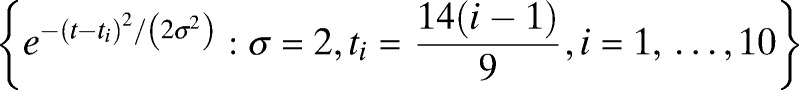 , 10 equally spaced Gaussian kernels. Conditional on each subject's temperature function, the actual measured temperatures are modeled as Gaussian noise. All parameters were estimated by using maximum likelihood.
Results
Historical background.
In 1944, Sabin organized a dengue research unit under the auspices of the U.S. Army in an effort to develop a vaccine.10 Sabin obtained acute-phase serum samples from American soldiers who had a dengue-like illness while stationed in Hawaii, India, and New Guinea. Serum samples were frozen or refrigerated and transported to the United States to be used by Sabin in his experiments. After the soldiers had recovered from the illness and it was clear that the clinical course was compatible with dengue fever, dengue-naïve human subjects in the United States were injected with acute-phase serum that had been obtained during the infection.10 Additional subjects were subsequently inoculated with acute-phase serum from experimentally infected subjects or with infected mosquitoes that had fed on experimentally infected subjects during the acute phase of illness. The DENVs isolated from soldiers in Hawaii, India, and one patient in New Guinea, were similar and were later identified as DENV-1, and DENVs recovered from three other patients in New Guinea were later identified as DENV-2.15 These viruses were subsequently designated as prototype viruses (Haw-DENV-1 and NGC-DENV-2).
Characteristics of subjects.
The laboratory notebooks of Sabin contain records from 243 human subjects who participated in these experiments. These records were reviewed and 147 subjects were included in our analyses. Three of these subjects were exposed to infected serum and did not become ill, but were later infected by mosquito bite, giving 150 experimental inoculations that we analyzed. Of the 96 subjects who were not included, 52 were inoculated with attenuated dengue virus passaged in mice. These experiments were described in detail in the report by Sabin in 1952.10 The other 44 subjects had incomplete records. Initially, Sabin used psychiatric patients at Longview State Hospital in Cincinnati, Ohio who were in need of fever therapy for his experiments.10 At the time, fever therapy was used to treat neurosyphilis.16 Because of the small number of patients requiring fever therapy, Sabin began recruiting medical students in the Army Specialized Training Program at the University of Cincinnati College of Medicine and inmates at the New Jersey State Prison in Trenton, New Jersey as experimental subjects. All subjects were Caucasian. All medical students and prison inmates were males and psychiatric patients included both males and females. Sabin preferentially selected subjects with no history of residence in dengue-endemic areas, but subjects with no febrile illness during their time of residence in a dengue-endemic area were also allowed to participate. For each subject, the temperatures were recorded every 4–6 hours. White blood cell counts with differential counts were recorded at the time of inoculation and every 1–2 days during the febrile phase of illness. Symptoms were recorded daily during the febrile phase of illness (Figure 1).
Figure 1.

Examples of records from Albert Sabin's laboratory notebooks.
Inoculation with dengue virus.
Sabin used several methods to infect the subjects: 73 individuals were inoculated with DENV-infected human serum; 57 were bitten by infected mosquitoes; and 20 were inoculated with DENV plus live attenuated 17-D yellow fever (YF) vaccine (Table 1). Sabin infected 136 subjects with DENV-1 and 14 with DENV-2. DENV-1 was isolated in Hawaii, India, or New Guinea, and DENV-2 was isolated only in New Guinea (Table 2). Ten of the DENV-1 subjects and 10 of the DENV-2 subjects were later inoculated with the other serotype at time intervals from 6 weeks and 6 days to 9 months after primary infection (Table 3). Twelve of the secondary infections occurred at < 4 months and the other eight occurred at ≥ 4 months.
Table 1.
Methods used to infect persons with dengue virus*
| Method of inoculation | No. persons |
|---|---|
| Infected serum | |
| Intradermally | 42 |
| Intradermally and intravenously | 19 |
| Intranasally | 8 |
| Scarification | 2 |
| Conjunctivally | 2 |
| Total | 73 |
| Mosquito bite | 57 |
| Yellow fever vaccine plus DENV-1 | |
| YF and DENV-1 simultaneously | 7 |
| YF followed by DENV-1 at 3 days | 4 |
| YF followed by DENV-1 at 7 days | 3 |
| YF followed by DENV-1 at 1 month | 6 |
| Total | 20 |
A total of 150 experiments were analyzed.
DENV = dengue virus; YF = yellow fever.
Table 2.
Serotype and country of isolation of dengue used in experiments by Sabin
| Dengue serotype and country of isolation | No. persons |
|---|---|
| DENV-1 | |
| Hawaii | 125 |
| India (2 clinical isolates) | 8 |
| New Guinea A | 3 |
| Total | 136 |
| DENV-2 | |
| New Guinea B | 3 |
| New Guinea C | 7 |
| New Guinea D | 4 |
| Total | 14 |
DENV = dengue virus.
Table 3.
Time intervals between primary and secondary infection and method of infection in 20 persons with primary DENV-1 infection followed by secondary DENV-2 infection or vice versa*
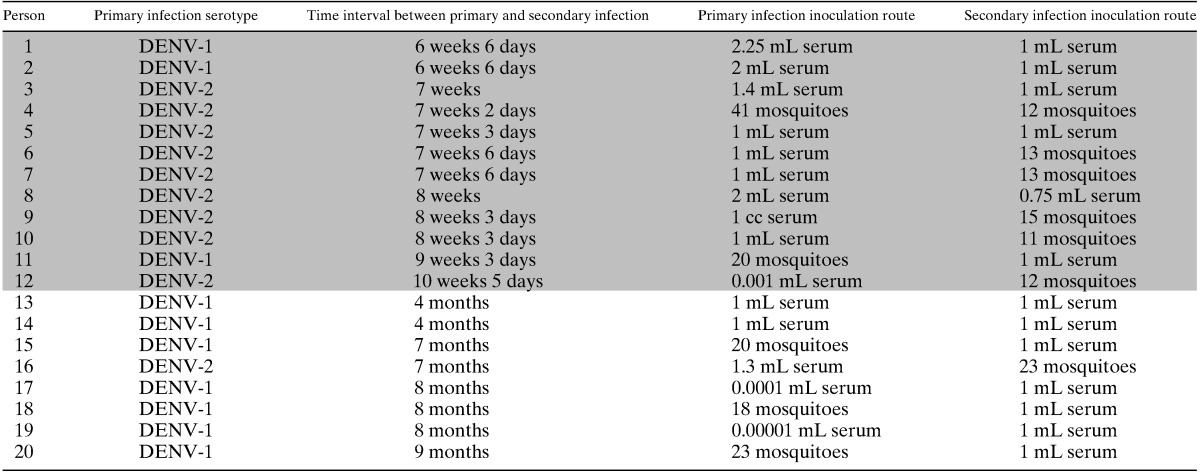
Shaded entries correspond to persons with < 4 months between primary and secondary infection.
DENV = dengue virus.
Inoculation with infected serum.
Subjects were inoculated intradermally only, intradermally and intravenously, intranasally, by scarification, or in the conjunctiva of the eye. The volume of serum that was used for intradermal or intravenous injection ranged from 0.000001 mL to 2.5 mL (median = 1 mL, interquartile range [IQR] = 0.001–1.25 mL). For the intranasal or conjunctival inoculations, 0.01–1 mL was used.
Inoculation by mosquito bite.
Mosquitoes were propagated from eggs and adults were held for 4–9 days after emergence before being allowed to feed on infected subjects during the first day of febrile illness. During the extrinsic incubation period, mosquitoes were maintained at a temperature of 28–32°C and 80–92% humidity. The extrinsic incubation period varied from 5 to 36 days (median = 15 days, IQR = 12.5–20 days), after which the mosquitoes were allowed to feed on new subjects to infect them. The number of mosquitoes ranged from 5 to 56 (median = 20, IQR = 16–24), and the number of mosquitoes that became engorged ranged from 5 to 51 (median = 18, IQR = 14.5–23). Mosquitoes were allowed to feed on 48 subjects on one day only, and on 9 subjects on day 0, and then again on days 2, 4, or 8 after the initial bite. Thirty-nine of the subjects who were infected by mosquito bite had previously participated in other experiments that did not result in a febrile illness (Table 4).
Table 4.
Participation of persons in previous experiments*
| Type of previous experiment | No. persons |
|---|---|
| Inoculated with UV-irradiated DENV-1 | 10 |
| Inoculated with chick /mouse embryo passaged DENV-1 | 9 |
| Bitten by mosquitoes not known to transmit DENV | 7 |
| Inoculated with diluted virus | 5 |
| Inoculated with formalin-inactivated DENV-1 | 4 |
| Inoculated with DENV-1 plus convalescent-phase serum | 4 |
| Total | 39 |
Thirty-nine persons who were infected by mosquito bite had previously participated in other experiments that did not result in a febrile illness. The prior experiments included inoculation with dengue virus 1 (DENV-1)-infected serum irradiated with ultraviolet light (UV) for 10–30 minutes; inoculation with DENV-1 that was propagated in chick or mouse embryos for 3–7 passages; bites from mosquito species not known to transmit dengue (Aedes cantator, Ae. sollicitans, Ae. taeniorhynchus, Ae. vexans, Anopheles punctipennis, An. quadrimaculatus, and Culex pipiens); inoculation with diluted serum containing dengue virus or bites from mosquitoes that fed on diluted serum; inoculation with DENV-1 inactivated with 0.05% formalin; and inoculation with a mixture of 0.001 mL of DENV-1-infected serum plus 0.9 mL of serum obtained from DENV-1 convalescent-phase patients at 12 days to 8 months after onset of fever.
Inoculation with YF vaccine 17D plus DENV.
Twenty subjects were inoculated with 1 mL of YF vaccine 17D plus Hawaii DENV-1. The YF vaccine and DENV-1 were administered simultaneously or at time intervals varying from three days to one month (Table 1).
Characteristics of dengue infections.
Of the 147 subjects inoculated with DENV, age was recorded for 83, and ranged from 19 to 49 years (median = 30 years, IQR 25–37 years). The subjects who were inoculated with DENV by injection of infected serum or by mosquito bite were analyzed together because there was little indication that characteristics of the resultant illnesses differed. Those who were inoculated intranasally, by scarification, conjunctivally, or with YF vaccine plus dengue were analyzed separately.
Of the 118 subjects experiencing primary DENV-1 or DENV-2 infection by mosquito bite or injection of infected serum, 115 (97%) showed development of a febrile illness (temperature ≥ 38°C) (Figure 2). The median maximum temperature was 39.6°C, median duration of fever was 3.2 days, median minimum WBC count was 3,150 cells/μL, and median duration of leukopenia was 4 days (Table 5). Not including nine subjects who were bitten by mosquitoes on multiple days and for whom the actual date of infection could not be determined, the median incubation period was 6.5 days and time to onset of leukopenia was 7 days. The most common signs and symptoms were fever > 38°C (97%), leukopenia (94%), and rash (91%). Headache, eye pain, petechiae, backache, and body ache were present in > 50% of subjects. More than 30% of subjects experienced nausea or vomiting, anorexia, or abdominal pain, and 5% of subjects experienced nosebleed (Table 6).
Figure 2.

Temperature (A) and white blood cell (WBC) count (B) over time in 118 persons with a primary infection with dengue virus 1 (DENV-1) or DENV-2. Black dots represent persons’ temperature or WBC count data. Red curves represent subject-specific temperature or WBC count predictions, taking into account measurement error. Gray areas represent point-wise 95% prediction intervals, and black lines represent estimated mean curves.
Table 5.
Characteristics of dengue virus 1 and dengue virus 2 primary infections*
| Characteristic | Median and interquartile range | Range | P | ||
|---|---|---|---|---|---|
| All DENV (n = 118) | DENV-1 (n = 104) | DENV-2 (n = 14) | All DENV (n = 115)† | DENV-1 vs. DENV-2 | |
| Days to fever onset‡ | 6.5 (5.6–7.8) | 6.4 (5.6–7.9) | 6.9 (5.4–7.7) | 2.6–14.2 | 0.732 |
| Maximum temperature (°C) | 39.5 (39.1–39.8) | 39.6 (39.2–39.8) | 39.4 (38.9–39.9) | 38.1–40.8 | 0.895 |
| Fever duration (days) | 3.2 (2.0–4.2) | 3.3 (2.2–4.5) | 2.2 (1.8–3.0) | 0.2–6.8 | 0.024 |
| Days to leukopenia onset‡ | 7.0 (6.0–9.0) | 7.0 (6.0–9.0) | 8.0 (6.3–9.0) | 0–15 | 0.909 |
| Minimum WBC count (cells/μL) | 3,150 (2,588–3,663) | 3,100 (2525–3600) | 3,625 (3,213–3,975) | 1,100–7,400 | 0.055 |
| Leukopenia duration (days) | 4.0 (3.0–5.3) | 4.0 (2.5–6.0) | 3.5 (3.0–5.0) | 0–15 | 0.888 |
Values in bold are statistically significant.
Range was calculated only for the 115 subjects who showed development of a fever.
Days to fever onset and days to leukopenia onset were calculated by using the 106 persons who were inoculated on one occasion only.
DENV = dengue virus; WBC = white blood cell.
Table 6.
Incidence of symptoms in primary DENV-1 and primary DENV-2 infections*
| Characteristic | Type of infection, no. positive/no. tested (%) | P | ||
|---|---|---|---|---|
| All DENV (n = 118)† | DENV-1 (n = 104)† | DENV-2 (n = 14) | DENV-1 vs. DENV-2 | |
| Fever > 38°C | 115/118 (97) | 101/104 (97) | 14/14 (100) | 0.520 |
| Leukopenia | 107/116 (94) | 94/102 (92) | 13/14 (93) | 0.927 |
| Rash | 106/117 (91) | 93/103 (90) | 13/14 (93) | 0.758 |
| Headache | 86/101 (85) | 72/87 (83) | 14/14 (100) | 0.092 |
| Eye pain | 77/101 (76) | 64/87 (74) | 13/14 (93) | 0.115 |
| Petechiae | 81/116 (70) | 71/102 (70) | 10/14 (71) | 0.889 |
| Backache | 71/101 (70) | 61/87 (70) | 10/14 (71) | 0.921 |
| Body ache | 70/101 (69) | 61/87 (70) | 9/14 (64) | 0.661 |
| Nausea/vomiting | 45/101 (45) | 40/87 (46) | 5/14 (36) | 0.473 |
| Anorexia | 44/101 (44) | 37/87 (43) | 7/14 (50) | 0.601 |
| Abdominal pain | 36/101 (36) | 30/87 (34) | 6/14 (43) | 0.544 |
| Cough/sore throat | 21/101 (21) | 14/87 (16) | 7/14 (50) | 0.004 |
| Altered taste | 17/101 (17) | 13/87 (15) | 4/14 (29) | 0.206 |
| Nosebleed | 5/101 (5) | 5/87 (6) | 0/14 (0) | 0.358 |
| Diarrhea | 1/101 (1) | 1/87 (1) | 0/14 (0) | 0.687 |
P values were calculated by using the chi-square test.
The presence of symptoms was not recorded for every person.
DENV = dengue virus.
The three subjects who did not show development of a fever > 38°C when exposed to dengue were all inoculated with DENV-1 from Hawaii. One was inoculated with 0.000001 mL serum and never showed development of a fever > 37.5°C or leukopenia. This subject was later bitten by Hawaii DENV-1-infected mosquitoes and showed development of a mild illness with a maximum temperature of 38.2°C and no other temperatures exceeding 38°C. The second subject was inoculated with 0.00001 mL serum and had a maximum temperature of 37.6°C within the first 24 hours after inoculation, but otherwise never showed development of a fever or leukopenia. The third subject was bitten by mosquitoes that infected other subjects successfully, and had one temperature reading of 37.8°C on day 13 but was otherwise afebrile. This person had a WBC count of 3,500 cells/μL on day 11, but a repeat WBC count on the same day was 7,750 cells/μL, suggesting that the first WBC count was likely a measurement error.
In addition to the subjects who did not show development of a fever when inoculated with DENV, some other subjects showed development of only a mild illness. Specifically, one subject who had been previously inoculated with 0.01 mL of DENV-1 infected serum intranasally and did not show development of a fever was subsequently bitten by DENV-1-infected mosquitoes and had a temperature > 38°C on two measurement occasions, and had a maximum temperature of 38.3°C on day 6 and a temperature of 38.1°C on day 11. Another subject who had not previously participated in any experiments had a temperature > 38°C on only two measurement occasions on day 10 after inoculation, with a maximum temperature of 38.3°C. This subject was bitten by partially blooded infected mosquitoes that successfully transmitted dengue to other subjects on the same day.
Comparison of primary DENV-1 and primary DENV-2.
A total of 104 subjects were infected with primary DENV-1 and 14 subjects were infected with primary DENV-2 either by mosquito bite or by injection of infected serum. There were no statistically significant differences in incubation period, maximum temperature, days to onset of leukopenia, or duration of leukopenia in primary DENV-1 and DENV-2 (Figure 3 and Table 5). However, the median duration of fever > 38°C was 3.3 days in DENV-1 compared with 2.2 days in DENV-2 (P = 0.024), and there was a trend towards more severe leukopenia in DENV-1, with a median minimum WBC count of 3,100 cells/μL in DENV-1 compared with 3,625 cells/μL in DENV-2 (P = 0.055). The reported symptoms were similar except that 50% of DENV-2 subjects reported a cough or sore throat, compared with only 16% of DENV-1 subjects (P = 0.004) (Table 6).
Figure 3.

Mean temperature (A) and white blood cell count (WBC) (B) over time in persons infected with dengue virus 1 (DENV-1) (n = 104, solid black line) or DENV-2 (n = 14, dashed red line).
There were no indications of any difference in the characteristics of illness in subjects infected with DENV-1 from Hawaii compared with DENV-1 from India, except that only 37% of the subjects infected with the India virus showed development of petechiae compared with 72% of those infected with the Hawaii virus (P = 0.045; Tables 7 and 8). Of the 17 subjects infected with DENVs from New Guinea, 3 were infected with DENV-1 and 14 were infected with DENV-2. Unfortunately, these numbers were too small to make reliable comparisons.
Table 7.
Characteristics of primary infections with DENV-1 isolated in Hawaii, New Guinea, and India*
| Characteristic | Site of DENV-1 isolation | ||
|---|---|---|---|
| Hawaii (n = 93) | New Guinea (n = 3) | India (n = 8) | |
| Days to fever onset | 6.4 (5.6–7.8) | 8.2 (6.8–8.3) | 5.7 (5.1–6.0) |
| Maximum temperature (°C) | 39.6 (39.2–39.8) | 39.7 (39.5–39.7) | 39.5 (38.7–39.7) |
| Fever duration (days) | 3.4 (2.2–4.5) | 2.0 (1.9–3.2) | 3.2 (2.2–3.6) |
| Days to leukopenia onset | 8.0 (7.0–9.0) | 7.0 (7.0–8.5) | 7.0 (5.0–8.5) |
| Minimum WBC count/μL | 3,100 (2,525–3,600) | 2,600 (2,550–3,150) | 3,150 (2,750–3,400) |
| Leukopenia duration, days | 4.0 (2.5–5.0) | 3.0 (3.0–3.5) | 6.0 (3.5–10.8) |
Values are median (interquartile range).
DENV-1 = dengue virus 1; WBC = white blood cell.
Table 8.
Incidence of symptoms in primary infections with DENV-1 isolated in Hawaii, New Guinea, or India*
| Characteristic | Site of DENV-1 isolation | ||
|---|---|---|---|
| Hawaii (n = 93†) | New Guinea (n = 3†) | India (n = 8‡) | |
| Fever > 38°C | 90/93 (97) | 3/3 (100) | 8/8 (100) |
| Leukopenia | 83/91 (91) | 3/3 (100) | 8/8 (100) |
| Macular rash | 84/92 (91) | 3/3 (100) | 6/8 (75) |
| Headache | 69/84 (82) | 3/3 (100) | |
| Eye pain | 61/84 (73) | 3/3 (100) | |
| Petechiae | 66/92 (72) | 2/2 (100) | 3/8 (38) |
| Backache | 59/84 (70) | 2/3 (67) | |
| Body ache | 59/84 (70) | 2/3 (67) | |
| Nausea/vomiting | 38/84 (45) | 2/3 (67) | |
| Anorexia | 35/84 (42) | 2/3 (67) | |
| Abdominal pain | 30/84 (36) | 0/3 (0) | |
| Cough/sore throat | 13/84 (15) | 1/3 (33) | |
| Altered taste | 12/84 (14) | 1/3 (33) | |
| Nosebleed | 5/84 (6) | 0 (0) | |
| Diarrhea | 1/84 (1) | 0 (0) | |
Values are no. positive/no. tested (%).
Presence of symptoms was not recorded for every person.
All persons from India were psychiatric patients at Longview Hospital and omitted symptoms were not recorded.
DENV-1 = dengue virus 1.
Comparison of different methods of Hawaii DENV-1 inoculation.
Subjects inoculated with Hawaii DENV-1 intradermally were compared with subjects inoculated with the same virus intradermally and intravenously. There were no differences in maximum temperature, fever duration, time to onset of leukopenia, minimum WBC count, or duration of leukopenia between the two groups (Table 9), but a greater proportion of subjects that were infected by intradermal and intravenous injection had an incubation period less than four days compared with those that were infected by intradermal injection only. Five (42%) of 12 of these subjects showed development of a fever less than four days after inoculation compared with 0 of 28 subjects who were inoculated only intradermally (P = 0.001). The shortest incubation period was 3.2 days in the group inoculated intravenously. In subjects who were infected by injection of serum, the maximum temperature, incubation period, and time to onset of leukopenia were associated with the volume of serum injected (Table 10). Those injected with a larger volume tended to have a higher maximum temperature (P = 0.013), and shorter time to onset of fever (P < 0.001) and leukopenia (P < 0.009).
Table 9.
Comparison of different methods of inoculation in primary DENV-1 persons*
| Characteristic | Intradermal inoculation vs. intradermal and intravenous inoculation | Serum vs. mosquito | No previous experiments vs. previously bitten by mosquitoes not known to transmit DENV | No previous experiments vs. previously inoculated with UV irradiated DENV-1 | No previous experiments vs. previously inoculated with formalin inactivated DENV-1 | No previous experiments vs. previously inoculated with diluted virus | No previous experiments vs. previously inoculated with chick/mouse embryo passaged DENV-1 | No previous experiments vs. previously inoculated with DENV-1 plus convalescent-phase serum |
|---|---|---|---|---|---|---|---|---|
| Days to fever onset | 0.344 | 0.105 | 0.790 | 0.838 | 0.032 | 0.953 | 0.225 | 0.638 |
| Maximum temperature (°C) | 0.625 | 0.023 | 0.381 | 0.275 | 0.569 | 0.354 | 0.738 | 0.254 |
| Fever duration | 0.256 | 0.886 | 0.122 | 0.402 | 0.130 | 0.335 | 0.973 | 0.245 |
| Days to leukopenia onset | 0.188 | 0.159 | 0.109 | 0.067 | 0.282 | 0.079 | 0.029 | 0.690 |
| Minimum WBC count/μL | 0.084 | 0.088 | 0.177 | 1 | 0.395 | 0.930 | 0.204 | 0.395 |
| Leukopenia duration | 0.168 | 0.589 | 1 | 0.706 | 0.559 | 0.423 | 0.263 | 0.418 |
P values were calculated by using Wilcoxon's rank sum test. Values in bold are statistically significant.
DENV = dengue virus; UV = ultraviolet; WBC = white blood cell.
Table 10.
Association between volume of serum or number of infected mosquitoes used to inoculate persons and characteristics of illness*
| Characteristic | P | |
|---|---|---|
| Serum volume | No. mosquitoes engorged | |
| Days to fever onset | < 0.001 | 0.527 |
| Maximum temperature (°C) | 0.013 | 0.174 |
| Fever duration | 0.137 | 0.115 |
| Days to leukopenia onset | 0.009 | 0.701 |
| Minimum WBC count/μL | 0.058 | 0.359 |
| Leukopenia duration | 0.964 | 0.855 |
Values in bold are statistically significant.
WBC = white blood cells.
Subjects infected with Hawaii DENV-1 by injection of serum were compared with subjects who were infected with Hawaii DENV-1 by mosquito bite. Subjects infected by mosquito bite had a median of 5.8 days to fever onset compared with 6.9 days in the subjects infected via injection of serum (P = 0.023), but otherwise there was no indication that the characteristics of the infections differed in the two groups (Table 9). There was no statistically significant relationship between the number of infected mosquitoes that fed on the subjects and the maximum temperature, time to onset of fever, fever duration, time to onset of leukopenia, minimum WBC count, or duration of leukopenia (Table 10).
Nine of the subjects infected by mosquito bite were bitten on multiple days, first on day 0 and again on days 2, 4, or 8. The median time to fever onset was 5.8 days in subjects infected with Hawaii DENV-1 by mosquito bite on day 0 only compared with 8 days for the subjects bitten on day 0 and day 2 (P = 0.031) and 13.3 days for the subjects bitten on day 0 and day 4 or day 8 (P = 0.002), suggesting that the subjects who were bitten on multiple days may not have become infected until the second time they were bitten. However, there was no indication that the resultant infections differed in terms of maximum temperature, minimum WBC count, and duration of fever and leukopenia. Therefore, the subjects who were bitten on multiple days were included in the calculations of maximum temperature, minimum WBC count, and duration of fever and leukopenia, but not in the calculations of time to onset of fever or leukopenia.
Thirty-nine of the 53 subjects who were infected with DENV-1 by mosquito bite had previously participated in other experiments that did not result in a febrile illness (Table 4). Broadly, there was little indication that maximum temperature, time to onset of fever, fever duration, time to onset of leukopenia, minimum WBC count, or duration of leukopenia differed between the subjects who were infected by mosquito bite and had never participated in prior experiments compared with any of the other groups (Table 9).
Duration of cross-protection between DENV-1 and DENV-2.
Twenty subjects were infected with one serotype of dengue, followed by a heterologous serotype at time intervals from 6 weeks and 6 days to 9 months (Figure 4). Of these 20 subjects, 11 showed development of a fever > 38°C during the secondary infection. Median time to fever onset was 6.9 days in primary infection compared with 4.2 days in the 11 patients who showed development of a fever during secondary infection (P = 0.007). Median maximum temperature was 39.5°C in primary infection compared with 38.8°C in secondary infection (P = 0.011). Median duration of fever was 3.0 days in primary infection compared with 1.0 days in secondary infection (P < 0.001). There was no evidence that onset of leukopenia occurred earlier in secondary infection (P = 0.092), or that the severity or duration of leukopenia differed (P = 0.320 and P = 0.719) (Table 11).
Figure 4.

Temperature over time in primary and secondary dengue infections in individual persons. Persons were inoculated with dengue virus 1 (DENV-1) and DENV-2 at time intervals ranging from 6 weeks and 6 days to 9 months. Time between primary and secondary inoculation is shown over each graph. Solid lines represent temperature in primary infection. Dotted lines represent secondary infection. DENV-2B, DENV-2C, and DENV-2D refer to DENV-2 isolated from three individual patients and subsequently inoculated into experimental subjects.
Table 11.
Primary dengue infections in 20 persons compared with secondary infections in which the person showed development of a fever, secondary infections at < 4 months, and secondary infections at ≥ 4 months*
| Characteristic | Primary infection (n = 20) | Secondary infection, fever developed (n = 11) | Secondary infection at < 4 months (n = 12) | Secondary infection at ≥ 4 months (n = 8) |
|---|---|---|---|---|
| Days to fever onset | 6.9 (6.0–7.4) | 4.2 (4.0–5.1) | NR | 4.2 (4.0–4.5) |
| Maximum temperature (°C) | 39.5 (39.2–39.8) | 38.8 (38.3–39.2) | 37.8 (37.6–38.2) | 38.8 (38.2–39.4) |
| Fever duration | 3.0 (2.0–4.1) | 1.0 (0.6–1.4) | 0 (0–0.3) | 1.0 (0.6–1.6) |
| Days to leukopenia onset | 7.5 (6.8–9.0) | 5.0 (5.0–6.0) | NR | 5 (4.8–NR) |
| Minimum WBC count | 3,200 (2,688–3,925) | 3,250 (2,750–3,550) | 4,350 (3,488–5,900) | 3,225 (2,825-3,925) |
| Leukopenia duration | 4.5 (3.0–5.3) | 3.0 (2.0–6.0) | 1.0 (0–3.0) | 3.0 (1.5–5.5) |
| P | ||||
| Type of infection | Primary vs. secondary, fever developed | Primary vs. secondary at < 4 months | Primary vs. secondary at ≥ 4 months | Secondary at < 4 months vs. ≥ 4 months |
| Days to fever onset | 0.007 | 0.021 | 0.183 | 0.023 |
| Maximum temperature (°C) | 0.011 | 0.003 | 0.052 | 0.034 |
| Fever duration | < 0.001 | < 0.001 | < 0.001 | 0.700 |
| Days to leukopenia onset | 0.092 | 0.084 | 0.288 | 0.069 |
| Minimum WBC count/μL | 0.320 | 0.021 | 0.148 | 0.521 |
| Leukopenia duration | 0.719 | 0.065 | 0.288 | 0.412 |
Values in the top half of the table are median (interquartile range). P values were calculated by using Wilcoxon's signed rank test or Wilcoxon's rank sum test as appropriate. Values in bold are statistically significant.
NR = > 50% of persons did not show development fever or leukopenia; WBC = white blood cell.
In subjects who were secondarily infected at < 4 months, headache was the most common symptom and was present in 7 (58%) of 12 subjects, and leukopenia was present in 6 (50%) of 12 subjects (Table 12). All other symptoms were present in < 50% of subjects. Fever, leukopenia, rash, eye pain, backache, and anorexia were significantly less likely to be present in secondary infection at < 4 months compared with primary infection. All other symptoms showed a trend towards a lower prevalence in secondary infection at < 4 months compared with primary, except for diarrhea, which was present in 2 (17%) of 12 subjects with secondary infection at < 4 months and in 0 of 20 subjects with primary infection. In secondary infection at 4–9 months, most of subjects were symptomatic, only 1 of 8 had no symptoms, and infections generally seemed to resemble primary infections except that rash was present in 19 (95%) of 20 primary infections and 0 (0%) of 8 secondary infections at 4–9 months (Table 12).
Table 12.
Symptoms in primary dengue infection compared with secondary infection at < 4 months and secondary infection at ≥ 4 months*
| Symptom | No. (%) persons with symptom | P | ||||
|---|---|---|---|---|---|---|
| Primary infection | Secondary infection at < 4 months | Secondary infection at ≥ 4 months | Primary vs. secondary at < 4 months | Primary vs. secondary at ≥ 4 months | Secondary at < 4 months vs. secondary at ≥ 4 months | |
| Fever > 38°C | 20 (100) | 4 (33) | 7 (88) | 0.013 | 1 | 0.113 |
| Leukopenia | 19 (95) | 6 (50) | 6 (75) | 0.041 | 1 | 0.370 |
| Macular rash | 19 (95) | 3 (25) | 0 (0) | 0.013 | 0.013 | 0.371 |
| Headache | 19 (95) | 7 (58) | 7 (88) | 0.074 | 1 | 0.514 |
| Eye pain | 17 (85) | 2 (17) | 6 (75) | 0.004 | 1 | 0.032 |
| Petechiae | 13 (65) | 2 (17) | 4 (50) | 0.077 | 1 | 0.273 |
| Backache | 14 (70) | 2 (17) | 5 (63) | 0.041 | 1 | 0.104 |
| Body ache | 14 (70) | 3 (25) | 5 (63) | 0.182 | 1 | 0.226 |
| Nausea/vomiting | 8 (40) | 0 (0) | 0 (0) | 0.074 | 0.248 | 1 |
| Anorexia | 10 (50) | 0 (0) | 3 (38) | 0.023 | 1 | 0.097 |
| Abdominal pain | 7 (35) | 1 (8) | 0 (0) | 0.134 | 0.480 | 0.834 |
| Cough/sore throat | 4 (20) | 0 (0) | 1 (13) | 0.134 | 1 | 0.834 |
| Altered taste | 5 (25) | 0 (0) | 1 (13) | 0.134 | 1 | 0.834 |
| Nosebleed | 1 (5) | 0 (0) | 0 (0) | 1 | 1 | 1 |
| Diarrhea | 0 (0) | 2 (17) | 0 (0) | 0.480 | 1 | 0.648 |
P values were calculated by using McNemar's test or chi-square test as appropriate. Values in bold are statistically significant.
Although there was not sufficient evidence to conclude that mean maximum temperature in secondary infection was linearly related to time post-primary infection (P = 0.094), subjects inoculated with a heterologous dengue serotype at a longer time interval appeared to be more likely to show development of a symptomatic infection. In secondary infections at < 4 months, 7 (58%) of 12 subjects reported symptoms, compared with 7 (88%) of 8 subjects at 4–9 months (Table 13). In secondary infection at < 4 months, fever and leukopenia was generally milder and of shorter duration than in primary infection. In secondary infection at 4–9 months, there was a trend towards an earlier onset but shorter duration of fever and leukopenia compared with primary infection (Table 11). Of the seven secondary infections at < 8 weeks, all but one had a temperature < 38°C (Figure 4A–G and Table 13). One subject, who had a primary DENV-1 infection, followed by DENV-2 at 7 weeks 6 days post-primary infection, had a maximum temperature of 38°C, a detectable viremia on day 8 (serum was inoculated into another volunteer), and was leukopenic with a minimum WBC count of 3,500 cells/μL on day 10 (Figure 4F). Another subject, who had a primary DENV-1 infection, followed by DENV-2 at 7 weeks (Figure 4C), reported no symptoms but had a maximum temperature of 37.9°C on day 5 and mild leukopenia (minimum WBC count = 3,800 cells/μL on day 8). Two other subjects were symptomatic and had maximum temperatures of 37.6°C on days 4 and 7, respectively, but never showed development of leukopenia; one had a primary DENV-1 infection, followed by DENV-2 at 6 weeks 6 days (Figure 4A), and one had a primary DENV-2 infection, followed by DENV-1 at 7 weeks 2 days (Figure 4D).
Table 13.
Characteristics of primary and secondary DENV-1 or DENV-2 infections in 20 persons*
| Person | Primary infection serotype | Time interval between primary and secondary | TMax (°C) | Day of TMax | Lowest WBC count/μL | Day of lowest WBC count | TMax (°C) | Day of TMax | Lowest WBC count | Day of lowest WBC count | Symptom | Viremia |
|---|---|---|---|---|---|---|---|---|---|---|---|---|
| 1 | DENV-1 | 6 weeks 6 days | 39.8 | 8 | 2,900 | 7 | 37.6 | 4 | 6,350 | 5 | Yes | |
| 2 | DENV-1 | 6 weeks 6 days | 39.5 | 7 | 2,350 | 7 | 37.7 | 8 | 4,700 | 4 | No | |
| 3 | DENV-2 | 7 weeks | 38.7 | 5 | 3,900 | 9 | 37.9 | 5 | 3,800 | 8 | No | No (day 12) |
| 4 | DENV-2 | 7 weeks 2 days | 38.8 | 8 | 3,250 | 5 | 37.6 | 7 | 4,550 | 8 | Yes | |
| 5 | DENV-2 | 7 weeks 3 days | 39.9 | 8 | 4,000 | 10 | < 37.5 | 5,900 | 7 | No | ||
| 6 | DENV-2 | 7 weeks 6 days | 40.2 | 7 | 4,150 | 7 | 38 | 8 | 3,500 | 10 | Yes | Yes (day 8) |
| 7 | DENV-2 | 7 weeks 6 days | 39.2 | 8 | 3,750 | 10 | 37.7 | 2 | 5,900 | 4 | No | |
| 8 | DENV-2 | 8 weeks | 39 | 4 | 3,400 | 9 | 38.3 | 5 | 4,300 | 6 | Yes | Yes (day 5) |
| 9 | DENV-2 | 8 weeks 3 days | 40.6 | 8 | 4,150 | 9 | 38.8 | 6 | 2,450 | 8 | Yes | |
| 10 | DENV-2 | 8 weeks 3 days | 39.8 | 10 | 3,500 | 10, 11 | < 37.5 | 6,850 | 7 | No | ||
| 11 | DENV-1 | 9 weeks 3 days | 40.2 | 10 | 2,800 | 11 | 38.6 | 4 | 3,250 | 5 | Yes | |
| 12 | DENV-2 | 10 weeks 5 days | 38.7 | 10 | 2,650 | 11 | 38.1 | 6 | 3,450 | 6 | Yes | |
| 13 | DENV-1 | 4 months | 39.5 | 7 | 4,250 | 9 | 39.4 | 6 | 4,750 | 5 | Yes | |
| 14 | DENV-1 | 4 months | 39.4 | 10 | 5,050 | 8 | 38.2 | 6 | 3,200 | 5 | Yes | |
| 15 | DENV-1 | 7 months | 40 | 9 | 2,500 | 9 | 39.6 | 4 | 2,900 | 6 | Yes | |
| 16 | DENV-2 | 7 months | 38.8 | 5 | 3,150 | 7 | 38.9 | 4 | 3,450 | 5 | Yes | |
| 17 | DENV-1 | 8 months | 39.4 | 8 | 1,100 | 12 | 39.4 | 4 | 2,100 | 8 | Yes | |
| 18 | DENV-1 | 8 months | 39.8 | 11 | 2,700 | 9 | 38.2 | 4 | 3,650 | 5 | Yes | Yes (day 4) |
| 19 | DENV-1 | 8 months | 39.7 | 10 | 3,100 | 12 | < 37.5 | 5,600 | 7 | No | ||
| 20 | DENV-1 | 9 months | 39.4 | 7 | 1,250 | 11 | 38.9 | 5 | 2,600 | 8 | Yes | Yes (day 4) |
The only symptom was headache. Sabin noted “Possible cause for headaches – wife getting divorce.” Values in bold are statistically significant.
DENV = dengue virus; TMax, maximum temperature; WBC = white blood cell.
At 8–10 weeks post primary infection, 4 (80%) of 5 subjects became ill and had maximum temperatures between 38.1°C and 38.8°C and minimum WBC counts of 2,450–4,300 cells cells/μL; all four reported symptoms of dengue infection (Figure 4H–L). Three of these subjects had DENV-2 primary infection, followed by DENV-1 secondary infection, and one had DENV-1 primary infection, followed by DENV-2 secondary infection. The fifth subject was asymptomatic; all temperatures were < 37.5°C and no leukopenia was observed. This subject had a primary DENV-2 infection and was inoculated with DENV-1 at 8 weeks 3 days post-primary infection (Figure 4J).
At 4–9 months post-primary infection, 7 (88%) of 8 subjects with secondary infection showed development of fever (Figure 4M–T). Six of these subjects had primary DENV-1 infection, followed by DENV-2, and one had DENV-2 followed by DENV-1. Three (38%) of subjects with secondary infection at 4–9 months post-primary infection had a maximum temperature > 39°C; all had primary DENV-1 infection, followed by DENV-2. Six of the 7 subjects who showed development of fever also had leukopenia, with minimum WBC counts of 2,100–3,650 cells cells/μL. The subject who had fever but not leukopenia had a primary DENV-1 infection, followed by DENV-2 at four months and had a maximum temperature of 39.4°C on day 6 and a minimum WBC count of 4,750 cells cells/μL on day 5. One subject, who had a primary DENV-1 infection and was inoculated with DENV-2 at 8 months post-primary infection, was asymptomatic; all temperatures were < 37.5°C and no leukopenia was observed (Figure 4S). This subject was inoculated with 1 mL of serum obtained from a viremic subject; other subjects showed development of dengue infection after inoculation with aliquots of this serum.
There was no evidence that the mean maximum temperature or mean fever duration during secondary infection differed in subjects that were infected with DENV-1 followed by DENV-2 compared with subjects that were infected with DENV-2 followed by DENV-1 (P = 0.198 and P = 0.112).
Duration of homologous protection.
In contrast to the heterologous serotype challenge, three subjects were re-inoculated with the same DENV-1 virus pool 18 months after a primary DENV-1 infection. All three subjects showed development of a febrile illness during the primary infection but were completely asymptomatic during re-inoculation with the same virus. A control subject who had not had a prior infection was infected at the same time and with the same virus. This control subject showed development of a febrile illness that lasted six days and a maximum temperature of 40°C.
Exposure to dengue intraconjunctivally, intranasally, or by scarification.
Twelve subjects were exposed to Hawaii DENV-1-infected serum intraconjunctivally, intranasally, or by scarification (also known as the percutaneous multiple puncture technique, which is the method by which the smallpox vaccine is administered). In the two subjects inoculated by scarification, there was no indication that the resulting illness differed from that experienced by subjects inoculated by mosquito bite or by injection of infected serum.
Two subjects were inoculated by introducing infected serum into the conjunctiva of the eye; one received 0.01 mL of serum and the other received 1 mL of serum. The subject who received 0.01 mL of serum intraconjunctivally was asymptomatic; all temperatures were < 37.5°C and no leukopenia was observed. The subject who received 1 mL of serum intraconjunctivally showed development of a fever 8.8 days after inoculation and leukopenia 11 days after inoculation. In comparison, subjects infected with Hawaii DENV-1 by mosquito bite or injection of infected serum had a median of 6.4 days to onset of fever and 7 days to onset of leukopenia. These differences were not statistically significant (P = 0.231 and P = 0.236).
Eight subjects were inoculated intranasally; 2 subjects received 0.01 mL of serum, 2 subjects received 0.1 mL of serum, and 4 subjects received 1 mL of serum. The subjects who received 0.01 mL of infected serum intranasally were asymptomatic; all temperatures were < 37.5°C and no leukopenia was observed. The other six subjects who were inoculated intranasally all showed development of febrile illnesses that were milder and had a delayed onset compared with the subjects inoculated with Hawaii DENV-1 by mosquito bite or injection of serum (Table 14). There were no statistically significant differences in the symptoms that subjects reported, except that 3 (50%) of 6 subjects infected intranasally experienced nosebleeds compared with 5 (6%) of 84 subjects inoculated by the standard route (P < 0.001).
Table 14.
Characteristics of dengue infection in persons inoculated with Hawaii DENV-1 intranasally compared with persons inoculated by mosquito bite or injection of infected serum*
| Characteristic | DENV-1 Hawaii (n = 93) | DENV-1 Hawaii intranasally (n = 6) | P for standard route vs. intranasal |
|---|---|---|---|
| Days to fever onset | 6.4 (5.6–7.8) | 11.0 (9.3–11.9) | 0.001 |
| Maximum temperature (°C) | 39.6 (39.2–39.8) | 38.8 (38.2–39.3) | 0.028 |
| Fever duration (days > 38°C) | 3.4 (2.2–4.5) | 1.1 (0.7–3.1) | 0.071 |
| Days to leukopenia onset | 8.0 (7.0–9.0) | 10.5 (9.3–11.8) | 0.009 |
| Minimum WBC count/μL | 3,100 (2,525–3,600) | 3,350 (2,663–3,663) | 0.764 |
| Leukopenia duration (days < 4,500) | 4.0 (2.5–5.0) | 2.8 (1.0–3.8) | 0.088 |
Values are median (interquartile range). P values were calculated by using Wilcoxon's rank sum test. Values in bold are statistically significant.
Yellow fever vaccine 17D and DENV-1 infection.
Twenty subjects were inoculated with live attenuated 17D YF vaccine, followed by Hawaii DENV-1 at varying time intervals. Those persons who received the YF vaccine and DENV-1 simultaneously experienced an illness with delayed onset but comparable severity to those who received Hawaii DENV-1 only (Table 15). Median time to fever and leukopenia onset were 10.4 days and 11 days, respectively, compared with 6.4 days and 7 days in persons who were inoculated with Hawaii DENV-1 only (P < 0.001 and P = 0.009). Persons who received the YF vaccine, followed by DENV-1 inoculation at a three-day interval, also showed a trend towards a longer time to fever onset with median time of 9.1 days (P = 0.106), but the illness was otherwise similar to that in persons who did not receive the YF vaccine. There was no indication that temperature and leukopenia differed between those who received the YF vaccine and DENV-1 inoculation at 7-day or 1-month intervals and those who were inoculated with only Hawaii DENV-1.
Table 15.
Characteristics of primary DENV-1 Hawaii infections and infections in which persons received yellow fever vaccine 17D followed by DENV-1*
| Characteristic | Type of infection | P | |||||||
|---|---|---|---|---|---|---|---|---|---|
| DENV-1 Hawaii (n = 93) | YF + DENV | YF + DENV 3 days | YF + DENV 7 days | YF + DENV 1 month | DENV-1 Hawaii vs. YF + DENV | DENV-1 Hawaii vs. 3 days | DENV- 1 Hawaii vs. 7 days | DENV-1 Hawaii vs. 1 month | |
| Days to fever onset | 6.4 (5.6–7.8) | 10.4 (9.9–11.2) | 9.1 (7.8–10.2) | 6.6 (5.5–6.9) | 5.8 (5.5–6.2) | < 0.001 | 0.106 | 0.712 | 0.209 |
| Maximum temperature (°C) | 39.6 (39.2–39.8) | 39.9 (39.7–40.0) | 39.8 (39.6–40.0) | 39.2 (39.1–39.6) | 39.5 (39.4–39.8) | 0.117 | 0.309 | 0.527 | 0.775 |
| Fever duration | 3.4 (2.2–4.5) | 2.8 (2.5–3.5) | 3.3 (2.9–3.7) | 2.2 (1.8–2.8) | 4.2 (4.1–4.5) | 0.474 | 0.690 | 0.247 | 0.082 |
| Days to leukopenia onset | 8.0 (7.0–9.0) | 11.0 (10.5–12.5) | 9.5 (7.3–11.0) | 7.0 (6.5–13.5) | 7.0 (6.3–8.5) | 0.009 | 0.612 | 0.948 | 0.563 |
| Minimum WBC count/μL | 3,100 (2,525–3600) | 3,500 (2,500–3,675) | 3,350 (2,825–3,975) | 3,450 (2,900–4,125) | 2,700 (2,150–3,513) | 0.852 | 0.470 | 0.723 | 0.349 |
| Leukopenia duration | 4.0 (2.5–5.0) | 3.0 (2.0–3.0) | 3.5 (2.5–6.3) | 3.0 (1.5–3.5) | 3.5 (3.0–4.0) | 0.095 | 0.978 | 0.237 | 0.613 |
Values are median (interquartile range) P values were calculated by using Wilcoxon's rank sum test. Values in bold are statistically significant.
DENV = dengue virus; YF = yellow fever; WBC = white blood cell.
Symptoms were generally similar in subjects who received the YF vaccine and DENV-1 inoculation compared with those inoculated with DENV-1 alone. However, only 4 (57%) of 7 persons who received the YF vaccine and DENV-1 simultaneously had rash compared with 84 (91%) of 92 persons who were inoculated with only Hawaii DENV-1 (P = 0.006). Subjects who received the YF vaccine and DENV-1 inoculation at a three-day or seven-day interval were less likely to show development of petechiae than those who received Hawaii DENV-1 alone; 1 (25%) of 4 subjects with a three-day interval and 0 (0%) of 3 subjects with a seven-day interval showed development of petechiae compared with 66 (72%) of 92 subjects inoculated with Hawaii DENV-1 alone (P = 0.050 and P = 0.008).
Discussion
Although nearly 70 years have passed since these experiments were conducted by Sabin, the findings remain pivotal to our understanding of clinical dengue. Description of naturally occurring clinical cases are widely available.17–22 However, these studies lack detailed information on when the infection was acquired. Case-patients can only be enrolled upon presentation to primary care clinics and these are often a few days after illness onset. Moreover, although most dengue-endemic countries report secondary dengue cases,23 the serotype of the previous infection is seldom known or determined. Thus, even though naturally occurring cases are able to provide useful clinical description of dengue, they are limited in their ability to provide information on incubation period and how time after convalescence from a primary dengue infection influences the outcome of a secondary dengue infection.
There are several important findings from the experiments of Sabin. First, the often-cited observation is the short-lived protection against a secondary infection after recovery from a primary DENV infection.10 Estimates of the duration of cross-protection based on serologic data and on modeling of epidemics have varied from one to two weeks to a year or more.24–26 The data of Sabin suggest that the duration of cross-protection from a second clinical infection is approximately 8 weeks, but there is substantial individual variation. One subject showed development of a fever, leukopenia, and clinical symptoms of dengue after inoculation with DENV-1 at only 7 weeks 6 days post-primary infection with DENV-2, and another subject was afebrile and asymptomatic after inoculation with DENV-2 at 8 months post-primary infection with DENV-1. Because the longest time interval tested was nine months, it is unknown based on these experiments whether cross-protective immunity could persist for longer than nine months in some persons. In contrast, re-inoculation of three volunteers with the same virus used during primary infection 18 months before did not result in acute illness. The observed differences in duration of cross-protective immunity from a second clinical infection could be caused by viral factors and/or the host immune response.
The mechanism for this short-lived heterotypic immunity remains to be fully determined. It is possible that IgM that is present for a few months after an acute infection has heterotypic, as well as homotypic, neutralizing capability. Alternatively, the high levels of heterotypic and homotypic IgG against dengue could either aggregate DENV to form immune complexes of sufficient size to co-ligate the inhibitory Fc gamma receptor IIB27 or inhibit the co-ligation of leukocyte immunoglobulin-like receptor B1).28 Both receptors have an immunoreceptor tyrosine inhibitory motif that signals to either inhibit phagocytosis and thus entry of heterologous DENV27,29,30 or inhibit interferon stimulated gene expression that would otherwise limit viral replication.28,31
The secondary dengue infections in subjects tested by Sabin were clinically less severe than the primary infections. Patients who showed development of a clinical infection after secondary inoculation with dengue had a lower maximum temperature and an approximately two-day shorter duration of fever compared with primary infection. No subjects showed development of severe illness (dengue hemorrhagic fever or dengue shock syndrome). This finding is in contrast with the frequently reported association between secondary infection and more severe illness.26,32 Possible explanations for this discrepancy include the small sample size, and that the longest time period between primary and secondary infection in the study of Sabin was only nine months.
Other studies found that the risk of severe illness increases with time elapsed between primary and secondary infection.26,32 If the findings from the experiments of Sabin can be generalized, they would have important implications for the design of clinical trials to determine therapeutic efficacy of candidate antiviral drugs. The longer duration of fever in patients with primary dengue may make this group of patients more suitable for enrollment into therapeutic trials in which the duration of fever is a primary outcome.33,34 The more rapid fever clearance in secondary infection may require a larger cohort of patients to observe a statistically significant reduction in fever duration.35 This necessity not only increases cost but also the number of patients exposed to an investigational compound, and its safety profile remains to be fully determined.
Another notable finding in the experiments of Sabin was that the shortest incubation period was 3.2 days in a subject inoculated with Hawaii DENV-1-infected serum intravenously. In comparison, the shortest incubation period observed in historical DENV-1 human infection studies was approximately 3.5 days.11,36,37 Also, Sabin found that the incubation period for secondary infection was shorter by approximately three days compared with primary infection. It is unclear why this phenomenon was observed. It is tempting to speculate that antibody-dependent infection resulted in a more efficient pathway of infection although, in this study, there was no evidence of disease enhancement. Finally, patients infected intranasally had a longer incubation period. Of interest was that 50% (3 of 6) of these patients had nosebleeds compared with only 6% (5 of 84) of subjects infected by inoculation (P < 0.001), suggesting a direct viral effect on nasal endothelium. Previous modeling of dengue epidemics have mostly not taken into account possible differences in the intrinsic incubation period for primary and secondary infection.38,39 How a shorter incubation period affects the dynamics of dengue epidemics or even the overall cyclical nature of dengue incidence should be considered given that most dengue-endemic countries encounter secondary dengue infection. Furthermore, this finding could also influence the length of monitoring development of dengue in travelers after a visit to a dengue-endemic area.40
Sabin was able to demonstrate that the viral inoculum load is a determinant of fever, the duration to fever onset, and leukopenia. This information cannot be gleaned from epidemiologic studies on naturally occurring cases. Because viremia titers have been shown to correlate with severity of illness and epidemic potential,8,41 it stands to reason that the amount of virus inoculated by blood-feeding Aedes mosquitoes could also determine the clinical outcome of dengue. When designing human infection studies, consideration should be given to natural infection by mosquito bite.
The work of Sabin also highlights the need for biosafety practices. Although percutaneous injury with contaminated laboratory equipment or hypodermic syringes is an obvious route of accidental infection, these experimental infections also highlight the need to be vigilant against other routes of infection. In particular, inoculation through the conjunctiva or respiratory epithelium through accidental splashes or aerosolization of dengue virus culture supernatant can occur because of improper handling techniques and are viable routes for DENV infection. Biosafety practices that limit possible splashes or aerosolization of DENV are thus advisable.
A major weakness in these experiments is the lack of serologic or other immunologic measurements that would have complemented the detailed clinical observations. In particular, the study assumed, probably accurately, that none of the subjects had prior dengue or flaviviral infections. However, this assumption was not determined objectively with serologic methods. Moreover, serologic measurements would have also indicated whether those persons inoculated with dengue virus who did not show development of fever or leukopenia experienced true asymptomatic infection or represented failed experiments. Another weakness of these studies is the small number of subjects inoculated with DENV-2 (n = 14) or inoculated with a heterologous serotype after primary infection (n = 20). Furthermore, most heterologous infections at shorter time intervals were DENV-2 primary infections, followed by DENV-1 secondary infections, and most of the heterologous infections at longer time intervals were with DENV-1, followed by DENV-2. These inconsistencies make it difficult to interpret the results. It has been suggested that patients with DENV-2 infections experience more severe disease,41–43 and that a primary infection with DENV-1, followed a secondary infection with DENV-2, is associated with an increased risk of dengue hemorrhagic fever.32 The subjects of Sabin with primary DENV-2 infection had a slightly shorter duration of fever but their illnesses were otherwise similar to subjects with primary DENV-1 infection. No differences were found in the severity of illness in subjects who were inoculated with DENV-1, followed by DENV-2, compared with subjects inoculated with DENV-2, followed by DENV-1. A larger sample size would be required to detect differences between these groups, if they exist. Furthermore, with the accumulating evidence that the strain of virus also influences clinical severity,7–9 these types of studies must include different virus strains to be meaningful.
There is now increasing interest in revisiting human challenge studies for dengue for the evaluation of vaccines and therapeutics.44–46 The work of Sabin indicates that human challenge studies can be conducted safely. None of the 243 subjects showed development of severe dengue. A reason for this finding could be that these studies were all conducted in adults. Adults may have a lower risk for development of plasma leakage, which is common in severe dengue cases.47–49 Conversely, children might be predisposed to plasma leakage because growing blood vessels, which are present during that age, are inherently leaky.50 Given that human challenge studies will need to be conducted in adults who can provide informed consent, such studies could serve as a critical platform for the rapid evaluation of therapeutic or vaccine candidates.45,46 In particular, illness onset can be carefully monitored after virus inoculation, and this could either signal an end-point for vaccine studies or a much more controlled initiation of the first dose of a therapeutic agent. Importantly, the duration and the size of the study population would be reduced significantly. The world would not have to wait years and companies would not have to spend millions of dollars to know that a candidate vaccine does not work.
It is important to note that the experimental subjects of Sabin included psychiatric patients and prison inmates. These groups would today be considered protected populations as described in the Belmont Report on Ethical Principles and Guidelines for the Protection of Human Subjects of Research.51 If human dengue challenge studies were to be conducted today, they would need to be designed differently to meet ethical standards.
In conclusion, the studies on dengue carried out by Sabin in 1944–1945 remain an important contribution to the dengue literature and many of the seminal data remain the only available information on several facets of dengue infection. We present a detailed analysis of the human experiments of Sabin and, for the first time, provide access to clinical details on the infected subjects involved.
ACKNOWLEDGMENTS
We acknowledge Albert Sabin and the persons who participated in the experiments reported.
Footnotes
Authors' addresses: Grace E. Snow, Duke University School of Medicine, Durham, NC, E-mail: grace.e.snow@gmail.com. Benjamin Haaland, Office of Clinical Sciences, Duke–National University of Singapore Graduate Medical School, Singapore, E-mail: benjamin.haaland@duke-nus.edu.sg. Eng Eong Ooi, Program in Emerging Infectious Diseases, Duke–National University of Singapore Graduate Medical School, Singapore, E-mail: engeong.ooi@duke-nus.edu.sg. Duane J. Gubler, Program on Emerging Infectious Diseases, Duke–National University of Singapore Graduate Medical School, Singapore, and 2139 Onyx Way, St. George, UT, E-mail: duane.gubler@duke-nus.edu.sg.
References
- 1.Bhatt S, Gething PW, Brady OJ, Messina JP, Farlow AW, Moyes CL, Drake JM, Brownstein JS, Hoen AG, Sankoh O, Myers MF, George DB, Jaenisch T, Wint GR, Simmons CP, Scott TW, Farrar JJ, Hay SI. The global distribution and burden of dengue. Nature. 2013;496:504–507. doi: 10.1038/nature12060. [DOI] [PMC free article] [PubMed] [Google Scholar]
- 2.Halstead SB. Pathogenesis of dengue: challenges to molecular biology. Science. 1988;239:476–481. doi: 10.1126/science.3277268. [DOI] [PubMed] [Google Scholar]
- 3.Murphy BR, Whitehead SS. Immune response to dengue virus and prospects for a vaccine. Annu Rev Immunol. 2011;29:587–619. doi: 10.1146/annurev-immunol-031210-101315. [DOI] [PubMed] [Google Scholar]
- 4.Bentsi-Enchill AD, Schmitz J, Edelman R, Durbin A, Roehrig JT, Smith PG, Hombach J, Farrar J. Long-term safety assessment of live attenuated tetravalent dengue vaccines: deliberations from a WHO technical consultation. Vaccine. 2013;31:2603–2609. doi: 10.1016/j.vaccine.2013.03.038. [DOI] [PMC free article] [PubMed] [Google Scholar]
- 5.Zompi S, Harris E. Animal models of dengue virus infection. Viruses. 2012;4:62–82. doi: 10.3390/v4010062. [DOI] [PMC free article] [PubMed] [Google Scholar]
- 6.Khor CC, Chau TN, Pang J, Davila S, Long HT, Ong RT, Dunstan SJ, Wills B, Farrar J, Van Tram T, Gan TT, Binh NT, Tri le T, Lien le B, Tuan NM, Tham NT, Lanh MN, Nguyet NM, Hieu NT, Van NV, Thuy TT, Tan DE, Sakuntabhai A, Teo YY, Hibberd ML, Simmons CP. Genome-wide association study identifies susceptibility loci for dengue shock syndrome at MICB and PLCE1. Nat Genet. 2011;43:1139–1141. doi: 10.1038/ng.960. [DOI] [PMC free article] [PubMed] [Google Scholar]
- 7.Bennett SN, Holmes EC, Chirivella M, Rodriguez DM, Beltran M, Vorndam V, Gubler DJ, McMillan WO. Selection-driven evolution of emergent dengue virus. Mol Biol Evol. 2003;20:1650–1658. doi: 10.1093/molbev/msg182. [DOI] [PubMed] [Google Scholar]
- 8.Gubler DJ, Reed D, Rosen L, Hitchcock JR., Jr Epidemiologic, clinical, and virologic observations on dengue in the Kingdom of Tonga. Am J Trop Med Hyg. 1978;27:581–589. doi: 10.4269/ajtmh.1978.27.581. [DOI] [PubMed] [Google Scholar]
- 9.Steel A, Gubler DJ, Bennett SN. Natural attenuation of dengue virus type-2 after a series of island outbreaks: a retrospective phylogenetic study of events in the South Pacific three decades ago. Virology. 2010;405:505–512. doi: 10.1016/j.virol.2010.05.033. [DOI] [PMC free article] [PubMed] [Google Scholar]
- 10.Sabin AB. Research on dengue during World War II. Am J Trop Med Hyg. 1952;1:30–50. doi: 10.4269/ajtmh.1952.1.30. [DOI] [PubMed] [Google Scholar]
- 11.Siler JF, Hall MW, Hitchens AP. Dengue: its history, epidemiology, mechanism of transmission, etiology, clinical manifestations, immunity, and prevention. Philipp J Sci. 1926;29:1–304. [Google Scholar]
- 12.Simmons JS, John JHS, Reynolds FH. Experimental studies of dengue. Philipp J Sci. 1931;44:1–247. [Google Scholar]
- 13.Wahala WM, Silva AM. The human antibody response to dengue virus infection. Viruses. 2011;3:2374–2395. doi: 10.3390/v3122374. [DOI] [PMC free article] [PubMed] [Google Scholar]
- 14.Rasmussen CE, Williams CK. Gaussian Processes for Machine Learning. Boston, MA: MIT Press; 2006. [Google Scholar]
- 15.Gubler DJ. Dengue. In: Monath TP, editor. The Arboviruses: Epidemiology and Ecology. Volume II. Boca Raton, FL: CRC Press, Inc.; 1988. pp. 223–260. [Google Scholar]
- 16.Simpson WM. Artificial fever therapy of syphilis and gonococcic infections. Br J Vener Dis. 1936;12:133–166. doi: 10.1136/sti.12.3.133. [DOI] [PMC free article] [PubMed] [Google Scholar]
- 17.Low JG, Ooi EE, Tolfvenstam T, Leo YS, Hibberd ML, Ng LC, Lai YL, Yap GS, Li CS, Vasudevan SG, Ong A. Early dengue infection and outcome study (EDEN): study design and preliminary findings. Ann Acad Med Singapore. 2006;35:783–789. [PubMed] [Google Scholar]
- 18.Binh PT, Matheus S, Huong VT, Deparis X, Marechal V. Early clinical and biological features of severe clinical manifestations of dengue in Vietnamese adults. J Clin Virol. 2009;45:276–280. doi: 10.1016/j.jcv.2009.04.004. [DOI] [PubMed] [Google Scholar]
- 19.Ramos MM, Tomashek KM, Arguello DF, Luxemburger C, Quinones L, Lang J, Munoz-Jordan JL. Early clinical features of dengue infection in Puerto Rico. Trans R Soc Trop Med Hyg. 2009;103:878–884. doi: 10.1016/j.trstmh.2008.11.009. [DOI] [PubMed] [Google Scholar]
- 20.Chau TN, Anders KL, Lien le B, Hung NT, Hieu LT, Tuan NM, Thuy TT, Phuong le T, Tham NT, Lanh MN, Farrar JJ, Whitehead SS, Simmons CP. Clinical and virological features of dengue in Vietnamese infants. PLoS Negl Trop Dis. 2010;4:e657. doi: 10.1371/journal.pntd.0000657. [DOI] [PMC free article] [PubMed] [Google Scholar]
- 21.Low JG, Ong A, Tan LK, Chaterji S, Chow A, Lim WY, Lee KW, Chua R, Chua CR, Tan SW, Cheung YB, Hibberd ML, Vasudevan SG, Ng LC, Leo YS, Ooi EE. The early clinical features of dengue in adults: challenges for early clinical diagnosis. PLoS Negl Trop Dis. 2011;5:e1191. doi: 10.1371/journal.pntd.0001191. [DOI] [PMC free article] [PubMed] [Google Scholar]
- 22.Biswas HH, Ortega O, Gordon A, Standish K, Balmaseda A, Kuan G, Harris E. Early clinical features of dengue virus infection in nicaraguan children: a longitudinal analysis. PLoS Negl Trop Dis. 2012;6:e1562. doi: 10.1371/journal.pntd.0001562. [DOI] [PMC free article] [PubMed] [Google Scholar]
- 23.Wilder-Smith A, Ooi EE, Vasudevan SG, Gubler DJ. Update on dengue: epidemiology, virus evolution, antiviral drugs, and vaccine development. Curr Infect Dis Rep. 2010;12:157–164. doi: 10.1007/s11908-010-0102-7. [DOI] [PubMed] [Google Scholar]
- 24.Reich NG, Shrestha S, King AA, Rohani P, Lessler J, Kalayanarooj S, Yoon IK, Gibbons RV, Burke DS, Cummings DA. Interactions between serotypes of dengue highlight epidemiological impact of cross-immunity. J R Soc Interface. 2013;10(20130414) doi: 10.1098/rsif.2013.0414. [DOI] [PMC free article] [PubMed] [Google Scholar]
- 25.Nishiura H. Duration of short-lived cross-protective immunity against a clinical attack of dengue: a preliminary estimate. Dengue Bull. 2008;32:55–66. [Google Scholar]
- 26.Anderson KB, Gibbons RV, Cummings DA, Nisalak A, Green S, Libraty DH, Jarman RG, Srikiatkhachorn A, Mammen MP, Darunee B, Yoon IK, Endy TP. A shorter time interval between first and second dengue infections is associated with protection from clinical illness in a school-based cohort in Thailand. J Infect Dis. 2014;209:360–368. doi: 10.1093/infdis/jit436. [DOI] [PMC free article] [PubMed] [Google Scholar]
- 27.Chan KR, Zhang SL, Tan HC, Chan YK, Chow A, Lim AP, Vasudevan SG, Hanson BJ, Ooi EE. Ligation of Fc gamma receptor IIB inhibits antibody-dependent enhancement of dengue virus infection. Proc Natl Acad Sci USA. 2011;108:12479–12484. doi: 10.1073/pnas.1106568108. [DOI] [PMC free article] [PubMed] [Google Scholar]
- 28.Chan KR, Ong EZ, Tan HC, Zhang SL, Zhang Q, Tang KF, Kaliaperumal N, Lim AP, Hibberd ML, Chan SH, Connolly JE, Krishnan M, Lok SM, Hanson BJ, Lin CN, Ooi EE. Leukocyte immunoglobulin-like receptor B1 is critical for antibody-dependent dengue. Proc Natl Acad Sci USA. 2014;111:2722–2727. doi: 10.1073/pnas.1317454111. [DOI] [PMC free article] [PubMed] [Google Scholar]
- 29.Wu RS, Chan KR, Tan HC, Chow A, Allen JC, Jr, Ooi EE. Neutralization of dengue virus in the presence of Fc receptor-mediated phagocytosis distinguishes serotype-specific from cross-neutralizing antibodies. Antiviral Res. 2012;96:340–343. doi: 10.1016/j.antiviral.2012.09.018. [DOI] [PubMed] [Google Scholar]
- 30.Boonnak K, Slike BM, Donofrio GC, Marovich MA. Human FcgammaRII cytoplasmic domains ifferentially influence antibody-mediated dengue virus infection. J Immunol. 2013;190:5659–5665. doi: 10.4049/jimmunol.1203052. [DOI] [PMC free article] [PubMed] [Google Scholar]
- 31.Nimmerjahn F, Lux A. LILR-B1 blocks activating FcγR signaling to allow antibody dependent enhancement of dengue virus infection. Proc Natl Acad Sci USA. 2014;111:2404–2405. doi: 10.1073/pnas.1324286111. [DOI] [PMC free article] [PubMed] [Google Scholar]
- 32.Guzman MG, Kouri G, Valdes L, Bravo J, Vazquez S, Halstead SB. Enhanced severity of secondary dengue-2 infections: death rates in 1981 and 1997 Cuban outbreaks. Rev Panam Salud Publica. 2002;11:223–227. doi: 10.1590/s1020-49892002000400003. [DOI] [PubMed] [Google Scholar]
- 33.Tricou V, Ninh NN, Vani TP, Lee SJ, Farrar J, Wills B, Tran HT, Simmons CP. A randomized controlled trial of chloroquine for the treatment of dengue in Vietnamese adults. PLoS Negl Trop Dis. 2010;4:e785. doi: 10.1371/journal.pntd.0000785. [DOI] [PMC free article] [PubMed] [Google Scholar]
- 34.Nguyen NM, Tran CN, Phung LK, Duong KT, Huynh Hle A, Farrar J, Nguyen QT, Tran HT, Nguyen CV, Merson L, Hoang LT, Hibberd ML, Aw PP, Wilm A, Nagarajan N, Nguyen DT, Pham MP, Nguyen TT, Javanbakht H, Klumpp K, Hammond J, Petric R, Wolbers M, Nguyen CT, Simmons CP. A randomized, double-blind placebo controlled trial of balapiravir, a polymerase inhibitor, in adult dengue patients. J Infect Dis. 2013;207:1442–1450. doi: 10.1093/infdis/jis470. [DOI] [PMC free article] [PubMed] [Google Scholar]
- 35.Tricou V, Minh NN, Farrar J, Tran HT, Simmons CP. Kinetics of viremia and NS1 antigenemia are shaped by immune status and virus serotype in adults with dengue. PLoS Negl Trop Dis. 2011;5:e1309. doi: 10.1371/journal.pntd.0001309. [DOI] [PMC free article] [PubMed] [Google Scholar]
- 36.Nishiura H, Halstead SB. Natural history of dengue virus (DENV)-1 and DENV-4 infections: reanalysis of classic studies. J Infect Dis. 2007;195:1007–1013. doi: 10.1086/511825. [DOI] [PubMed] [Google Scholar]
- 37.Halstead SB. Etiologies of the experimental dengues of Siler and Simmons. Am J Trop Med Hyg. 1974;23:974–982. doi: 10.4269/ajtmh.1974.23.974. [DOI] [PubMed] [Google Scholar]
- 38.Focks DA, Daniels E, Haile DG, Keesling JE. A simulation model of the epidemiology of urban dengue fever: literature analysis, model development, preliminary validation, and samples of simulation results. Am J Trop Med Hyg. 1995;53:489–506. doi: 10.4269/ajtmh.1995.53.489. [DOI] [PubMed] [Google Scholar]
- 39.Chan M, Johansson MA. The incubation periods of dengue viruses. PLoS ONE. 2012;7:e50972. doi: 10.1371/journal.pone.0050972. [DOI] [PMC free article] [PubMed] [Google Scholar]
- 40.Wilder-Smith A, Schwartz E. Dengue in travelers. N Engl J Med. 2005;353:924–932. doi: 10.1056/NEJMra041927. [DOI] [PubMed] [Google Scholar]
- 41.Vaughn DW, Green S, Kalayanarooj S, Innis BL, Nimmannitya S, Suntayakorn S, Endy TP, Raengsakulrach B, Rothman AL, Ennis FA, Nisalak A. Dengue viremia titer, antibody response pattern, and virus serotype correlate with disease severity. J Infect Dis. 2000;181:2–9. doi: 10.1086/315215. [DOI] [PubMed] [Google Scholar]
- 42.Burke DS, Nisalak A, Johnson DE, Scott RM. A prospective study of dengue infections in Bangkok. Am J Trop Med Hyg. 1988;38:172–180. doi: 10.4269/ajtmh.1988.38.172. [DOI] [PubMed] [Google Scholar]
- 43.Sangkawibha N, Rojanasuphot S, Ahandrik S, Viriyapongse S, Jatanasen S, Salitul V, Phanthumachinda B, Halstead SB. Risk factors in dengue shock syndrome: a prospective epidemiologic study in Rayong, Thailand. I. The 1980 outbreak. Am J Epidemiol. 1984;120:653–669. doi: 10.1093/oxfordjournals.aje.a113932. [DOI] [PubMed] [Google Scholar]
- 44.Sun W, Eckels KH, Putnak JR, Lyons AG, Thomas SJ, Vaughn DW, Gibbons RV, Fernandez S, Gunther VJ, Mammen MP, Jr, Statler JD, Innis BL. Experimental dengue virus challenge of human subjects previously vaccinated with live attenuated tetravalent dengue vaccines. J Infect Dis. 2013;207:700–708. doi: 10.1093/infdis/jis744. [DOI] [PubMed] [Google Scholar]
- 45.Durbin AP, Whitehead SS. The dengue human challenge model: has the time come to accept this challenge? J Infect Dis. 2013;207:697–699. doi: 10.1093/infdis/jis749. [DOI] [PubMed] [Google Scholar]
- 46.Thomas SJ. Dengue human infection model: re-establishing a tool for understanding dengue immunology and advancing vaccine development. Hum Vaccin Immunother. 2013;9:1587–1590. doi: 10.4161/hv.24188. [DOI] [PubMed] [Google Scholar]
- 47.Guzman MG, Kouri G, Bravo J, Valdes L, Vazquez S, Halstead SB. Effect of age on outcome of secondary dengue 2 infections. Int J Infect Dis. 2002;6:118–124. doi: 10.1016/s1201-9712(02)90072-x. [DOI] [PubMed] [Google Scholar]
- 48.Ooi EE, Goh KT, Chee Wang DN. Effect of increasing age on the trend of dengue and dengue hemorrhagic fever in Singapore. Int J Infect Dis. 2003;7:231–232. doi: 10.1016/s1201-9712(03)90057-9. [DOI] [PubMed] [Google Scholar]
- 49.Hammond SN, Balmaseda A, Perez L, Tellez Y, Saborio SI, Mercado JC, Videa E, Rodriguez Y, Perez MA, Cuadra R, Solano S, Rocha J, Idiaquez W, Gonzalez A, Harris E. Differences in dengue severity in infants, children, and adults in a 3-year hospital-based study in Nicaragua. Am J Trop Med Hyg. 2005;73:1063–1070. [PubMed] [Google Scholar]
- 50.Gamble J, Bethell D, Day NP, Loc PP, Phu NH, Gartside IB, Farrar JF, White NJ. Age-related changes in microvascular permeability: a significant factor in the susceptibility of children to shock? Clin Sci (Lond) 2000;98:211–216. [PubMed] [Google Scholar]
- 51.The National Commission for the Protection of Human Subjects of Biomedical and Behavioral Research . The Belmont Report: Ethical Principles and Guidelines for the Protection of Human Subjects of Research. Washington, DC: U.S. Department of Health and Human Services; 1979. [PubMed] [Google Scholar]