

Abstract
Background
Levels of the cyclooxygenase 2 (COX-2) enzyme are elevated in breast cancer tissue, and most COX-2 effects are believed to be mediated through overproduction of prostaglandin-E2 (PGE2). We evaluated associations between the primary urinary metabolite of PGE2 (PGE-M) and breast cancer risk.
Methods
A nested case-control study of 504 cases and 1,082 controls was conducted using data from the Shanghai Women’s Health Study, a large population-based prospective cohort study of 74,941 Chinese women. Urinary PGE-M was measured using a liquid chromatography/tandem mass spectrometric method. Logistic regression estimated odds ratios (OR) and 95% confidence intervals (95%CI), with adjustment for potential confounders.
Results
Overall, no association between urinary PGE-M and breast cancer was detected. However, a suggestive positive association was found among postmenopausal women. In particular, a clear dose-response relationship between urinary PGE-M and breast cancer was observed among postmenopausal women with a BMI<25 kg/m2 (P for linear trend = 0.005). Among these women, risk of breast cancer increased from 1.00 (reference) to 1.06 (95% CI: 0.56–1.99), 1.50 (95% CI: 0.79–2.83), and 2.32 (95% CI: 1.24–4.41) for the lowest to highest quartiles of PGE-M, and such associations were stronger among those who were diagnosed with cancer within the first 4 years of sample collection. No apparent association was observed among overweight postmenopausal women (BMI≥25 kg/m2).
Conclusion
High urinary PGE-M level was associated with elevated risk of breast cancer among normal weight, postmenopausal women.
Impact
Urinary PGE-M level may be useful for breast cancer risk assessment among normal weight, postmenopausal women.
Keywords: breast cancer, prostaglandin E2 metabolite, biomarker, postmenopausal Chinese women, body mass index
Introduction
Breast cancer is the most common cancer and a leading cause of cancer-related mortality among women worldwide (1, 2). Cumulative evidence suggests that cyclooxygenase 2 (COX-2) plays an important role in the tumorigenesis of several cancers, including breast cancer. COX-2 is the rate-limiting enzyme of prostaglandin synthesis, and overexpression of the COX-2 gene can lead to increased prostaglandin-E2 (PGE2) production. PGE2 is a key mediator of inflammation and plays an important role in carcinogenesis (3–5). Experimental and animal model studies have found that overproduction of PGE2 can induce epithelial cell proliferation and angiogenesis and inhibit immunosurveillance and cell apoptosis (6–10). In humans, COX-2 overexpression has been observed in approximately 40% of cases of invasive breast carcinoma and at a higher frequency in pre-invasive ductal carcinoma in situ (DCIS, Stage 0) tumors, but not in normal breast tissue (11). Epidemiologic studies have shown that use of nonsteroidal anti-inflammatory drugs (NSAIDs) may be associated with reduced breast cancer risk (12–14). The protective effects of NSAIDs are thought to be mediated largely through COX-2 inhibition, which in turn reduces PGE2 production. Thus, COX-2–derived PGE2 may reflect inflammation status and related cancer risk. Because PGE2 is an unstable compound that is rapidly metabolized in vivo to a stable metabolite, 11 alpha-hydroxy-9,15-dioxo-2,3,4,5-tetranorprostane-1,20-dioic acid (PGE-M), the measurement of excreted urinary PGE-M is used to quantify systemic PGE2 production in vivo (15). It has been hypothesized that urinary PGE-M might serve as a promising biomarker for predicting cancer risk, including breast cancer risk (15–17).
Obesity is a known risk factor for postmenopausal breast cancer and is also considered a chronic inflammatory condition (18, 19). In vitro experiments and human studies have shown that excessive fat accumulation in breast adipose tissues may activate PGE2-mediated aromatase and increase estrogen biosynthesis (20, 21). However, no study to date has investigated possible modifying effect of adiposity on the relationship between PGE-M and breast cancer risk. In this report, we use data from a prospective cohort study to evaluate the association of urinary PGE-M levels with breast cancer and further examine whether this association is modified by body mass index (BMI), a measure routinely used to quantify adiposity.
Materials and Methods
Study population
The Shanghai Women’s Health Study (SWHS) is a large population-based prospective cohort study currently on-going in Shanghai, China. The study was approved by the institutional review boards of all collaborating institutions, and all participants provided written informed consent. The methodology for the SWHS has been described in detail previously (22). Briefly, from 1997 to 2000, 74,941 Chinese women aged 40–70 years and residing in Shanghai were recruited into the study. At the time of enrollment, each woman completed an in-person survey conducted by trained interviewers. The participation rate for the baseline survey was 93%. Data collected at the baseline survey included socio-demographics, menstrual and reproductive history, usual dietary intakes and other lifestyle factors, medical history and medication use, and family history of cancers, including breast cancer, among first-degree relatives. For this analysis, we defined “regular users of aspirin” as individuals taking any aspirin three or more times a week for a minimum duration of two consecutive months, “ever regular smokers” as individuals who had smoked one or more cigarettes a day for a minimum duration of six consecutive months, “ever consumed alcohol regularly” as consuming alcohol at least three times a week over a duration of at least six consecutive months, and “regular physical activity” as doing physical exercise one or more times a week for at least three consecutive months. Body measurements were also taken. BMI was calculated as body weight in kilograms divided by height in meters squared (kg/m2 ) and was categorized as underweight and normal weight (< 25 kg/m2 ), overweight (25–29.9 kg/m2 ), and obese (≥30 kg/m2 ) based on the World Health Organization’s (WHO) definitions (22). We also used proposed BMI cut point for Asians to define overweight (≥ 23 kg/m2) (23). Of the study participants, 65,754 (88%) provided a spot urine sample. Urine samples were collected into a sterilized cup containing 125 mg ascorbic acid to prevent oxidation of labile metabolites. After collection, the samples were kept in a portable Styrofoam box with ice packs (at approximately 0 to 4°C) and processed within 6 hours for long-term storage at −70°C. Each woman also filled out a biospecimen collection form at the time of sample collection, which included the date and time of sample collection, time of last meal, and day of last menstruation (for premenopausal women), as well as intake of selected foods, smoking habits, and use of any medications over the previous 24 hours and during the previous week.
The cohort has been followed using a combination of in-person surveys, record linkage to cancer incidence and mortality data collected by the Shanghai Cancer Registry, and death certificate data collected by the Shanghai Vital Statistics Unit. Follow-up surveys of all living cohort members or next of kin for deceased participants have been conducted by in-person interview with participation rates of 99.8% (2000–2002), 98.7% (2002–2004), 95.0% (2004–2006), and 91.9% (2007–2011). For cohort members who were diagnosed with cancer, medical charts were reviewed to verify the diagnosis, and detailed information on the pathology characteristics of the cancer was obtained.
This nested case-control study was conducted as part of a large project including breast and other cancers. Included in this study were 560 incident breast cancer cases identified during follow-up of the cohort through December 2009 who had provided a urine sample at baseline for PGE-M measurement. The median interval between urine sample collection and breast cancer diagnosis was 4.1 years. Using the incidence-density sampling method, we individually matched each case with 1 or 2 controls randomly selected from cohort members who were free of any cancer at the time the index case was diagnosed. A total of 645 controls were identified and cases and controls were matched on age (≤2 years), menopausal status (pre- or post-menopause), date (≤30 days) and time (morning or afternoon) at sample collection. To increase statistical power, we also included 563 controls selected for other cancers for the current analysis. We excluded all cases (n = 56) and controls (n =126) who ever used NSAIDs regularly or used NSAIDs within 7 days before urine sample collection. Thus, data from 1,586 women (504 cases and 1082 controls) were finally used for the analysis.
Urinary PGE-M measurement
Measurement of urinary PGE-M concentration was performed using a liquid chromatography/tandem mass spectrometric (LC-MS) method described previously (16, 17). Briefly, 0.5 mL urine was acidified to pH 3 with 1N HCl after addition of 10 ng internal standard, tetranor prostaglandin E metabolite-d6 (tetranor-PGEM-d6) containing six deuterium atoms at the 13, 13′, 14, 14′, 15, and 15′ positions (Cayman Chemical Co., Ann Arbor, MI). Endogenous PGE-M and the internal standard were then converted to the O-methyloxime derivative by treatment with methyloxime HCl at 37°C for 30 min. The methoximated PGE-M was purified by solid phase extraction on a C-18 Sep-Pak. LC was performed on a Kinetix C18 column (2.6 μ, 100 A, 2.1 x150 mm, Phenomenex, Torrence, CA) attached to an Accela UPLC Pump (Thermo Scientific, San Jose, CA). MS detection was carried out on a TSQ Vantage triple quadrupole mass spectrometer in the multiple reaction monitoring (MRM) mode. The transition from m/z 385.2 to 336.2 was used for PGE-M, and m/z 391.2 to 342.2 was used for the deuterated internal standard. The lower limit of detection of PGE-M was in the range of 40 pg, approximately 100-fold below levels in normal human urine. The coefficient of variation for samples analyzed in multiple batches was 3.13% and for intra batch samples was 2.86%. We used the Jaffe method to measure urinary creatinine concentration by using a kit from Nanjing Jiancheng (Nanjing, China). Laboratory staff is blinded to the case-control status of the urine samples and to the identity of the quality control samples included in the study.
Statistical Analyses
Urinary PGE-M level in each sample was standardized using urinary creatinine level of the sample and expressed in ng/mg creatinine (ng/mg Cr). Data for PGE-M ratios were skewed to the high value and thus log-transformation was used to improve normality. Geometric means of PGE-M levels were calculated, and ANOVA was applied to compare log-transformed PGE-M levels among different categories/subgroups of each variable of interest for difference. The distribution of PGE-M levels among controls was used to determine cut-points for quartiles. Unconditional logistic regression models were used to estimate the risk of breast cancer associated with urinary PGE-M levels and to derive P values for linear trends by modeling the log-transformed urinary PGE-M levels as a continuous variable. Interaction terms were included in the models to test for interaction between PGE-M and variables of interest (body mass index and menopausal status). All analyses were conducted using SAS version 9.1 (SAS Institute, Cary, NC). All statistical tests were based on 2-sided probability.
Results
Baseline characteristics of breast cancer cases and controls are presented in Table 1. On average, cases were slightly younger (53.4 vs. 55.0), less educated, younger at menarche, and older at first live birth. More cases than controls had a family history of breast cancer and a shorter duration of breastfeeding. Only a small number of study participants ever regularly drank alcohol, smoked cigarettes, or took hormone replacement therapy (HRT).
Table 1.
Baseline characteristics of breast cancer cases and controls, Shanghai Women’s Health Study (1997–2000)
| Characteristics | Cases (N = 504) | Controls (N =1,082) | P for differencea |
|---|---|---|---|
| Age (years, mean±SD) | 53.4 ± 9.0 | 55.0 ± 9.0 | 0.001 |
| Education ≥ high school (%) | 48.8 | 61.8 | < 0.001 |
| Postmenopausal (%) | 48.6 | 55.7 | 0.008 |
| Family history of breast cancer (%) | 4.8 | 1.6 | < 0.001 |
| Body mass index (among postmenopausal women, %) | 24.9 ± 3.6 | 24.8 ± 3.7 | 0.618 |
| Regular physical activity (%) | 34.7 | 38.1 | 0.198 |
| Ever consumed alcohol regularly (%) | 1.8 | 2.5 | 0.377 |
| Ever smoked cigarette regularly (%) | 1.4 | 3.1 | 0.050 |
| Age at menarche (years, mean±SD) | 14.7 ± 1.7 | 15.0 ± 1.7 | 0.019 |
| Age at first live birth (years, mean±SD) among parous women | 26.4 ± 4.2 | 25.4 ± 4.3 | < 0.001 |
| Number of live births (mean±SD) among parous women | 1.7 ±1.0 | 2.0 ±1.2 | < 0.001 |
| Breastfeeding (months, mean±SD) among parous women | 13.3 ± 14.9 | 18.5 ± 19.6 | < 0.001 |
| Age at menopause (years, mean±SD) among postmenopausal women | 49.1 ± 4.8 | 49.2 ± 3.9 | 0.848 |
| Use of hormone replacement therapy (%) | 2.4 | 1.9 | 0.749 |
P-values derive from t-tests for continuous variables or Chi-squared tests for categorical variables
Body mass index (BMI) was positively associated with urinary PGE-M among both pre- and postmenopausal women, while age and education showed a positive association with urinary PGE-M only among postmenopausal women (Table 2). Among postmenopausal women, urinary levels of PGE-M were higher among smokers than among non-smokers, although the association was not statistically significant, possibly due to a small sample size. Family history of breast cancer, regular physical activity, age at menarche, age at first live birth, number of live births, and breastfeeding were not significantly associated with PGE-M level.
Table 2.
Influence of selected factors on urinary PGE-M level (ng/mg Cr) among controls by menopausal status
| Variables | Postmenopausal controls (n = 603) | Premenopausal controls (n = 479) | ||||
|---|---|---|---|---|---|---|
| No. | Geometric Mean (SD) | P valuea | No. | Geometric Mean (SD) | P valuea | |
| Age at sample collectionb | ||||||
| ≤45 | 4 | 6.46 (1.621) | 188 | 8.31 (1.61) | ||
| 46–50 | 13 | 9.31 (1.45) | 198 | 8.71 (1.54) | ||
| 51–55 | 77 | 10.38 (1.47) | 88 | 9.69 (1.60) | ||
| 56–60 | 122 | 11.20 (1.65) | < 0.001 | 5 | 8.73 (1.34) | 0.081 |
| 61–65 | 169 | 11.25 (1.64) | ||||
| >65 | 218 | 13.14 (1.60) | ||||
| Educationc | ||||||
| < High school | 215 | 10.72 (1.62) | 198 | 8.40 (1.55) | ||
| ≥ High school | 388 | 12.26 (1.61) | 0.048 | 281 | 8.95 (1.60) | 0.121 |
| Body mass index (BMI, kg/m2)d | ||||||
| <25 | 333 | 11.34 (1.56) | 339 | 8.35 (1.53) | ||
| 25–29.9 | 215 | 11.85 (1.64) | 0.020 | 124 | 9.37 (1.69) | 0.001 |
| ≥30 | 55 | 14.03 (1.84) | 16 | 12.63 (1.76) | ||
| Cigarette smoking status d | ||||||
| Non-smokers | 580 | 11.59 (1.60) | 469 | 8.68 (1.58) | ||
| Ever-smokers | 23 | 14.41 (1.89) | 0.111 | 10 | 10.63 (1.77) | 0.193 |
| Regular physical activity d | ||||||
| No | 316 | 11.26 (1.58) | 354 | 8.76 (1.58) | ||
| Yes | 287 | 12.15 (1.64) | 0.113 | 125 | 8.58 (1.58) | 0.638 |
| Family history of breast cancer d | ||||||
| No | 592 | 11.65 (1.61) | 473 | 8.90 (1.58) | ||
| Yes | 11 | 13.79 (1.79) | 0.196 | 6 | 8.28 (1.96) | 0.756 |
| Age at menarche d | ||||||
| ≤12 | 33 | 10.82 (1.90) | 28 | 7.85 (1.44) | ||
| 13–15 | 323 | 11.47 (1.59) | 0.904 | 298 | 8.48 (1.57) | 0.086 |
| >15 | 247 | 12.09 (1.61) | 152 | 9.37 (1.62) | ||
| Age at first live birth d | ||||||
| <25 | 377 | 12.22 (1.62) | 89 | 9.39 (1.51) | ||
| 26–30 | 166 | 10.83 (1.60) | 0.384 | 294 | 8.60 (1.62) | 0.469 |
| >30 | 45 | 10.71 (1.70) | 84 | 8.32 (1.55) | ||
| Number of live births d | ||||||
| 0 | 15 | 11.39 (1.35) | 12 | 9.60 (1.43) | ||
| 1 | 93 | 10.17 (1.62) | 0.561 | 405 | 8.47 (1.59) | 0.049 |
| ≥2 | 495 | 12.0 (1.62) | 62 | 10.36 (1.47) | ||
| Breastfeeding (months)e | ||||||
| ≤ Median | 290 | 10.80 (1.60) | 253 | 8.67 (1.60) | ||
| > Median | 298 | 12.60 (1.63) | 0.095 | 214 | 8.73 (1.57) | 0.633 |
P-values derived from ANOVA.
Age at sample collection was not adjusted;
Education was adjusted for age at sample collection;
BMI, cigarette smoking status, regular physical activity, family history of breast cancer, age at menarche, age at first live birth, number of live births, and breastfeeding were adjusted for age at sample collection and education.
Breastfeeding: among postmenopausal women, median = 23 months; among premenopausal women, median = 8 months.
Overall, no association was observed between urinary levels of PGE-M and breast cancer (Table 3). However, in analyses stratified by menopausal status and BMI (< 25 kg/m2 or ≥ 25 kg/m2), urinary PGE-M levels were positively associated with breast cancer risk among postmenopausal women with a BMI < 25 kg/m2 in a dose-response manner (P for linear trend = 0.005). No such an association was found among premenopausal women or postmenopausal women with BMI ≥ 25 kg/m2, and interaction tests were statistically significant between menopausal status and urinary PGE-M (P = 0.021) and between BMI (< 25 kg/m2 or ≥ 25 kg/m2) and urinary PGE-M among postmenopausal women (P = 0.012). The above findings remain unchanged when the same quartile cutoff points (quartile cutoff points for all women) for pre and postmenopausal women for analyses (data not shown in the Table 3). In addition, we performed conditional analyses restricting to individually-matched cases and controls for the breast cancer study. Similar as the results from unconditional analyses using the larger sample size (Table 3), we found a positive association between urinary PGE-M levels and breast cancer risk among postmenopausal women with a BMI < 25 kg/m2 in a dose-response manner (P for linear trend = 0.048), but not among those with a BMI < 25 kg/m2 (data not shown in Tables).
Table 3.
Association between urinary level of PGE-M and risk of breast cancer, stratified by menopausal status and BMI
| Overall | BMI <25 | BMI ≥25 | |||||
|---|---|---|---|---|---|---|---|
| PGE-M (ng/mg Cr) | Cases/controls | OR (95% CI) a | Cases/controls | OR (95% CI) a | Cases/controls | OR (95% CI) a | P for interactionb |
| All women | |||||||
| Q1 (<1.99) | 145/270 | 1,00 (ref.) | 98/179 | 1,00 (ref.) | 47/91 | 1,00 (ref.) | |
| Q2 (1.99–2.28) | 118/271 | 0.88 (0.65–1.19) | 82/190 | 0.85 (0.59–1.23) | 36/81 | 1.01 (0.58–1.76) | |
| Q3 (2.29–2.63) | 123/271 | 0.97 (0.71–1.33) | 70/165 | 0.89 (0.60–1.34) | 53/106 | 1.10 (0.66–1.84) | 0.943 |
| Q4 (>2.63) | 118/270 | 1.07 (0.77–1.48) | 59/138 | 1.13 (0.72–1.76) | 59/132 | 0.99 (0.60–1.64) | |
| P for linear trend | 0.609 | 0.691 | 0.977 | ||||
| Postmenopausal women | |||||||
| Q1 (<2.13) | 60/150 | 1.00 (ref.) | 26/88 | 1.00 (ref.) | 34/62 | 1.00 (ref.) | |
| Q2 (2.13–2.42) | 60/149 | 1.02 (0.66–1.58) | 30/87 | 1.06 (0.56–1.99) | 30/62 | 0.98 (0.52–1.85) | |
| Q3 (2.43–2.72) | 53/153 | 1.03 (0.66–1.16) | 31/85 | 1.50 (0.79–2.83) | 22/68 | 0.72 (0.37–1.40) | 0.012 |
| Q4 (>2.72) | 72/151 | 1.39 (0.90–2.15) | 38/73 | 2.32 (1.24–4.41) | 34/78 | 0.88 (0.47–1.63) | |
| P for linear trend | 0.147 | 0.005 | 0.516 | ||||
| Premenopausal women | |||||||
| Q1 (<1.85) | 71/119 | 1.00 (ref.) | 58/85 | 1.00 (ref.) | 21/34 | 1.00 (ref.) | |
| Q2 (1.85–2.11) | 76/121 | 1.11 (0.73–1.69) | 56/94 | 0.87(0.54–1.41) | 20/27 | 2.38 (0.94–6.01) | |
| Q3 (2.12–2.42) | 48/118 | 0.73 (0.46–1.16) | 37/92 | 0.61 (0.36–1.02) | 11/26 | 1.70 (0.60–4.87) | 0.266 |
| Q4 (>2.42) | 64/121 | 1.00 (0.65–1.55) | 33/68 | 0.82 (0.47–1.42) | 31/53 | 1.63 (0.70–3.69) | |
| P for linear trend | 0.589 | 0.198 | 0.622 | ||||
| P for interactionc = 0.021 | |||||||
Derived from unconditional logistic regression and adjusted for age (continuous variable), education (< high school or ≥ high school), cigarette smoking status (non-smokers or ever-smokers), number of live births (0, 1, or ≥2), and months of breastfeeding (four levels: < 6.0, 6.0–11.9, 12.0–24.0, and >24.0).
P for interaction between urinary PGE-M (continuous variable) and BMI (<25 kg/m2 or ≥25 kg/m2).
P for interaction between urinary PGE-M (continuous variable) and menopausal status (premenopausal or postmenopausal).
The association of breast cancer risk with BMI and urinary PGE-M levels among postmenopausal women was further evaluated using data from women with a BMI < 25 kg/m2 and the lowest urinary PGE-M levels (first quartile) as the reference (Figure 1). Overweight women (BMI ≥ 25 kg/m2) had an elevated risk of breast cancer regardless of urinary level of PGE-M, whereas among women with a BMI < 25 kg/m2, breast cancer risk increased with increasing urinary level of PGE-M in a dose-response fashion.
Figure 1.
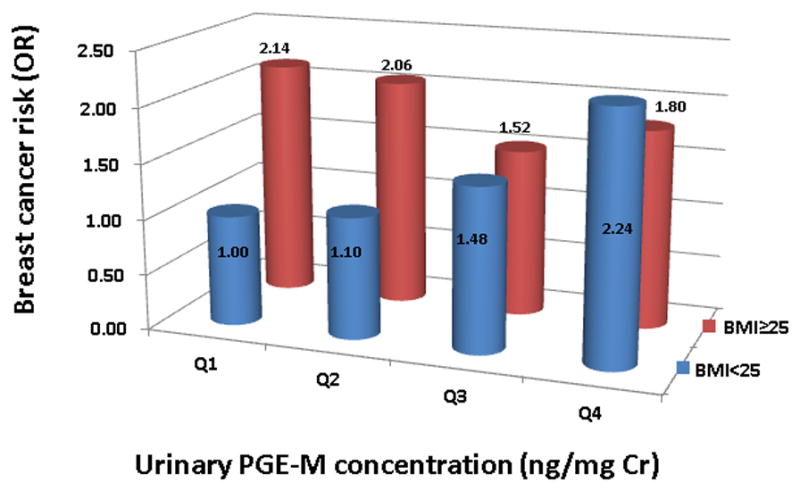
Associations between urinary PGE-M levels (ng/mg Cr; Q1: <2.12, Q2: 2.12–2.42, Q3: 2.43–2.72, Q4: >2.72), BMI (<25 kg/m2 and ≥25 kg/m2) and breast cancer risk (Odds Ratio) in postmenopausal women. The regression model was adjusted for age (continuous variable), education (< high school or ≥ high school), cigarette smoking status (non-smokers or ever-smokers), number of live births (0, 1, or ≥ 2), and months of breastfeeding (four levels: < 6.0, 6.0–11.9, 12.0–24.0, and >24.0).
Analyses were further conducted among postmenopausal women with a BMI < 25 kg/m2, stratifying the median time interval between urine sample collection and cancer diagnosis (≤ 4years or > 4 years) (Table 4). The association with urinary PGE-M was only seen among those who were diagnosed with breast cancer within the first 4 years after sample collection (P for trend = 0.001, with increasing quartile of PGE-M level). However, the association was attenuated among those who were diagnosed with breast cancer more than 4 years after sample collection.
Table 4.
Association of urinary PGE-M levels and risk of breast cancer stratified by median time interval between urine collection and cancer diagnosis among postmenopausal women with a BMI <25
| Cancer diagnosed ≤ 4 years after sample collection | Cancer diagnosed > 4 years after sample collection | |||
|---|---|---|---|---|
| PGE-M (ng/mg Cr) | Cases/controls | OR (95% CI) a | Cases/controls | OR (95% CI) a |
| Q1 (< 2.10) | 10/88 | 1.00 (Ref.) | 16/88 | 1.00 (Ref.) |
| Q2 (2.11–2.40) | 15/87 | 1.30 (0.53–3.20) | 15/87 | 0.79 (0.35–1.82) |
| Q3 (2.41–2.68) | 21/85 | 2.55 (1.06–6.14) | 10/85 | 1.02 (0.44–2.40) |
| Q4 ( > 2.68) | 22/73 | 3.57 (1.51–8.43) | 16/73 | 1.30 (0.58–2.91) |
| P for linear trend | < 0.001 | 0.435 | ||
Derived from unconditional logistic regression and adjusted for age (continuous variable), education (< high school or ≥ high school), cigarette smoking status (non-smokers or ever-smokers), number of live births (0, 1, or ≥2), and months of breastfeeding (four levels: < 6.0, 6.0–11.9, 12.0–24.0, and >24.0).
We also repeated the analyses with the BMI cut point proposed for Asians to define overweight (BMI ≥ 23 kg/m2) among postmenopausal women. Among those with a low BMI (< 23 kg/m2), a positive association between urinary PGE-M and breast cancer risk was observed (P for trend = 0.087), and adjusted OR was 2.04 (95% CI = 0.87–4.83) for the highest quartile compared with the lowest quartile (data not shown in the Tables). This association was more evident in the analysis restricting to case diagnosed within the first 4 years after sample collection [1.00 (ref.), 0.82 (0.25–2.62), 2.12 (0.73–6.23), 2.95 (0.96–9.13); P for trend = 0.022]. No apparent association was observed in the stratum with a BMI of >23 kg/m2 (data not shown in the Tables)
Discussion
In this study, we found a strong positive association between urinary PGE-M level and breast cancer among lean and normal weight (BMI<25 kg/m2), postmenopausal women. The association with PGE-M identified in this study is one of the strongest associations ever reported for established risk factors and biomarkers for breast cancer. Our finding is generally consistent with evidence from in vitro experiments and animal model studies indicating an important role of COX-2 and PGE2 in carcinogenesis (6–11).
Several lines of evidence suggest that that COX-2 upregulation and in turn increased PGE2 production is an early event in the development of breast cancer. In both transgenic mouse and carcinogen-dependent breast cancer models, overexpression of COX-2 in mammary epithelial cells has been found to result in the development of mammary tumors (11, 25, 26). In human, COX-2 is frequently overexpressed not only in invasive breast cancers, but also in adjacent ductal carcinoma in situ (DCIS) (27–31). In a study, COX-2 expression was detected in 85% of all DCIS specimens (31). Our finding for a stronger association of PGE-M with breast cancer risk among cases diagnosed within the first 4 years after sample collection than those diagnosed after 4 years of sample collection suggests that the elevated level of urinary PGE-M may be due to the overproduction of PGE2 in breast cancer cells.
A recent case-cohort study nested within the Sister Study cohort reported a positive association between urinary PGE-M and breast cancer risk among postmenopausal women who did not regularly use NSAIDs (32). However, the potential effect of body weight on the association between urinary PGE-M and breast cancer risk was not evaluated. Our study demonstrated a modifying effect of body weight in the association of urinary PGE-M with breast cancer risk among postmenopausal women. The reasons for this modification are unclear. Studies have shown that both tumor cells and adipose tissue can produce inflammatory cytokines and PGE2 (21). Overweight women have a chronic inflammatory condition and an increased PGE2 production by adipose tissue, which results in a significantly higher level of urinary PGE-M than normal weight women, as demonstrated in our study and a previous study (33). In addition, multiple obesity-related pathways are also involved in and/or interact with COX2/PGE2 signaling (20, 33–36). Future studies are needed to clarify the complicated interactions of these pathways in the etiology of breast cancer.
The present study has several strengths, including a population-based, prospective cohort study design, and extremely high follow-up rates, which reduced the potential selection bias. It has been reported that NSAID use and cigarette smoking may influence urinary levels of PGE-M (17, 32, 37). In the SWHS cohort, only a small proportion of women (< 5%) took aspirin regularly or smoked cigarettes. Women who used NSAIDs in the 7 days prior to urine sample collection and/or took aspirin regularly have been excluded, and cigarette smoking status was adjusted in this analysis. Thus, the influence of these potential confounding factors should be small. In addition, there may be a concern that the results from this study are based on a single measurement of a spot urine sample of PGE-M. However, previously we evaluated the specific interpersonal variations of urinary PGE-M levels in our laboratory and found that the intraclass correlation coefficient for urinary PGE-M was 0.67 and Spearman correlation coefficient, derived by using bootstrap analysis of single spot measurements and the average of the other three seasonal measurements, was 0.61 for urinary PGE-M (38). These results indicate that urinary level of PGE-M is stable and that measurement based on a single spot urine sample reflects well the PGE-M level over one year.
In summary, using data from the SWHS, we showed that high levels of urinary PGE-M were strongly associated with increased risk of breast cancer among lean and normal weight, postmenopausal women, but not among overweight postmenopausal women or premenopausal women. Our finding is consistent with the role of COX-2 and PGE2 in carcinogenesis and suggests that urinary PGE-M may serve as a promising biomarker to identify women likely to develop breast cancer in a relatively short period of time.
Acknowledgments
Grant Support
This study was supported by grant number R37 CA070867 (to W. Zheng) from the US National Institutes of Health (NIH).
This study would not have been possible without the support of the study participants and research staff of the Shanghai Women’s Health Study. The authors thank Dr. Wanqing Wen for contributing to data analysis and Ms. Bethanie Rammer for editing and preparing the manuscript.
Abbreviations
- BMI
body mass index
- CI
confidence interval
- COX-2
cyclooxygenase 2
- DCIS
ductal carcinoma in situ
- HRT
hormone replacement therapy
- NSAIDs
nonsteroidal anti-inflammatory drugs
- PGE2
prostaglandin-E2
- PGE-M
metabolite of PGE2 (11 alpha-hydroxy-9,15-dioxo-2,3,4,5-tetranorprostane-1,20-dioic acid)
- OR
odds ratio
- SWHS
Shanghai Women’s Health Study
Footnotes
Disclosure of Potential Conflicts of Interest
No potential conflicts of interest were disclosed.
References
- 1.Jemal A, Bray F, Center MM, Ferlay J, Ward E, Forman D. Global cancer statistics. CA Cancer J Clin. 2011;61(2):69–90. doi: 10.3322/caac.20107. [DOI] [PubMed] [Google Scholar]
- 2.American Cancer Society. Cancer Facts & Figures 2011. [Internet] Atlanta: American Cancer Society; 2011. p. 9. [cited 2014 Apr 20] Available from:. http://www.cancer.org/acs/groups/content/@epidemiologysurveilance/documents/document/acspc-029771.pdf. [Google Scholar]
- 3.Coussens LM, Werb Z. Inflammation and cancer. Nature. 2002;420:860–67. doi: 10.1038/nature01322. [DOI] [PMC free article] [PubMed] [Google Scholar]
- 4.Mantovani A, Allavena P, Sica A, Balkwill F. Cancer-related inflammation. Nature. 2008;454:436–44. doi: 10.1038/nature07205. [DOI] [PubMed] [Google Scholar]
- 5.Hanahan D, Weinberg PA. Hallmarks of cancer: the next generation. Cell. 2011;144:646–74. doi: 10.1016/j.cell.2011.02.013. [DOI] [PubMed] [Google Scholar]
- 6.Taketo MM. Cyclooxygenase-2 inhibits tumorigenesis (part I) J Natl Cancer Inst. 1998;90:1529–36. doi: 10.1093/jnci/90.20.1529. [DOI] [PubMed] [Google Scholar]
- 7.Taketo MM. Cyclooxygenase-2 inhibits tumorigenesis (part II) J Natl Cancer Inst. 1998;90:1609–20. doi: 10.1093/jnci/90.21.1609. [DOI] [PubMed] [Google Scholar]
- 8.Elwood PC, Gallagher AM, Duthie GG, Mur LA, Morgan G. Aspirin, salicylates, and cancer. Lancet. 2009;373:1301–09. doi: 10.1016/S0140-6736(09)60243-9. [DOI] [PubMed] [Google Scholar]
- 9.Thun MJ, Blackard B. Pharmacologic effects of NSAIDs and implications for the risks and benefits of long-term prophylactic use of aspirin to prevent cancer. Recent Results Cancer Res. 2009;181:215–21. doi: 10.1007/978-3-540-69297-3_20. [DOI] [PubMed] [Google Scholar]
- 10.Wang D, DuBois RN. Eicosanoids and cancer. Nat Rev Cancer. 2010;10:181–93. doi: 10.1038/nrc2809. [DOI] [PMC free article] [PubMed] [Google Scholar]
- 11.Howe LR. Inflammation and breast cancer. Cyclooxygenase/prostaglandin signaling and breast cancer. Breast Cancer Res. 2007;9:210. doi: 10.1186/bcr1678. [DOI] [PMC free article] [PubMed] [Google Scholar]
- 12.Terry MB, Gammon MD, Zhang FF, Tawfik H, Teitelbaum SL, Britton JA, et al. Association of frequency and duration of aspirin use and hormone receptor status with breast cancer risk. JAMA. 2004;291:2433–40. doi: 10.1001/jama.291.20.2433. [DOI] [PubMed] [Google Scholar]
- 13.Takkouche B, Regueira-Méndez C, Etminan M. Breast cancer and use of nonsteroidal anti-inflammatory drugs: a meta-analysis. J Natl Cancer Inst. 2008;100:1439–47. doi: 10.1093/jnci/djn324. [DOI] [PubMed] [Google Scholar]
- 14.Luo T, Yan HM, He P, Lou Y, Yang YF, Zheng H. Aspirin use and breast cancer risk: a meta-analysis. Breast Cancer Res Treat. 2012;131:581–7. doi: 10.1007/s10549-011-1747-0. [DOI] [PubMed] [Google Scholar]
- 15.Wang D, DuBois RN. Urinary PGE-M: a promising cancer biomarker. Cancer Prev Res (Phila) 2013;6:507–10. doi: 10.1158/1940-6207.CAPR-13-0153. [DOI] [PMC free article] [PubMed] [Google Scholar]
- 16.Murphey LJ, Williams MK, Sanchez SC, Byrne LM, Csiki I, Oates JA, et al. Quantification of the major urinary metabolite of PGE2 by a liquid chromatographic/mass spectrometric assay: determination of cyclooxygenase-specific PGE2 synthesis in healthy humans and those with lung cancer. Anal Biochem. 2004;334:266–75. doi: 10.1016/j.ab.2004.08.019. [DOI] [PubMed] [Google Scholar]
- 17.Cai Q, Gao YT, Chow WH, Shu XO, Yang G, Ji BT, et al. Prospective study of urinary prostaglandin E2 metabolite and colorectal cancer risk. J Clin Oncol. 2006;24:5010–6. doi: 10.1200/JCO.2006.06.4931. [DOI] [PubMed] [Google Scholar]
- 18.Wellen KE, Hotamisligil GS. Obesity-induced inflammatory changes in adipose tissue. J Clin Invest. 2003;112:1785–8. doi: 10.1172/JCI20514. [DOI] [PMC free article] [PubMed] [Google Scholar]
- 19.Ramos-Nino ME. The role of chronic inflammation in obesity-associated cancers. ISRN Oncol. 2013;2013:697521. doi: 10.1155/2013/697521. [DOI] [PMC free article] [PubMed] [Google Scholar]
- 20.Subbaramaiah K, Morris PG, Zhou XK, Morrow M, Du B, Giri D, et al. Increased levels of COX-2 and prostaglandin E2 contribute to elevated aromatase expression in inflamed breast tissue of obese women. Cancer Discov. 2012;2:356–65. doi: 10.1158/2159-8290.CD-11-0241. [DOI] [PMC free article] [PubMed] [Google Scholar] [Retracted]
- 21.Simpson ER, Brown KA. Obesity and breast cancer: role of inflammation and aromatase. J Mol Endocrinol. 2013;51:T51–9. doi: 10.1530/JME-13-0217. [DOI] [PubMed] [Google Scholar]
- 22.Zheng W, Chow WH, Yang G, Jin F, Rothman N, Blair A, et al. The Shanghai Women’s Health Study: rationale, study design, and baseline characteristics. Am J Epidemiol. 2005;162:1123–31. doi: 10.1093/aje/kwi322. [DOI] [PubMed] [Google Scholar]
- 23.World Health Organization [Internet] c2014 BMI classification. Geneva, Switzerland: World Health Organization; 2014. Mar 9, [cited 2014 Apr 20]. Available from: http://apps.who.int/bmi/index.jsp?introPage=intro_3.html. [Google Scholar]
- 24.WHO Expert Consultation. Appropriate body-mass index for Asian populations and its implications for policy and intervention strategies. The Lancet. 2004;363:157–63. doi: 10.1016/S0140-6736(03)15268-3. [DOI] [PubMed] [Google Scholar]
- 25.Liu CH, Chang SH, Narko K, Trifan OC, Wu MT, Smith E, et al. Overexpression of cyclooxygenase-2 is sufficient to induce tumorigenesis in transgenic mice. J Biol Chem. 2001;276:18563–9. doi: 10.1074/jbc.M010787200. [DOI] [PubMed] [Google Scholar]
- 26.Howe LR, Crawford HC, Subbaramaiah K, Hassell JA, Dannenberg AJ, Brown AM. PEA3 is up-regulated in response to Wnt1 and activates the expression of cyclooxygenase-2. J Biol Chem. 2001;276:20108–15. doi: 10.1074/jbc.M010692200. [DOI] [PubMed] [Google Scholar]
- 27.Boland GP, Butt IS, Prasad R, Knox WF, Bundred NJ. COX-2 expression is associated with an aggressive phenotype in ductal carcinoma in situ. Br J Cancer. 2004;90:423–9. doi: 10.1038/sj.bjc.6601534. [DOI] [PMC free article] [PubMed] [Google Scholar]
- 28.Half E, Tang XM, Gwyn K, Sahin A, Wathen K, Sinicrope FA. Cyclooxygenase-2 expression in human breast cancers and adjacent ductal carcinoma in situ. Cancer Res. 2002;62:1676–81. [PubMed] [Google Scholar]
- 29.Watanabe O, Shimizu T, Imamura H, Kinoshita J, Utada Y, Okabe T, et al. Expression of cyclooxygenase-2 in malignant and benign breast tumors. Anticancer Res. 2003;23:3215–21. [PubMed] [Google Scholar]
- 30.Tan KB, Yong WP, Putti TC. Cyclooxygenase-2 expression: a potential prognostic and predictive marker for high-grade ductal carcinoma in situ of the breast. Histopathology. 2004;44:24–8. doi: 10.1111/j.1365-2559.2004.01774.x. [DOI] [PubMed] [Google Scholar]
- 31.Shim V, Gauthier ML, Sudilovsky D, Mantei K, Chew KL, Moore DH, et al. Cyclooxygenase-2 expression is related to nuclear grade in ductal carcinoma in situ and is increased in its normal adjacent epithelium. Cancer Res. 2003;63:2347–50. [PubMed] [Google Scholar]
- 32.Kim S, Taylor JA, Milne GL, Sandler DP. Association between urinary prostaglandin E2 metabolite and breast cancer risk: a prospective, case-cohort study of postmenopausal women. Cancer Prev Res (Phila) 2013;6:511–8. doi: 10.1158/1940-6207.CAPR-13-0040. [DOI] [PMC free article] [PubMed] [Google Scholar]
- 33.Tian J, Lambertz I, Berton TR, Rundhaug JE, Kiguchi K, Shirley SH, et al. Transgenic insulin-like growth factor-1 stimulates activation of COX-2 signaling in mammary glands. Mol Carcinog. 2012;51:973–83. doi: 10.1002/mc.20868. [DOI] [PMC free article] [PubMed] [Google Scholar]
- 34.Prueitt RL, Boersma BJ, Howe TM, Goodman JE, Thomas DD, Ying L, et al. Inflammation and IGF-I activate the Akt pathway in breast cancer. Int J Cancer. 2007;120:796–805. doi: 10.1002/ijc.22336. [DOI] [PubMed] [Google Scholar]
- 35.Subbaramaiah K, Howe LR, Bhardwaj P, Du B, Gravaghi C, Yantiss RK, et al. Obesity is associated with inflammation and elevated aromatase expression in the mouse mammary gland. Cancer Prev Res (Phila) 2011;4:329–46. doi: 10.1158/1940-6207.CAPR-10-0381. [DOI] [PMC free article] [PubMed] [Google Scholar] [Retracted]
- 36.Wang D, DuBois RN. The role of the PGE2-aromatase pathway in obesity-associated breast inflammation. Cancer Discov. 2012;2:308–10. doi: 10.1158/2159-8290.CD-12-0078. [DOI] [PubMed] [Google Scholar]
- 37.Gross ND, Boyle JO, Morrow JD, Williams MK, Moskowitz CS, Subbaramaiah K, et al. Levels of prostaglandin E metabolite, the major urinary metabolite of prostaglandin E2, are increased in smokers. Clin Cancer Res. 2005;11:6087–93. doi: 10.1158/1078-0432.CCR-05-0733. [DOI] [PMC free article] [PubMed] [Google Scholar]
- 38.Wu X, Cai H, Xiang YB, Cai Q, Yang G, Liu D, et al. Intra-person variation of urinary biomarkers of oxidative stress and inflammation. Cancer Epidemiol Biomarkers Prev. 2010;19:947–52. doi: 10.1158/1055-9965.EPI-10-0046. [DOI] [PMC free article] [PubMed] [Google Scholar]