

Abstract
Temporal variation in listeners' sensitivity to interaural time and level differences (ITD and ILD, respectively) was measured for sounds of different carrier frequency using the temporal weighting function (TWF) paradigm [Stecker and Hafter (2002) J. Acoust. Soc. Am. 112,1046–1057]. Listeners made lateralization judgments following brief trains of filtered impulses (Gabor clicks) presented over headphones with overall ITD and/or ILD ranging from ±500 μs ITD and/or ±5 dB ILD across trials. Individual clicks within each train varied by an additional ±100 μs ITD or ±2 dB ILD to allow TWF calculation by multiple regression. In separate conditions, TWFs were measured for carrier frequencies of 1, 2, 4, and 8 kHz. Consistent with past studies, TWFs demonstrated high weight on the first click for stimuli with short interclick interval (ICI = 2 ms), but flatter weighting for longer ICI (5–10 ms). Some conditions additionally demonstrated greater weight for clicks near the offset than near the middle of the train. Results support a primary role of the auditory periphery in emphasizing onset and offset cues in rapidly modulated low-frequency sounds. For slower modulations, sensitivity to ongoing high-frequency ILD and low-frequency ITD cues appears subject to recency effects consistent with the effects of leaky temporal integration of binaural information.
I. INTRODUCTION
Sensitivity to interaural time differences (ITD) and interaural level differences (ILD) underlies our ability to localize sound sources in azimuth and to segregate competing sound sources in a wide range of situations. With real sound sources in real rooms, these cues vary over time as a consequence of interference by echoes, reverberation, and competing sounds. To some extent, at least, human and animal hearing avoids some of these negative effects by strongly weighting cues that are least affected, especially those carried by the first-arriving wavefront, consistent with the importance of localizing direct rather than reflected sound (Litovsky et al., 1999). This onset dominance holds in many (but not all) situations, and has been described variously in terms of binaural adaptation (Hafter and Dye, 1983), localization dominance (Freyman et al., 1997; Litovsky et al., 1999; Stecker and Hafter, 2002), and variation in binaural sensitivity over the duration of a sound (Zurek, 1980; Akeroyd and Bernstein, 2001; Brown and Stecker, 2010; Stecker and Brown, 2010; Dietz et al., 2013; Stecker et al., 2013; Stecker and Bibee, 2014). Note that these and other studies (cf. Freyman et al., 1997) demonstrate a dominance of spatial cues present at sound onset (i.e., early) over those present later in a sound, not a dominance of the onset envelope itself (cf. Buell et al., 2008).
Temporal weighting functions (TWFs) can be used to quantify onset dominance and related effects. TWFs plot the dependence of listeners' spatial judgments on the cues carried by each part of a sound, and can be estimated using statistical regression techniques. For example, Saberi (1996) and Brown and Stecker (2010) measured TWFs for ITD and/or ILD discrimination in trains of high-frequency filtered clicks, and observed large onset weights only when interclick intervals (ICIs) were shorter than ∼5 ms. Stecker and Hafter (2002, 2009) measured TWFs for the localization of filtered click trains in the free field. Again, strong onset dominance was observed for ICI < 5 ms; in some conditions, Stecker and Hafter (2002, 2009) also observed large weights for late-arriving sound (upweighting). One limitation of those studies is that only stimuli with center frequencies of ∼4000 Hz were tested. Here, we extend the approach to measure TWFs for ITD- or ILD-based lateralization of trains of filtered impulses varying in center frequency. The goal is to determine whether either effect (onset dominance or upweighting) varies with cue type or frequency range of the stimuli.
A potential explanation of ICI-dependent onset dominance in high-frequency sounds follows from listeners' poor sensitivity to ongoing envelope ITD for modulation rates much faster than ∼200 Hz (Bernstein and Trahiotis, 2002, 2014). As a consequence of that limitation, it is expected that listeners place more weight on the remaining intact cues—ILD (Stecker, 2010) and onset ITD (Hafter and Dye, 1983)—as the ICI falls below 5 ms. That is, onset dominance in ITD processing could simply reflect the loss of ongoing ITD information at high frequencies. If so, TWFs should exhibit stronger onset dominance as carrier frequency is increased, consistent with the progressive rate-limitation for ongoing envelope-ITD processing with increasing carrier frequency (Bernstein and Trahiotis, 2002, 2014). The current study tests this hypothesis by measuring TWF as a function of spectral frequency.
II. METHODS
Aside from differences in the center frequency of the stimuli employed, experimental methods were identical to those previously described in Experiment 2 of Stecker et al. (2013). Data obtained in that experiment, at 4-kHz carrier frequency, were reanalyzed for inclusion alongside data obtained here at 1, 2, and 8-kHz carrier frequencies, using identical experimental procedures.
A. Subjects
Seven normal-hearing adult listeners, aged 20–45 yr, participated in the experiment. Three were research assistants employed in the laboratory. The remainder were paid subjects naive to the purpose of the experiment. All subjects reported normal hearing and demonstrated pure-tone detection thresholds <15 dB hearing level over the range 250–8000 Hz. Comparison data previously reported by Stecker et al. (2013) using 4-kHz carriers were obtained from nine subjects, one of whom (subject 1007, whose data are plotted by black-filled circles in Figs. 3 and 6) also participated in the current study.
FIG. 3.
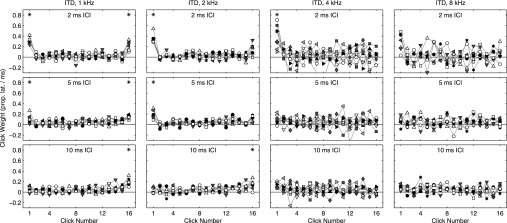
TWFs for ITD-based lateralization (individual data). As in Fig. 2, symbols plot TWFs in the form of normalized weight wi (vertical axis) versus click number (horizontal axis). Separate panels plot TWFs for each value of ICI (rows) and carrier frequency (columns), arranged identically to Fig. 2. Different symbols plot data for individual subjects. Asterisks (*) mark clicks where a statistically significant proportion of subjects (p < 0.05) demonstrated significantly non-zero weights (also p < 0.05).
FIG. 6.
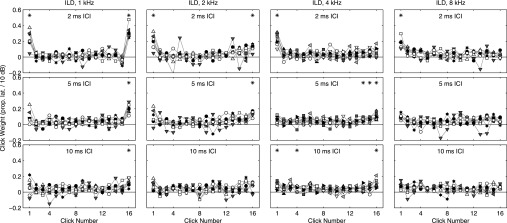
TWFs for ILD-based lateralization (individual data). As in Fig. 2, symbols plot TWFs in the form of normalized weight, wi (vertical axis), versus click number (horizontal axis). Separate panels plot TWFs for each value of ICI (rows) and carrier frequency (columns), arranged identically to Fig. 2. Different symbols plot data for individual subjects.
B. Stimuli
Stimuli were trains of 16 Gabor clicks (Gaussian-filtered impulses), as depicted in Fig. 1. Each click consisted of a carrier-frequency cosine multiplied by a Gaussian temporal envelope with σ = 221 μs. Carrier frequency was 1, 2, or 8 kHz, depending on condition, and the half-maximal bandwidth ∼1.8 kHz. Thus, in the 1-kHz condition, the similar carrier period (1 ms) and Gaussian duration result in an effectively low-pass stimulus, similar in some respects to a rectangular pulse train, which includes significant low-frequency energy. Click trains were presented with peak-to-peak ICI = 2, 5, or 10 ms, so that the total duration of each train was 32, 77, or 152 ms. Sounds were computed in matlab (Mathworks, Natick, MA), synthesized at 48.828 kHz (Tucker-Davis Technologies RX6, Alachua, FL), and presented via headphones (Sennheiser HD 485, Hannover, Germany) at 70 dB peak-equivalent sound pressure level (∼65–80 dBA, depending on condition).
FIG. 1.
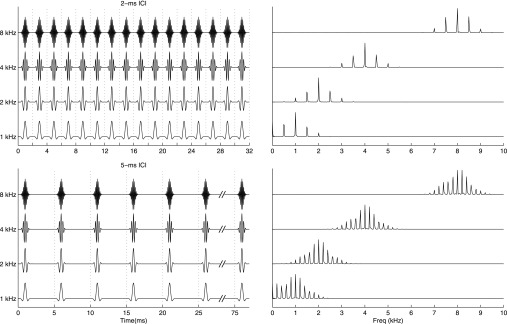
Stimuli employed in the study. Plotted at left are stimulus waveforms for Gabor click trains. In the upper left panel, example 16-click waveforms of each tested carrier frequency are plotted with 2-ms ICI (dotted lines). Note that only the left-ear waveform is shown, and no click-to-click variation in ITD or ILD is depicted. In the lower left panel, the ICI is 5 ms and only a subset of clicks is shown. Plotted at right of each panel are the corresponding power spectra, computed via fast Fourier transform.
ITD and ILD were tested in separate conditions and applied to the stimuli as follows: On each trial in the ITD condition, a “base” ITD value was selected from the set {−500, −300, −100, +100, +300, +500 μs}. Negative values correspond, by convention, to left-lateralized stimuli, e.g., ITD leading to the left ear. ITD values of individual clicks within the train deviated from the base ITD value by independent and uniformly distributed random values in the range ±100 μs.1 In every case, the ITD was applied as a whole-waveform delay. The ILD condition was treated similarly with base ILD values of {−5, −3, −1, +1, +3, +5 db} and per-click deviations spanning ±2 dB.
C. Procedure
Testing took place in a double-walled sound-attenuating booth (IAC, Bronx, NY) with subject seated in a swivel chair and facing an 80-cm (diagonal) touch-sensitive display (elo Touchsystems 3200L, Tyco Electronics, Bermuda) at a distance of 50 cm. Head position was monitored continuously (Polhemus Fastrak, Colchester, VT) to ensure stable head position during stimulus presentations.
On each trial, a single click-train stimulus was presented, following which listeners indicated the perceived lateral position of the stimulus by touching along a 55-cm horizontal bar displayed on the touch screen. Listeners were instructed to make an immediate eye movement to the judged position on the bar, and to maintain gaze while touching the foveated location with a finger. This instruction was intended to encourage listeners to rapidly orient to the sound's location and not perseverate on the scaling judgment.
Listeners completed 90 trials per run (15 trials per base ITD or ILD value), and 4–12 (typically, 8) runs per tested condition (combination of cue type and ICI).2
D. Analysis
Raw lateralization judgments were transformed and analyzed in the following manner, both for data obtained at 1, 2, and 8 kHz in the current study, and for data obtained previously by Stecker et al. (2013) at 4 kHz. As in that study, response data were first transformed to ranks (i.e., ranked according to lateral position) within each run in order to minimize response nonlinearities and distributional differences across runs and subjects. Perceptual weights for each of the 16 clicks in a train were then estimated by multiple linear regression of the rank-transformed response, θR, onto the binaural cues applied to individual clicks, θi (in units of μs ITD or dB ILD), using matlab,
| (1) |
where βi are linear regression coefficients and k the constant term of the regression. For comparison across subjects and conditions, past studies have presented normalized weights (Stecker and Hafter, 2002; Stecker et al., 2013). Here, regression coefficients were simply scaled so that weights, wi, indicate the proportion of lateralization range per 1 ms ITD or 10 dB ILD,
| (2) |
| (3) |
The scaled weights, wi, make up the TWF and indicate each click's influence on a listener's judgments. For normalized weights (Stecker and Hafter, 2002), values range from 0 (no influence) to 1 (a perfect linear relationship). Here, weights indicate the proportion of lateralization range (i.e., the range of judgments given over each run) scaled to the range of base ITD or ILD values presented (1 ms ITD or 10 dB ILD). So, for example, a weight of 1.0 on click 1 and 0.0 on other clicks would indicate a strong linear dependence of judgments on click 1, with the listeners' leftmost and rightmost responses obtained for θ1 = −500 μs and +500 μs ITD (or ±5 dB ILD), respectively. Strongly negative values would indicate a biasing of judgments away from the expected location. TWFs were estimated separately for each combination of listener, ICI, and cue condition (ITD or ILD), but combined data across all runs for that combination. Group-mean TWFs were calculated as the mean of TWFs after scaling by Eq. (2) or (3) across subjects for each combination of ICI and cue type.
1. Bootstrapped confidence intervals on wi
Statistical confidence intervals on wi were computed using a two-level nonparametric bootstrap approach (Efron and Tibshirani, 1986; Fox, 2008; Stecker and Bibee, 2014). Sampling distributions were estimated at the individual-subject level by resampling cases (paired stimulus and response values for each trial), with replacement, 1000 times and calculating wi as described above for each of the 1000 bootstrap samples. Sampling distributions of group-average TWFs for each combination of frequency, ICI, and cue condition were then estimated by second-level resampling of the bootstrapped individual TWFs across subjects (i.e., drawing a new set of M subjects, with replacement, for each of the 1000 bootstrap replicates). Confidence intervals were calculated based on the 2.5 and 97.5 percentile values of the resulting sampling distribution for each wi, adjusted to produce “bias-corrected, accelerated” (BCa) percentile intervals according to Fox (2008).
2. Measures of non-uniformity in TWFs
Following Stecker and Hafter (2009) and Stecker et al. (2013), we computed three measures to estimate the degree that TWFs departed from uniformity. The average ratio (AR; Saberi, 1996) was defined as the ratio of onset (first click) or offset (final click) weight to the mean of intermediate weights (i.e., the mean excluding onset and offset clicks)
| (4) |
or
| (5) |
where N (=16) indicates the total number of clicks in each train. ARonset describes the degree of onset dominance apparent in a given TWF (i.e., the degree to which the first, onset, click dominated listeners' judgments). ARoffset similarly indicates the relative influence of the final, offset, click. The results of Stecker and Hafter (2009) and Stecker et al. (2013) demonstrated elevated weights on clicks at and just prior to offset (upweighting) in some conditions, with the result that ARoffset > 1 in those cases. Following Stecker and Hafter (2009), a third measure, rise, characterized the linear trend in weights over time. To compute rise, we used linear regression to fit straight lines through weights w2–w15 (that is, excluding the onset and offset clicks) separately for each subject and condition. Regression slopes were multiplied by 14 (the range of clicks used for fitting) to compute rise, an estimate of the difference between w2 and w15 expected for a perfectly linear trend.3
Confidence intervals on AR and rise were computed using the same two-level bootstrapping procedure described for the weights themselves. Specifically, each measure was recomputed for each of the 1000 bootstrap-replicate TWFs computed at the individual subject level. Sampling distributions on group-average data, e.g., median AR values, were estimated by second-level resampling of the individual bootstrap replicates across subjects. Bias-corrected, accelerated, percentile intervals (Fox, 2008) were computed from the resulting sampling distributions to generate 95% confidence intervals for plotting. Null-hypothesis significance testing made similar use of the bootstrapping procedure as follows: Within-subject paired comparisons were computed for each bootstrap replicate (for example, that ARonset was larger for 2-ms than 5-ms ICI); those differences were resampled across subjects at the group level to estimate the sampling distribution of group-median differences, from which the (one-tailed4) p-value was calculated directly based on the proportion of values falling at or below 0 median difference.
III. RESULTS AND DISCUSSION
A. Temporal weighting of ITD cues
Group-average TWFs, computed by taking the mean across subjects for each click weight, are plotted in Fig. 2. Separate panels plot TWFs for each combination of frequency (left to right) and ICI (top to bottom). Data at 4-kHz carrier frequency (third column) were obtained from experiment 2 of Stecker et al. (2013) and reanalyzed identically to the other carrier frequencies presented here. Note that, in comparison to the previous paper, error bars plotted in Fig. 2 are markedly broader, primarily because the prior study normalized weights prior to averaging across subjects. Figure 3 plots TWFs for individual subjects. Note that subjects varied in the degree to which they exhibited weighting effects, in some cases, systematically across conditions. For example, upward-pointing triangles indicate that among the group, naive subject 1013 experienced the strongest onset dominance across multiple conditions with low frequency and short ICI, and strongest offset weighting at low frequency and 10-ms ICI.
FIG. 2.
TWFs for ITD-based lateralization (group data). In each panel, normalized weights wi (y-axis) are plotted for each click in a train as a function of the temporal order of the clicks (x-axis). Symbols plot the mean of normalized weights across subjects; error bars indicate bootstrapped 95% confidence intervals on the cross-subject mean. The dashed horizontal line in each panel indicates the value that would be obtained if all clicks were equally weighted (1/16), while the solid line indicates 0. From left to right, panels plot TWFs for carrier frequency of 1, 2, 4, and 8 kHz. From top to bottom, panels plot TWFs for 2 -, 5-, and 10-ms ICI.
TWFs for ITD-based lateralization (Figs. 2 and 3) reveal several important features. First, mean weights on click 1 were significantly elevated at 2-ms ICI for all frequencies; that effect was modestly reduced at 8 kHz. Similarly, significant proportions of individual TWFs demonstrated significant click-1 weights at 1–4 kHz (but not 8 kHz). This onset dominance was ICI dependent at all frequencies, greater at 2 ms than at longer values. With respect to the hypothesis under test, we note that Bernstein and Trahiotis (2002, 2014) reported increasingly poor sensitivity to ongoing envelope ITD as carrier frequency increased from 4 to 10 kHz. If onset dominance arises simply as a consequence of that reduced sensitivity, onset weights should increase with carrier frequency over that range. Here, we observed a reduction in onset dominance from 2 to 8 kHz, opposite of the prediction that onset dominance should increase as ongoing sensitivity is lost. Compared to 1–2 kHz carrier frequency, however, greater within-and between-subject variability was observed in TWFs for ITD judgments at 4–8 kHz. That result, consistent with the weaker ongoing envelope ITD cue at high frequencies, was also not accompanied by marked increases in onset weights.
The results at low frequency are more consistent with the monaural effects of peripheral filtering (Tollin, 1998; Tollin and Henning, 1999; Hartung and Trahiotis, 2001; Bianchi et al., 2013). It is expected that the longer impulse responses of lower-frequency auditory filters more greatly obscure the ongoing binaural cues, so that cues present at sound onset more strongly dominate the overall ITD at low frequencies. These effects are discussed more thoroughly in Sec. IV D, on modeling.
A second feature of the data is the presence of large offset weights in some conditions. Notably, both the 1 and 2 kHz conditions at 2-ms ICI revealed large weights on click 16. In those cases, weights did not follow a monotonically increasing trend as described for upweighting by Stecker and Hafter (2009). Significant elevation of the offset weight in isolation would not be consistent with the mechanism proposed in that study (leaky temporal integration), but would be consistent with the operation of auditory peripheral filters which continue to signal the offset ITD during the tail of their impulse responses (see Sec. IV D). In contrast, at 5–10-ms ICI, increased offset weights appeared more similar to those described by Stecker and Hafter (2009), at least for 1 and 2 kHz. No significant offset weighting was observed at higher frequencies (4 and 8 kHz).
Figure 4 plots values of ARonset (top panel), ARoffset (middle panel), and rise (bottom panel), along with bootstrapped 95% confidence intervals on each statistic for ITD conditions. These quantify the key points visible in Fig. 2. First, significant ARonset values (asterisks) reflect the strong onset dominance observed at 2-ms ICI for all carrier frequencies. Values at 5–10-ms ICI were significantly lower. Note that tests of significance reflect group-level analyses of AR > 1 via Wilcoxon signed-rank tests, whereas confidence intervals appear more conservative due to the consideration of group- and individual-level variability in estimates of the AR value itself. For this reason, the two appear inconsistent in some cases. Second, the enhanced contribution of late-arriving ITD at frequencies <4 kHz is evident in significant values of ARoffset at all ICI. At 5–10-ms ICI, that result reflects both gradual weight increases over sound duration (i.e., upweighting; rise > 0), in addition to elevated weights on the final click itself (ARoffset > 1). At 2-ms ICI, the effect is restricted to the final click and rise = 0. As stated above, the results are consistent with a primary role of auditory peripheral filtering (Tollin, 1998) on TWFs measured at 2-ms ICI, and leaky temporal integration of ongoing envelope ITD (Stecker and Hafter, 2009) at 5–10-ms ICI, for these carrier frequencies. Previously, Stecker et al. (2013) demonstrated upweighting effects at 4 kHz carrier frequency only for ILD cues and not for ITD cues manipulated alone. The current result suggests that the contribution of late-arriving ITD, as well as ILD cues, is frequency-dependent; for low carrier frequencies and long ICI, ongoing ITD is a salient cue. Its contribution to lateral-position judgments appears to favor recent (late-arriving) sound just as for ILD at higher carrier frequencies.
FIG. 4.

AR and rise computed for ITD conditions. Upper panel plots median AR computed for the onset click for each combination of carrier frequency (horizontal axis) and ICI (shaded bars). Bar heights plot the mean AR value across subjects in each condition and error bars indicate two-level bootstrapped 95% confidence interval on that statistic. Asterisks (*) indicate conditions with median AR > 1 based on Wilcoxon signed-rank test (one-tailed p < 0.05) of non-bootstrapped AR data (i.e., ignoring intertrial variability). Across carrier frequency, ARonset values were larger for 2-ms ICI (dark bars) than for ICI values of 5 ms (light gray bars) or 10 ms (white bars), consistent with the onset dominance apparent in the TWFs themselves (Fig. 2). Middle panel plots the median AR values computed for the offset click, but is otherwise formatted identically to the upper panel. ARoffset values were largest for low rather than high carrier frequency, but did not depend systematically on ICI. Lower panel plots rise, the slope of linear weight trend from click 2 to click 15 in each TWF. Error bars plot two-level bootstrapped confidence intervals as for AR and asterisks indicate conditions with median rise > 0 (Wilcoxon signed-rank test, one-tailed p < 0.05).
B. Temporal weighting of ILD cues
TWFs for ILD-based lateralization are shown in Figs. 5 (group data) and 6 (individual data). These exhibit broad similarities to TWFs obtained for ITD. Namely, onset dominance was observed at 2-ms ICI, but not at 5-ms ICI, regardless of carrier frequency. Monotonically increasing weights near sound offset (upweighting) were observed across a broader range of frequencies and ICI values than for ITD, including all ICI values at 2 kHz, and 5–10-ms ICI at 4 kHz (in contrast to ITD, which showed no evidence of upweighting at 4 kHz). That result is consistent with greater sensitivity to ongoing ILD than to ongoing ITD in these conditions. At 1 kHz, significant weights were observed on click 16 in isolation at 2- and 5-ms ICI, again consistent with a strong influence of “ringing” peripheral filters carrying the offset ILD, further discussed in Sec. IV D, below. As was the case for ITD, individual data plotted in Fig. 6 reveal systematic variation in TWF features across individuals. Again, many of the largest click-1 weights at low frequencies were exhibited by subject 1013 (upward-pointing triangles).
FIG. 5.
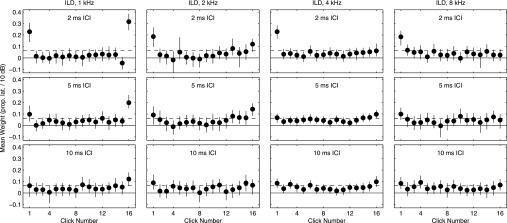
TWFs for ILD-based lateralization (group data). As in Fig. 2, symbols plot TWFs in the form of mean normalized weight, wi (vertical axis), versus click number (horizontal axis) averaged across subjects. Error bars depict bootstrapped 95% confidence intervals on the mean weight across subjects. Separate panels plot TWFs for each value of ICI (rows) and carrier frequency (columns). Panel arrangement and other formatting is identical to Fig. 2.
Figure 7 plots values of ARonset (top panel), ARoffset (middle panel), and rise (bottom panel), along with bootstrapped 95% confidence intervals on each statistic for ILD conditions. As was the case for ITD conditions, these analyses broadly support the TWF features evident in Fig. 5. In particular, the ICI-dependent onset dominance observed at all carrier frequencies is supported by the significant ARonset values obtained in those conditions. Values of ARoffset and rise similarly support the pattern of elevated weights for clicks occurring late in the stimulus. At 1 kHz carrier frequency, the strong influence of peripheral filtering on weights for clicks 1 and 16 is evident in the TWFs (Figs. 5 and 6) and in the combination of significant ARoffset with zero rise. At 2 kHz, the gradually increasing weights apparent in TWFs are supported by significant values of both ARoffset and rise. At 4 kHz, however, increasing weights are captured by significant ARoffset, but not rise, despite the gradual nature of weight trends visibly apparent in Figs. 5 and 6.5
FIG. 7.

AR for ILD. As in Fig. 4, the upper panel plots mean AR computed for the onset click for each combination of carrier frequency (horizontal axis) and ICI (shaded bars). Bar heights plot the mean AR value across subjects in each condition and error bars indicate the bootstrapped 95% confidence interval on that statistic. As was the case for ITD, ARonset values were larger for 2-ms ICI (dark bars) than for ICI values of 5 ms (light gray bars) or 10 ms (white bars), but did not depend strongly on carrier frequency. The lower panel plots mean AR values computed for the offset click, but is otherwise formatted identically to the upper panel. Large ICI-dependent values of ARoffset were obtained at 1 kHz carrier frequency (leftmost bars); smaller, but significant ARoffset values were also obtained at 2 and 4 kHz, but did not vary systematically with ICI.
IV. GENERAL DISCUSSION
A. Onset effects
Across conditions, and consistent with many past studies of high-frequency sounds, strong onset dominance was observed in TWFs for both low and high frequencies. The magnitude of onset dominance was minimally dependent on sound frequency, with reduced effects at 8 kHz relative to lower frequencies. Thus, onset dominance in these stimuli does not arise simply due to the rate-limited binaural processing of high-frequency sounds described by Bernstein and Trahiotis (2002). Instead, it seems the potency of the onset portion per se obscures the contribution of later ongoing cues regardless of sound frequency. It is not clear from these results whether that potency reflects cues carried by the onset envelope itself (e.g., the overall envelope ITD) or the “ongoing” cues that co-occur with or immediately follow the rising phase of the envelope. For click-train stimuli as employed here, the two are naturally confounded. Studies of ITD processing in low-frequency tones, however, suggest a similar dominance of cues present at sound onset; in that case, fine-structure ITD cues present during the rising slope of a sound envelope are emphasized even when the envelope itself is diotic (Abel and Kunov, 1983; Dietz et al., 2013, 2014; Stecker and Bibee, 2014).
In general, the ICI-dependence of onset dominance was similar to results of past studies; stronger onset dominance was observed at 2-ms ICI as compared to 5- and 10-ms ICI for both types of binaural cue. Onset dominance was somewhat weaker for ILD than for ITD, consistent with the pattern observed across several recent studies in the author's laboratory (Brown and Stecker, 2010; Stecker and Brown, 2010, 2012).
B. Offset effects
Significantly elevated weights were also observed near sound offset in many conditions (see Figs. 2 and 5). These presented in two types of patterns. First, weights that increased monotonically over the last several clicks in a train were observed most commonly at ICI values of 5–10 ms. That pattern and its ICI-dependence are consistent with upweighting as described by Stecker and Hafter (2002, 2009), who suggested its origin in the leaky temporal integration of binaural cues. The consequence of leaky temporal integration, in this case, would be to emphasize recent inputs in a graded fashion so that earlier inputs are successively reduced in effectiveness. At high frequencies, such evidence for upweighting was clearer in the TWFs for ILD than for ITD (Stecker et al., 2013), suggesting that the role of late-arriving sound in localization at high frequencies may depend primarily on the ILD rather than the ongoing envelope ITD present in free-field stimuli (cf. Stecker and Hafter, 2002, 2009). A similar temporal pattern observed here for ITD at 1–2 kHz carrier frequency suggests that the ongoing envelope- and fine-structure ITD cues available at low frequencies also impact lateralization judgments primarily via temporally integrative mechanisms, which emphasize late-arriving sound.
The second pattern featured large weight on the offset click (i.e., click 16) alone. This was observed most prominently at 2-ms ICI for low carrier frequency. That pattern has not been reported in previous TWF studies and is not consistent with the effects of binaural temporal integration. It may instead reflect the continued signaling of offset cues by the fading responses of peripheral auditory filters.
C. Peripheral versus central mechanisms
The strong onset dominance and large offset weights observed at 2-ms ICI in conditions containing low-frequency energy both suggest a role of peripheral filtering (Tollin, 1998; Tollin and Henning, 1999; Hartung and Trahiotis, 2001; Bianchi et al., 2013); a filter's response to the onset click interferes with and obscures later clicks, while its decaying response to the offset click sustains the offset cue. Thus, many—if not all—TWF features at low frequency and short ICI may reflect the consequences of overlapping excitation in low-frequency peripheral filters. This issue is taken up in Sec. IV D, on modeling, below.
In contrast to the peripheral account for low frequency and short ICI, other features remain, in our view, more consistent with the contributions of central mechanisms. It is not clear, for example, how much the auditory periphery contributes to onset dominance at high frequencies (4–8 kHz), where the filter responses are much shorter in time, or what role is played by the rate-limitation on ongoing envelope ITD processing suggested by Bernstein and Trahiotis (2002). Upweighting, observed at longer ICI (5 and 10 ms) and higher frequency (up to 4 kHz at least), exhibits a form consistent with temporal integration over a longer time course (on the order of 40 ms), and most likely reflects the temporal window of binaural integration (Akeroyd and Bernstein, 2001; Stecker and Hafter, 2009), as described in Fig. 9 of Stecker et al. (2013).
With regard to the neural mechanisms responsible, several recent physiological studies appear particularly relevant. First, Bianchi et al. (2013) demonstrated, in human listeners, that both click-evoked otoacoustic emissions and brainstem-evoked responses were suppressed for the second of a pair of clicks with ICI in the range of 1–4 ms. That result supports a peripheral origin of onset dominance at 2-ms ICI in the current study. Second, Remme et al. (2014) investigated the membrane properties of binaural neurons in the lateral and medial superior olivary nuclei (LSO and MSO, respectively) of the guinea pig auditory brainstem. Differences in these properties across neurons support phasic responses that enhance coincidence detection in MSO and low-frequency LSO. High-frequency LSO cells, in contrast, favor energy integration over time, suggesting a central mechanism for differences in the degree of onset/offset weighting across frequency, and potentially for the temporal integration of late-arriving ILD at high frequencies (i.e., upweighting; see Stecker and Hafter, 2009). Finally, the importance of sound onsets for coding of fine-structure ITD at low frequencies (Stecker and Bibee, 2014) was elucidated by Dietz et al. (2014), who found neural responses in the gerbil MSO and inferior colliculus to be dominated by ITD cues present in the rising segments of an amplitude-modulated sound's envelope. A similar result was obtained in human listeners via magnetoencephalography (Dietz et al., 2013). That result suggests that brief intensity increases might act to “trigger” binaural processing in central auditory neurons (cf. binaural “restarting”; Hafter and Buell, 1990), yet another potential contributor to onset dominance in TWFs measured in the current study.
D. Modeling auditory peripheral effects on TWFs
A number of TWF features appear consistent with the influence of auditory filtering on the neural representation of these stimuli at different carrier frequencies. Specifically, large ICI- and frequency-dependent weights for the first and last click in each stimulus are consistent with monaural peripheral interactions, such as interference on the basilar membrane (Tollin, 1998; Tollin and Henning, 1998; Bianchi et al., 2013), hair-cell transduction (Hartung and Trahiotis, 2001), and adaptation in auditory-nerve fibers (Brown and Stecker, 2013). In order to quantify the potential influence of such effects, we utilized established peripheral and binaural models to predict TWFs, in absence of specific temporal transformations, for the stimuli presented in the current experiments.
The logic of this approach follows that of Tollin (1998) and Hartung and Trahiotis (2001) in that models of peripheral filtering and non-linear transformation (rectification, compression, and, in some cases, low-pass filtering for envelope extraction) were used to transform the monaural signal prior to binaural processing by coincidence detection. No model parameters were fit to data nor was binaural information weighted across time or frequency. Thus, any TWF features present in the modeled TWFs can be identified with the monaural transformations rather than with specific temporal enhancements (e.g., in central neurons; Dietz et al., 2014; Remme et al., 2014). The purpose of this modeling effort is, therefore, to ascertain which features of the data may be accounted for by peripheral effects, rather than to describe a comprehensive model that captures the full extent of the data.
Absent from this effort is any consideration of leaky or windowed temporal integration of the ongoing cue by central mechanisms. That issue was previously addressed by Stecker and Hafter (2009) and Stecker et al. (2013), who adapted the modeling approach of Akeroyd and Bernstein (2001) to model upweighting in click-train TWFs. Since the models employed in those studies do not feature frequency-dependent behavior, the modeled TWFs presented by Stecker et al. (2013) should apply equally to all conditions of the current study, and interested readers are directed to that paper. Future work might look to the results of Remme et al. (2014) to investigate frequency dependence in binaural temporal integration. Here, we focus exclusively on monaural peripheral effects that are known to vary across cochlear place.
1. Modeling methods
Modeling of psychophysical TWFs used the binaural toolbox described by Akeroyd (2001) to compute binaural cross-correlograms for stimuli similar to those employed in ITD conditions of the psychophysical experiments. Specifically, for each condition (combination of carrier frequency, ICI, and cue type), we generated 500 Gabor click trains, each with a base ITD of 0 and random per-click variation of ±100 μs ITD, as in the experiments themselves. Each stimulus was processed, using the toolbox function mcorrelogram, to compute the binaural cross product across delay (±1500 μs), following gammatone filtering, nonlinear rectification, and compression (see below) for each of 35 filter channels spanning 100 Hz–12 000 Hz center frequency (1 filter per ERB). The resulting output was then summed across frequency channels, and the delay giving the maximum summed cross product was selected as the model's “response” for that stimulus. Thus, aside from the effects of peripheral transformations, the model assumed equal weighting of ITD across time and frequency. After simulating 500 trials in this manner, a TWF was computed exactly as in the psychophysical experiments, and 95% bootstrapped confidence intervals were computed by resampling cases 1000 times and recomputing the TWF for each such bootstrapped sample.
Three versions of the binaural model were employed separately. In the first case (labeled “power-law”), filter outputs were subjected to half-wave rectification and power-law compression with an exponent of 0.4 (mcorrelogram option “power”). This model maintains sensitivity to ITD carried in the temporal fine structure of the filter outputs. In the second case (labeled envelope), mcorrelogram option “envelope” was selected, which extracts and compresses (exponent = 0.23) the temporal envelope of each filter output, prior to half-wave rectification, expansion (exponent = 2.0), and low-pass filtering at 425 Hz as described by Bernstein and Trahiotis (1996). This approach preserves the envelope ITD cues—but attenuates fine-structure cues—in the filter outputs. In the third and final case (labeled “low-pass”), the envelope processing was modified by including an additional second-order 150-Hz low-pass filter after the monaural transduction stage(s) described for the previous case. This approach attempted to model the rate limitation in listeners' ability to make use of ongoing envelope ITD at high carrier frequency, as described by Bernstein and Trahiotis (1994, 2002). Note that all three models were applied to all four tested frequencies, despite that (i) the envelope and low-pass models severely attenuate the potent fine-structure cues present in the unprocessed 1–2 kHz stimuli (see Fig. 8), and (ii) the 150 Hz filter of the low-pass model was specifically developed to account for processing in high-frequency sounds that lack such usable fine-structure cues and, thus, not intended for use at low frequencies (see Bernstein and Trahiotis, 2002).
FIG. 8.
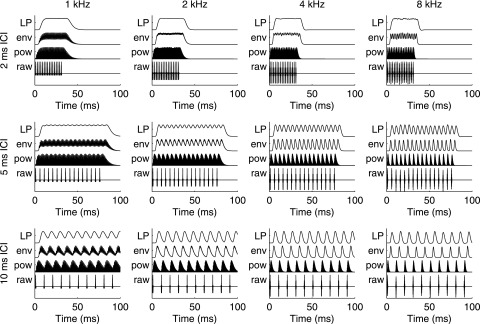
Experimental stimuli after transformation by auditory peripheral models. Each panel plots normalized waveforms of the input stimulus (“raw,” bottom trace) and the monaural outputs of each model; the power-law model (“pow,” second from bottom) includes effects of peripheral transduction following filtering by a single gammatone filter centered on the stimulus carrier frequency; the envelope model (“env,” second from top) features envelope extraction after peripheral filtering, and the low-pass model (“LP,” upper trace) features additional low-pass filtering of the envelope following extraction. Each waveform is normalized to its maximum value. Panels are organized as in previous figures, with carrier frequency arranged in columns from 1 kHz (left) to 8 kHz (right) and ICI arranged in rows from 2 ms (top) to 10 ms (bottom). Note that only the initial ten clicks are depicted in the plots for 10-ms ICI.
E. Modeling results
The monaural transformations of the stimuli by each model are depicted in Fig. 8. In each case, the output of a single frequency channel, matched to the stimulus carrier frequency, is plotted. At 10-ms ICI (bottom row), the response to each individual click is clearly visible in the output of each model. The temporal fine structure of the analysis filter's impulse response is preserved by the “power-law” model, but dramatically reduced by the envelope and low-pass models. Similar features are apparent at 5-ms ICI (middle row), with the addition of clear frequency-dependent overlap in the responses to individual clicks. At 2-ms ICI (top row), extensive overlap severely attenuates modulations in the envelope output. Additional filtering in the low-pass model virtually eliminates the contributions of individual clicks in this case, regardless of carrier frequency. Subsequent binaural cross-correlation in that case should, thus, be completely dominated by sound onset and offset.
Results of the binaural models are presented in Figs. 9 and 10. In Fig. 9, different symbols plot the TWFs for each version of the model, normalized to the maximum weight in each TWF. Gray lines plot the corresponding mean behavioral TWFs, normalized in the same manner. Several features of the model TWFs appear at least roughly consistent with psychophysical TWFs. First, to the extent that temporal variation occurred in the weights, such variation was greater for 2-ms ICI than for 5-ms or 10-ms ICI. All three models agree in predicting flat weighting functions at 10-ms ICI for all carrier frequencies. Second, for the envelope-based models (envelope and low-pass), TWFs most strongly emphasized the first and last clicks in a train. Larger effects were observed for lower carrier frequencies, consistent with the psychophysical results. The magnitudes of onset and offset weights produced by the envelope model were also roughly consistent with the psychophysical data, with ARonset and ARoffset values ranging up to ∼4 (Fig. 10). In contrast, the low-pass model overestimated the values ARonset and ARoffset, apparently as a consequence of the middle clicks' near-zero weights, which differ from the small positive weights observed in behavioral TWFs. The temporal profile of weights in the normalized TWFs for the low-pass model was, in many respects, quite similar to that observed psychophysically, especially at lower frequencies. That result suggests that ITD-based lateralization may be strongly dependent on cues available during envelope fluctuations (Dietz et al., 2013, 2014; Stecker and Bibee, 2014). For low carrier frequency and short ICI, the low-pass modeled TWFs also contain large and systematic weight variations, including negative weights consistent with the kind of “anomalous lateralization” that has been previously observed for pairs and trios of broadband clicks at short delay (Wallach et al., 1949; Tollin and Henning, 1998). Although some qualitatively similar patterns may be observed in the psychophysical data, click-to-click variations were not large compared to variability in the bootstrapped estimates, and significant negative weights were not observed in any of the behavioral ITD conditions. Finally, none of the models predicted systematic weight increases as captured by rise in the behavioral data. Near-zero model predictions of rise are consistent with the temporal stationarity of peripheral filtering and transduction, and with these models' lack of dynamic temporally integrative mechanisms (see Stecker et al., 2013).
FIG. 9.
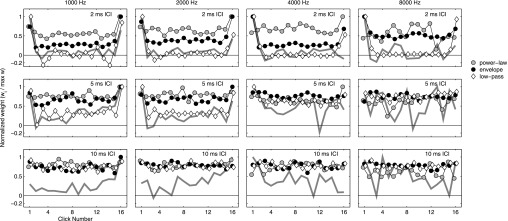
TWFs computed from binaural modeling of ITD-based lateralization. Symbols plot normalized TWFs computed based on binaural cross-correlation of auditory-filtered waveforms (“power-law,” gray circles), their envelopes (“envelope,” black circles), or low-pass-filtered versions of the envelopes (“low-pass,” white diamonds). TWFs were estimated from 500 simulated psychophysical trials in each condition, selecting the peak of the binaural cross-correlation function (after averaging across frequency bands) as the “lateralization response” on each trial. Symbols plot weights computed as for behavioral data, normalized to the maximum weight in each TWF for plotting. Thick gray line in each panel plots the overall mean TWF from behavioral data for ITD (i.e., the data from Fig. 2), here normalized to the maximum weight in each TWF. Panels are organized as in Fig. 2, with carrier frequencies left to right and ICI top to bottom. Note that auditory peripheral effects, as incorporated in the model, account for some degree of onset and offset weight elevation at short ICI. Low-pass filtering of envelope representations further enhances these effects and extends them to 5-ms ICI at low frequencies. Model TWFs do not suggest gradually increasing weights over the sound duration (i.e., upweighting) for any combination of frequency and ICI.
FIG. 10.

AR and rise values for model TWFs plotted in Fig. 9. Formatted similarly to Fig. 4, values of ARonset (top panel), ARoffset (middle panel), and rise (bottom panel) are plotted for simulations using the envelope (left side of each plot) and low-pass (right side) versions of the TWF model. Data for the “power-law” model have been omitted for clarity, as very little weight variation (and, thus, negligible values on all three statistics) was observed in TWFs for that condition. Envelope model TWFs capture the ICI-dependent elevations of onset and offset weights (AR > 1) present in the human data at low frequencies, but fail to capture any gradual trends in weight over time (i.e., rise = 0). Low-pass model TWFs exaggerate these effects, but overestimate the degree of AR present in the human data, and incorrectly predict large offset weights (ARoffset > 1) even at 4–8 kHz.
Overall, the modeling results support the view that effects of the auditory periphery and early monaural processing contribute to the onset- and offset-specific weight elevations observed at short ICI and low carrier frequency (Tollin, 1998; Bianchi et al., 2013). The failure of the simplest (“power-law”) model to capture these effects suggests that cochlear filtering alone (at least as captured by the gammatone filterbank) is not sufficient to account for those phenomena. The clearer effects observed for the envelope and low-pass models suggest that interclick interactions must also reflect additional neural stages with effectively low-pass characteristics (Remme et al., 2014).
V. SUMMARY AND CONCLUSIONS
-
(1)
Onsets dominate lateralization by ITD and ILD when the ICI is short, regardless of carrier frequency. Consistent with previous reports of localization dominance (i.e., precedence effects) for click pairs and click trains centered at 4 kHz, onset clicks dominated lateral-position judgments for both ITD and ILD at 2-ms ICI. That effect was consistently observed across carrier frequencies ranging from 1 kHz (in which case, sounds included significant low-frequency energy) to 8 kHz. A modest decrease in the magnitude of onset dominance was observed as carrier frequency increased, in contrast to the expectation of greater onset dominance due to the reduced availability of ongoing cues at higher frequencies.
-
(2)
Reduction of lateralization weights following onset is immediate. Again, consistent with previous reports, the temporal pattern of click weights suggests that onset dominance reflects the greater contribution of binaural cues carried by the onset click per se, rather than a gradual decline in binaural information following sound onsets. In some cases (e.g., for ITD at low carrier frequency), clicks 2–3 received the lowest overall weights.
-
(3)
For sounds with low-frequency energy presented at short ICI, lateralization weights also favor offset clicks. TWFs for low-frequency, high-rate sounds featured elevated onset and offset weights. Both features are consistent with the impacts of auditory filtering and monaural transduction on stimulus representations for rapidly occurring events.
-
(4)
“Upweighting” of late-arriving sound affects low-frequency ITD, high-frequency ILD. For ICI values of 5–10 ms, TWFs in several conditions demonstrated weights that increased gradually over the sound duration. That pattern is consistent with the expected effects of leaky temporal integration of binaural information (Stecker and Hafter, 2009), and was observed for ITD at 1–2 kHz carrier frequency, and for ILD at 2–8 kHz carrier frequency. The result suggests that when salient binaural cues are available in the post-onset portion of a sound, their impact on lateralization judgments occurs via temporally integrative mechanisms that favor late-arriving (i.e., recent) sound.
ACKNOWLEDGMENTS
Thanks to Julie Stecker, Jackie Bibee, and Anna Diedesch for data collection and reporting. This work is supported by NIDCD R01-DC011548. Portions of this work were previously described in proceedings form (Stecker, 2013). This manuscript is the fourth in a series of papers investigating the temporal weighting of ITD and ILD in filtered click trains. The first (Brown and Stecker, 2010) and second (Brown and Stecker, 2011) measured TWFs for binaural discrimination at 4 kHz carrier frequency, whereas the third (Stecker et al., 2013) measured TWFs for lateralization judgments also at 4 kHz.
Footnotes
The mean of ITD across clicks thus varied slightly from trial to trial, following an approximately normal distribution centered on the base ITD with σ ≈ 14 μs.
Some subjects were unable to complete all eight runs in every condition, but completed a minimum of four in every condition. At least five of the subjects completed all eight runs in any given condition.
Stecker and Hafter (2009) computed rise from w2 to wN. That calculation would appear biased by the discretely elevated offset weights (wN) that were observed in some conditions of the current study. Hence, a limited range was used in the current analysis.
One-tailed tests were employed to test effects only in the direction indicated by the literature, e.g., AR > 1, rise > 0, and AR(2-ms ICI) > AR(5-ms ICI). In each case, lower values would indicate no effect rather than a negative effect.
Both ARoffset and rise underestimate any gradual weight increases that continue to the end of the stimulus: ARoffset because the numerator and denominator in Eq. (5) include similar values in that case, and rise because the final (and largest) weight is omitted from the linear fitting.
References
- 1. Abel, S. M., and Kunov, H. (1983). “ Lateralization based on interaural phase differences: Effects of frequency, amplitude, duration, and shape of rise/decay,” J. Acoust. Soc. Am. 73, 955–960. 10.1121/1.389020 [DOI] [PubMed] [Google Scholar]
- 2. Akeroyd, M. A. (2001). “ A binaural cross-correlogram toolbox for MATLAB,” Technical Report, University of Connecticut Health Center/University of Sussex, software downloadable from http://www.ihr.mrc.ac.uk/projects/matlab/binaural_toolbox (Last viewed 10 Oct. 2014).
- 3. Akeroyd, M. A., and Bernstein, L. R. (2001). “ The variation across time of sensitivity to interaural disparities: Behavioral measurements and quantitative analyses,” J. Acoust. Soc. Am. 110, 2516–2526. 10.1121/1.1412442 [DOI] [PubMed] [Google Scholar]
- 4. Bernstein, L. R., and Trahiotis, C. (1994). “ Detection of interaural delay in high-frequency sinusoidally amplitude-modulated tones, two-tone complexes, and bands of noise,” J. Acoust. Soc. Am. 95, 3561–3567. 10.1121/1.409973 [DOI] [PubMed] [Google Scholar]
- 5. Bernstein, L. R., and Trahiotis, C. (1996). “ The normalized correlation: Accounting for binaural detection across center frequency,” J. Acoust. Soc. Am. 100, 3774–3784. 10.1121/1.417237 [DOI] [PubMed] [Google Scholar]
- 6. Bernstein, L. R., and Trahiotis, C. (2002). “ Enhancing sensitivity to interaural delays at high frequencies using ‘transposed stimuli,’ ” J. Acoust. Soc. Am. 112, 1026–1036. 10.1121/1.1497620 [DOI] [PubMed] [Google Scholar]
- 7. Bernstein, L. R., and Trahiotis, C. (2014). “ Sensitivity to envelope-based interaural delays at high frequencies: Center frequency affects the envelope rate-limitation,” J. Acoust. Soc. Am. 135, 808–816. 10.1121/1.4861251 [DOI] [PMC free article] [PubMed] [Google Scholar]
- 8. Bianchi, F., Verhulst, S., and Dau, T. (2013). “ Experimental evidence for a cochlear source of the precedence effect,” J. Assoc. Res. Otolaryngol. 14, 767–779. 10.1007/s10162-013-0406-z [DOI] [PMC free article] [PubMed] [Google Scholar]
- 9. Brown, A. D., and Stecker, G. C. (2010). “ Temporal weighting of interaural time and level differences in high-rate click trains,” J. Acoust. Soc. Am. 128, 332–341. 10.1121/1.3436540 [DOI] [PMC free article] [PubMed] [Google Scholar]
- 10. Brown, A. D., and Stecker, G. C. (2011). “ Temporal weighting functions for interaural time and level differences. II. The effect of binaurally synchronous temporal jitter,” J. Acoust. Soc. Am. 129, 293–300. 10.1121/1.3514422 [DOI] [PMC free article] [PubMed] [Google Scholar]
- 11. Brown, A. D., and Stecker, G. C. (2013). “ The precedence effect: Fusion and lateralization measures for headphone stimuli lateralized by interaural time and level differences,” J. Acoust. Soc. Am. 133, 2883–2898. 10.1121/1.4796113 [DOI] [PMC free article] [PubMed] [Google Scholar]
- 12. Buell, T. N., Griffin, S. J., and Bernstein, L. R. (2008). “ Listeners' sensitivity to ‘onset/offset’ and ‘ongoing’ interaural delays in high-frequency, sinusoidally amplitude-modulated tones,” J. Acoust. Soc. Am. 123, 279–294. 10.1121/1.2816399 [DOI] [PubMed] [Google Scholar]
- 13. Dietz, M., Marquardt, T., Salminen, N. H., and McAlpine, D. (2013). “ Emphasis of spatial cues in the temporal fine structure during the rising segments of amplitude-modulated sounds,” Proc. Natl. Acad. Sci U.S.A. 110, 15151–15156. 10.1073/pnas.1309712110 [DOI] [PMC free article] [PubMed] [Google Scholar]
- 14. Dietz, M., Marquardt, T., Stange, A., Pecka, M., Grothe, B., and McAlpine, D. (2014). “ Emphasis of spatial cues in the temporal fine structure during the rising segments of amplitude-modulated sounds II: Single-neuron recordings,” J. Neurophysiol. 111, 1973–1985. 10.1152/jn.00681.2013 [DOI] [PMC free article] [PubMed] [Google Scholar]
- 15. Efron, B., and Tibshirani, R. (1986). “ Bootstrap methods for standard errors, confidence intervals, and other measures of statistical accuracy,” Stat. Sci. 1, 54–75. 10.1214/ss/1177013815 [DOI] [Google Scholar]
- 16. Fox, J. (2008). Applied Regression Analysis and Generalized Linear Models ( Sage Publications, Thousand Oaks, CA: ), Chap. 21, pp. 587–606. [Google Scholar]
- 17. Freyman, R. L., Zurek, P. M., Balakrishnan, U., and Chiang, Y. C. (1997). “ Onset dominance in lateralization,” J. Acoust. Soc. Am. 101, 1649–1659. 10.1121/1.418149 [DOI] [PubMed] [Google Scholar]
- 18. Hafter, E. R., and Buell, T. N. (1990). “ Restarting the adapted binaural system,” J. Acoust. Soc. Am. 88, 806–812. 10.1121/1.399730 [DOI] [PubMed] [Google Scholar]
- 19. Hafter, E. R., and Dye, R. H. J. (1983). “ Detection of interaural differences of time in trains of high-frequency clicks as a function of interclick interval and number,” J. Acoust. Soc. Am. 73, 644–651. 10.1121/1.388956 [DOI] [PubMed] [Google Scholar]
- 20. Hartung, K., and Trahiotis, C. (2001). “ Peripheral auditory processing and investigations of the ‘precedence effect’ which utilize successive transient stimuli,” J. Acoust. Soc. Am. 110, 1505–1513. 10.1121/1.1390339 [DOI] [PubMed] [Google Scholar]
- 21. Litovsky, R. Y., Colburn, H. S., Yost, W. A., and Guzman, S. J. (1999). “ The precedence effect,” J. Acoust. Soc. Am. 106, 1633–1654. 10.1121/1.427914 [DOI] [PubMed] [Google Scholar]
- 22. Remme, M. W. H., Donato, R., Mikiel-Hunter, J., Ballestero, J. A., Foster, S., Rinzel, J., and McAlpine, D. (2014). “ Subthreshold resonance properties contribute to the efficient coding of auditory spatial cues,” Proc. Natl. Acad. Sci. U.S.A. 111, E2339–E2348. 10.1073/pnas.1316216111 [DOI] [PMC free article] [PubMed] [Google Scholar]
- 23. Saberi, K. (1996). “ Observer weighting of interaural delays in filtered impulses,” Percept. Psychophys. 58, 1037–1046. 10.3758/BF03206831 [DOI] [PubMed] [Google Scholar]
- 24. Stecker, G. C. (2010). “ Trading of interaural differences in high-rate gabor click trains,” Hear. Res. 268, 202–212. 10.1016/j.heares.2010.06.002 [DOI] [PMC free article] [PubMed] [Google Scholar]
- 25. Stecker, G. C. (2013). “ Effects of carrier frequency and bandwidth on temporal weighting of binaural differences,” Proc. Meet. Acoust. 19, 050166. 10.1121/1.4799585 [DOI] [Google Scholar]
- 26. Stecker, G. C., and Bibee, J. M. (2014). “ Nonuniform temporal weighting of interaural time differences in 500 Hz tones,” J. Acoust. Soc. Am. 135, 3541–3547. 10.1121/1.4876179 [DOI] [PMC free article] [PubMed] [Google Scholar]
- 27. Stecker, G. C., and Brown, A. D. (2010). “ Temporal weighting of binaural cues revealed by detection of dynamic interaural differences in high-rate Gabor click trains,” J. Acoust. Soc. Am. 127, 3092–3103. 10.1121/1.3377088 [DOI] [PMC free article] [PubMed] [Google Scholar]
- 28. Stecker, G. C., and Brown, A. D. (2012). “ Onset- and offset-specific effects in interaural level difference discrimination,” J. Acoust. Soc. Am. 132, 1573–1580. 10.1121/1.4740496 [DOI] [PMC free article] [PubMed] [Google Scholar]
- 29. Stecker, G. C., and Hafter, E. R. (2002). “ Temporal weighting in sound localization,” J. Acoust. Soc. Am. 112, 1046–1057. 10.1121/1.1497366 [DOI] [PMC free article] [PubMed] [Google Scholar]
- 30. Stecker, G. C., and Hafter, E. R. (2009). “ A recency effect in sound localization?,” J. Acoust. Soc. Am. 125, 3914–3924. 10.1121/1.3124776 [DOI] [PMC free article] [PubMed] [Google Scholar]
- 31. Stecker, G. C., Ostreicher, J. D., and Brown, A. D. (2013). “ Temporal weighting functions for interaural time and level differences. III. Temporal weighting for lateral position judgments,” J. Acoust. Soc. Am. 134, 1242–1252. 10.1121/1.4812857 [DOI] [PMC free article] [PubMed] [Google Scholar]
- 32. Tollin, D. J. (1998). “ Computational model of the lateralization of clicks and their echoes,” in Computational Models of Auditory Function, edited by Greenberg S. and Slaney M. ( IOS Press, Amsterdam: ), pp. 77–82. [Google Scholar]
- 33. Tollin, D. J., and Henning, G. B. (1998). “ Some aspects of the lateralization of echoed sound in man. I. The classical interaural-delay based precedence effect,” J. Acoust. Soc. Am. 104, 3030–3038. 10.1121/1.423884 [DOI] [PubMed] [Google Scholar]
- 34. Tollin, D. J., and Henning, G. B. (1999). “ Some aspects of the lateralization of echoed sound in man. II. The role of the stimulus spectrum,” J. Acoust. Soc. Am. 105, 838–849. 10.1121/1.426273 [DOI] [PubMed] [Google Scholar]
- 35. Wallach, H., Newman, E. B., and Rosenzweig, M. R. (1949). “ The precedence effect in sound localization,” Am. J. Psych. 62, 315–336. 10.2307/1418275 [DOI] [PubMed] [Google Scholar]
- 36. Zurek, P. M. (1980). “ The precedence effect and its possible role in the avoidance of interaural ambiguities,” J. Acoust. Soc. Am. 67, 952–964. 10.1121/1.383974 [DOI] [PubMed] [Google Scholar]