Figure 2.
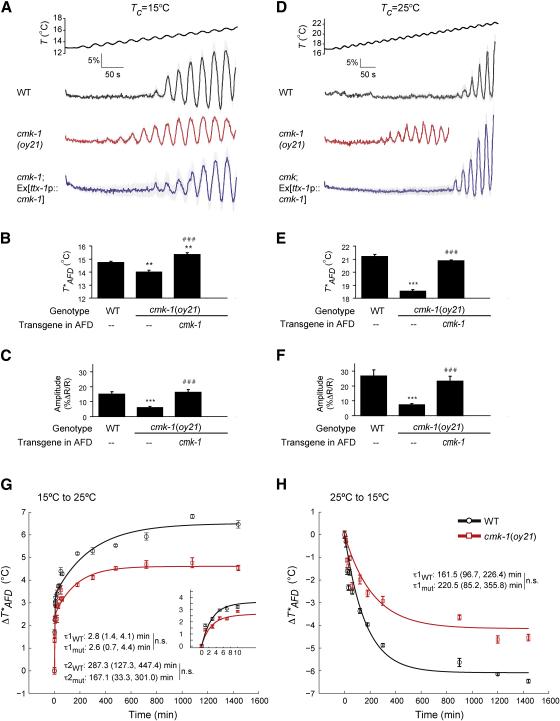
T*AFD and AFD thermosensory responses are decreased in cmk-1 mutants. A-F. Average calcium responses in AFD evoked by a rising temperature stimulus. Since all animals were imaged for the same period of time, imaging of cmk-1(oy21) animals grown at 25°C was terminated at a lower temperature. Error bars are SEM. n≥9 neurons each. (B, E) Average T*AFD and (C, F) average response amplitudes (see Supplemental Experimental Procedures) in the indicated strains. ** and *** indicate different from wild-type values at P<0.01 and 0.001, respectively; ### indicates different from cmk-1(oy21) at P<0.001 (ANOVA and Bonferroni post-hoc corrections). Also see Table S1 for average T*AFD at different growth temperatures.
G-H. Dynamics of T*AFD adaptation in wild-type and cmk-1(oy21) animals during temperature shift over 24 hours or the initial 10 minutes (G inset). Black and red lines are exponential fits to the data for wild-type and cmk-1(oy21) mutants, respectively. Time constants (±95% confidence interval) are indicated. n.s. – not significantly different between indicated values. WT – wildtype, mut – cmk-1(oy21). Strains were examined together on multiple days. Each point is the average of 5-10 AFD neurons; error bars are SEM.

