Abstract
Soybean farming has brought economic development to parts of South America, as well as environmental hopes and concerns. A substantial hope resides in the decoupling of Brazil's agricultural sector from deforestation in the Amazon region, in which case expansive agriculture need not imply forest degradation. However, concerns have also been voiced about the potential indirect effects of agriculture. This article addresses these indirect effects forthe case of the Brazilian Amazon since 2002. Our work finds that as much as thirty-two percent of deforestation, or the loss of more than 30,000 km2 of Amazon forest, is attributable, indirectly, to Brazil's soybean sector. However, we also observe that the magnitude of the indirect impact of the agriculture sector on forest loss in the Amazon has declined markedly since 2006. We also find a shift in the underlying causes of indirect land use change in the Amazon, and suggest that land appreciation in agricultural regions has supplanted farm expansions as a source of indirect land use change. Our results are broadly congruent with recent work recognizing the success of policy changes in mitigating the impact of soybean expansion on forest loss in the Amazon. However, they also caution that the soybean sector may continue to incentivize land clearings through its impact on regional land markets.
Keywords: Indirect land use change, Agriculture, Deforestation, Amazon, Brazil
1. Introduction
Over the last decade Brazil's expansive soybean sector has reshaped the nation's physical and socioeconomic landscape. While evidence indicates positive socioeconomic changes associated with soybean production (VanWey et al., 2013; Weinhold et al., 2013), researchers and policy makers have nonetheless fretted over the environmental implications of expanding soybean agriculture in the tropics (Searchinger et al., 2008). Most notably, research has tied Brazil's soybean sector to more than 5000 km2 of deforestation in State of Mato Grosso alone (Morton et al., 2006); and, through statistical correlations, to land use change more broadly across tropical Amazonia (Barona et al., 2010; Lapola et al., 2010; Arima et al., 2011).
In this article we follow work addressing the indirect effects of the agriculture sector, which we refer to as indirect land use change (ILUC).We define ILUC as a land use change in one location that is responsive to a land use change in another, potentially distant location. We theorize that this occurs through two mechanisms: (1) through the spatial relocation of key agricultural and ranching inputs, including human and financial capital (Barona et al., 2010; Lapola et al., 2010; Arima et al., 2011); and (2) through land appreciation in frontier areas linked to high returns to soybean production.
In our models we estimate that Brazil's soybean sector has contributed, indirectly, to as much as thirty-two percent of forest loss in the Brazilian Amazon since 2002. We tie one-third of this indirect deforestation to agricultural expansion and land valuation in Brazil's distant agricultural strongholds in its southern states. We then argue that work to date on indirect land use change has largely overlooked the broader impacts of the agricultural sector on the demand for land in Brazil, and on land speculation and appreciation on the frontier. We also argue that policy makers must pay close attention to the complications that arise from spatially complex land change, which links environmental change in remote frontiers such as Amazonia to land use and land values in established agricultural regions.
We organize the paper as follows. First, we engage with the growing body of literature that considers ILUC in Brazil's Amazon region. This then leads to our conceptualization of the indirect effect, which we argue is driven by increasing land values and the growing demand for land. We then present a statistical analysis of ILUC where we spatially distribute the indirect effects of the agricultural sector through Brazil's road network, and where we pay particular attention to temporal shifts in economic conditions and environmental policies. Finally, after a discussion of our statistical results we draw out several important policy implications.
2. Amazon deforestation and the indirect effects of agricultural change
Quantitative attempts to describe or estimate indirect land use change have been prosecuted at the international, national, and regional scales. Much of this work has focused on the impact of US and European biofuel policies, or on the impact of American corn or ethanol subsidies and trade mandates on production areas in the US, Brazil, or Indonesia (Fargione et al., 2008; Searchinger et al., 2008; Keeney and Hertel, 2009). This research has focused on estimating the carbon impacts associated with the land use changes predicted to be needed to meet new demand for biofuel or ethanol production. In this body of research ILUC hinges on the elasticities of commodity prices to decreases or increases in global production areas (Keeney and Hertel, 2009; Hertel et al., 2010b). Thus a shift in corn production in the American Midwest might come at the expense of soybeans, which, in turn, would trigger an increase in soybean prices and a subsequent expansion of soybean cultivation in distant nations (e.g., such as Brazil).
Other research focused on Brazil specifically, or on the Amazon exclusively, has suggested that ILUC stems not only from changing returns to agricultural commodities, but from the internal redistribution of rural skills and capital. This work has focused on land use displacement, and the notion that any agricultural expansion comes, in part, through the displacement and reconstitution of pastures in frontier areas (Gasparri and Polain de Waroux, 2014; Meyfroidt et al., 2014).
To assess the extent to which displacement has led to deforestation in the Amazon, researchers have implemented both spatially explicit computational models (Lapola et al., 2010) and statistical analyses (Barona et al., 2010; Arima et al., 2011; Andrade de Sá et al., 2012). In this article we build on the recent efforts of Arima et al. (2011) by modeling distal relationships in a statistical framework. However, we advance from this past research on three fronts. First, we conceptualize the indirect effect as a function of not only market phenomena (e.g., prices, supply elasticities), or of the mobility of people and capital (displacement), but as the effect of land appreciation driven by agricultural returns. Second, we expand our analytical and spatial scope to incorporate impacts associated with Brazil's southern agricultural states (Andrade de Sá et al., 2012; Richards, 2012b; Walker and Richards, 2013). Southern Brazil, we note, has traditionally served as a feeder region for capital and skills to the agricultural frontiers of central Brazil (Margolis, 1973; Jepson, 2006; Richards, 2012a). Finally, we acknowledge that ILUC may be attributable to multiple mechanisms, and that these mechanisms shift with time. Thus, we not only estimate ILUC, but test our estimates across two time periods: pre and post-2006, or before and after the decline in soybean returns, and the contemporaneous intensification of Brazil's environmental policy.
3. Theoretical considerations: indirect land use change in a location-rent context
Land use change is the result of human behavior, and of decisions made given both local considerations (land suitability, available skills, culture and experience, and access to capital) and structural context (e.g., markets, access, policies, and institutions). Place, and location with respect to other land uses, also affect land use, both on the demand side, in terms of regional or local demand for rural resources, and from the supply side, via the decreased transaction costs and increased production knowledge associated with agglomeration economies (Robalino and Pfaff, 2012; Garrett et al., 2013a). For an indirect land use to take place, which in the context of this article amounts to tying a land clearing on the frontier to changes in the agriculture sector elsewhere in Brazil, the agriculture sector must alter micro-level incentive structures in frontier regions. This can occur through a change in either the local or structural level conditions that allow such rents to come into existence. To date, work on indirect land use change has suggested that this occurs through one of two processes: (1) from the demand side, via an increase in returns to beef production; or (2) through the supply side, through the spatial relocation of ranching capital from the periphery of an agricultural frontier to forested regions (Andrade de Sá et al., 2013; Gasparri and Polain de Waroux, 2014; Meyfroidt et al., 2014). We pause to consider both of these mechanisms, before adding a third channel by which the agricultural sector is capable of reshaping production decisions on the frontier: land appreciation.
Much of the literature on ILUC has focused on the impact of US and European biofuel policies on Brazil's agricultural sector (Searchinger et al., 2008; Hertel et al., 2010a), or of the impact of Brazil's agricultural sector on returns to beef production (Walker, 2011; Walker and Richards, 2013; Walker, 2014). In this literature, if expanding agriculture encroaches on ranching, it is also acting to reduce beef supplies. This, in turn, could raise beef prices, which sparks a compensatory expansion of pastures to bring new lands into production (Walker, 2001; Angelsen, 2007; Walker and Richards, 2013; Cohn et al., 2014). While we hardly refute this effect, or the potential impact of soybean expansion on beef prices, we point out that pasture areas have actually increased far beyond the areas occupied by soybean farmers in recent years. Perhaps more importantly, at the height of the soybean boom, from 2001–2004, approximately 6000 km2 of pasture were converted to cropland in Mato Grosso (Morton et al., 2006). If we assume that this equates to roughly 600,000 animals (with one animal per hectare), this amounts to only three percent of the state's total cattle herd, and less than 0.3 percent of Brazil's total supply. Presumably, any price effect from the supply reduction would be minimal. We thus turn our attention to the second means by which researchers have suggested that Brazil's agricultural sector has led, indirectly, to regional scale forest loss, namely land use displacement.
From a behavioral perspective, land use displacement rests on the assumption that an expanding agricultural sector displaces human and financial capital from old ranching areas to the forest. If displaced individuals re-establish their operations in forest areas, and clear the forest in order to do so, then it follows that their initial displacement by the agricultural sector is, indirectly, altering production capacities in frontier regions (Meyfroidt et al., 2010; Andrade de Sá et al., 2012; Richards, 2012a; Gasparri and Polain de Waroux, 2014; Meyfroidt et al., 2014). At the micro-level, the displacement process spatially redistributes knowledge and investment capital from capital and knowledge-rich regions in core ranching or agricultural areas to Amazonian frontier regions, which are land abundant but capital-scarce (Ozorio de Almeida and Campari, 1995). As investment capital and production knowledge migrate to new areas, lands suitable for ranching are cleared for ranching, often with a greater than a one to one displacement of old pasture for new pasture (with deforestation). This occurs because the newly arrived ranchers may sell highly appreciated properties, and buy inexpensive land on the frontier.
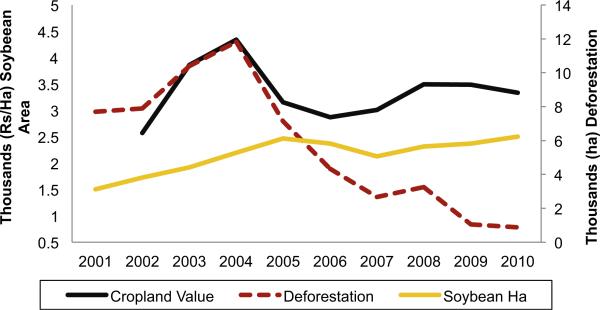
While we do not dismiss the previous two potential avenues for indirect influence to pass from the agricultural sector into frontier regions, we nonetheless argue that a third mechanism may be more prominent as a driver of deforestation. We refer to this third mechanism as a “land appreciation effect,” which functions as follows. High returns to agriculture increase both the availability of capital and the expected rent potential of cropland, thereby leading to land appreciation in agricultural districts. Land prices, however, are positively spatially auto-correlated, and changes in land values in one location raise values of land in nearby areas. This leads to increasing values for land in alternative, less intensive uses, or in this case, for pasture or forest lands that have yet to be cleared. As cropland or pasture values rise landowners will have a greater incentive to clear their forested properties. Consequently, the agriculture sector may indirectly impact land use decisions irrespective of any displacement effect, and without having any impact on global prices or supplies of soybeans or beef. The soybean boom of the early 2000s, which led not only to a near-doubling of cropland values across Mato Grosso, but to land appreciation more broadly across the Amazon, and especially in frontier regions closest to the expanding agricultural districts. Deforestation then increased with land appreciation, then fell when land values fell, before finally stabilizing in the middle of the decade (see Fig. 1).
Fig. 1.
Evolution of average real cropland values (adjusted for inflation to 2002 values), deforestation, and soybean area in Mato Grosso. Rising land values in the first half of the decade were mirrored by the rise, fall, and subsequent stabilization, in deforestation.
We designed our research around this conceptual pathway of ILUC, or where, as the value and demand for cropland increases in Brazil's core agricultural regions, new pressure is created to clear new lands, regionally, across Amazonia. Naturally, those frontier areas that are relatively close to agricultural regions would face comparatively higher pressure for deforestation than areas in more distant or less accessible locations.
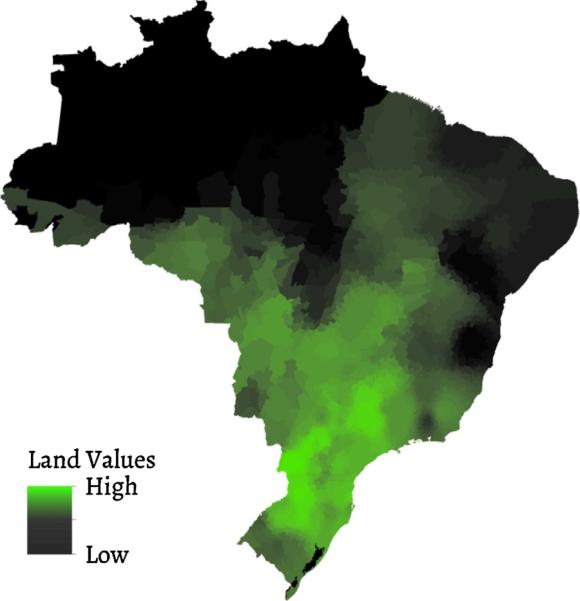
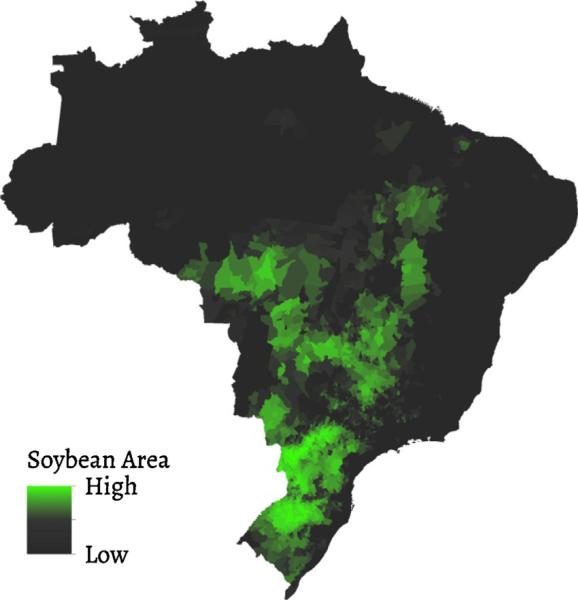
This leads directly to our statistical modeling, where we specify deforestation as not only a function of local changes in cattle production or pasture prices, but as a function of broader landscape changes and land appreciation occurring across Brazil. Our principal hypothesis is that those areas that are located in the closest proximity to the most densely planted and most valuable agricultural lands are those which are most likely to face the greatest pressure for deforestation. We test this hypothesis through a spatial model that couples the relationship between land appreciation and land use in agricultural areas across Brazil with deforestation in the Amazon region (Figs. 2 and 3).
Fig. 2.
Estimated cropland values, 2010. Values are highest in the agricultural districts of southern Brazil.
Fig. 3.
Percent of area planted soybean area, by county, 2010.
4. Analysis
Our analysis involves an application of panel econometrics to explain deforestation magnitudes, using Brazilian counties as observations. Following Arima et al. (2011), we use a spatial-Durbin model that enables the explicit representation of distal impacts on land change via the concept of “distant” neighbors, as discussed in Section 4.2 below. Our application provides a refinement of distance measures, the addition of key explanatory variables, and an expansion of the analysis extent to include all of Brazil, and not just the Amazon region. We begin with a description of our models, followed by our weighting structure and a description of the data
4.1. Modeling deforestation and indirect land use change
We model deforestation (Dt) as a function of local and distal effects, and of past levels of deforestation (Dt–1). Our models account specifically for local variation in cattle production (Ct–1) gross domestic product (GDPt–1), and pasture prices (PPt–1); and two spatially weighted structural variables: the indirect effect of agriculture (WIEt–2) and a weighted GDP effect (WGDPt–2). We estimate total deforestation in a log-log model, as a function of these variables and a set of fixed (ce) and year (γt) effects and e, or unobserved error (see Eq. (1)). We include local variables with one-year time lags, and two-year time lags for the weighted structural variables. We include the extra time lag for the structural effects under the assumption that changes in agricultural regions will have a delayed impact on land use change in the Amazon.
| (1) |
We test and compare four model variations: a fixed effects model (FE), an Anderson–Hsiao model (AH), an Arellano–Bond model (AB), and a first difference model (FD). The FD model takes the first difference for each variable (with the exception of the lagged dependent variable) and models rates of forest loss. In the FD model we include a series of control variables rather than a fixed effects parameter. The FE model is a standard fixed effects model that accounts for temporal variation in market prices and policy changes affecting the entire basin, and temporally static effects such as county size and soil type, through year and county level effects.
In the FE model, our estimated coefficients for the lagged dependent variable may be biased, given the potential correlation between εc,t–1 and Dc,t–1 (Nickell, 1981). We can account for this bias, however, by instrumenting for the lagged dependent variable. The two principal methods for instrumenting for the lagged dependent variable in panel data are the Anderson–Hsiao (AH) and Arellano–Bond models (AB); (Anderson and Hsiao, 1981; Arellano and Bond, 1991). In the AH model bias in the lagged dependent variable is reduced by creating instruments for the first lagged dependent variable from the respective second and third lags of Dc,t. This approach rests partly on the assumption that Dc,t–1 will be closely correlated with Dc,t–2 and Dc,t–3, but uncorrelated with ε c,t–1. The AB model follows the AH approach, and also estimates Dc,t–1 based on internal conditions, or on first differences; however, it includes additional instruments and employs a general method of moments (GMM) estimation method. In each of our models the variable of key interest is the weighted indirect effect WIE, or a spatially weighted measure of the value and area of cropland in Brazil. It is WIE that captures the effect of changes in the agricultural areas on deforestation in the Amazonian frontiers.
4.2. Variables and weighting mechanism
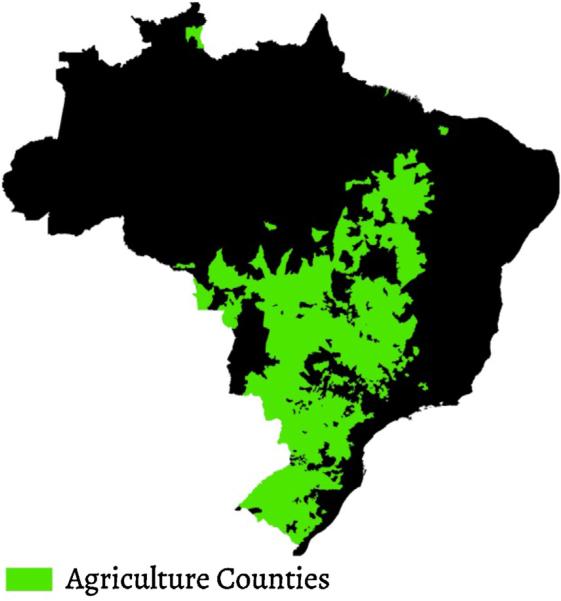
Estimating indirect land use change requires developing a variable for the indirect influence, I, stemming from agricultural change, and then distributing this influence to the areas at risk for deforestation. This requires at the outset a partition of Brazil into two sets of counties, namely a set of agricultural counties (a), or those counties that have farmed more than 500 ha of soybeans in any year since 2002, and a set of deforestation counties (c).
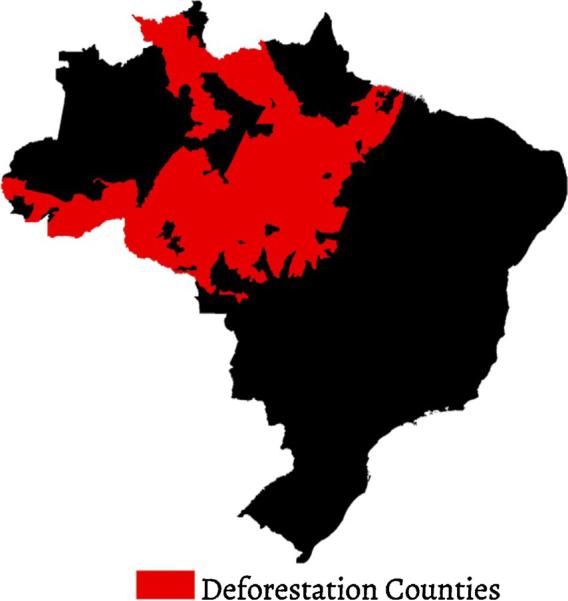
Our set of deforestation counties includes any county in the Legal Amazon, outside of the States of Tocantins and Maranhac̃o, that is more than thirty percent forested. We also omitted any counties that were not connected to Brazil's road network from our pool of deforestation counties. This left a final sample of 208 counties, which we then compiled into a ten year pool of 2080 observations. This set of impact counties includes most of the so-called arc of deforestation, and captures the majority of deforestation during the period 2002–2011 (e.g., ~110,000 of the ~132,000 km2 of total Amazon forest loss from 2002-to 2011 occurred in the counties included as impact counties (INPE, 2013)). We maintained a partition between the two sets (no agricultural effects were included in the deforestation counties), and omitted any deforestation counties from inclusion in our set of agricultural counties.
We estimate the influence of the agricultural sector, I, as the sum value of agricultural land in each Brazilian county. That is, we calculate I as the average real value of one hectare of cropland, V, multiplied by the total area of soybean production, A, in each agricultural county (a), for each year, t (Eq. (2)).
| (2) |
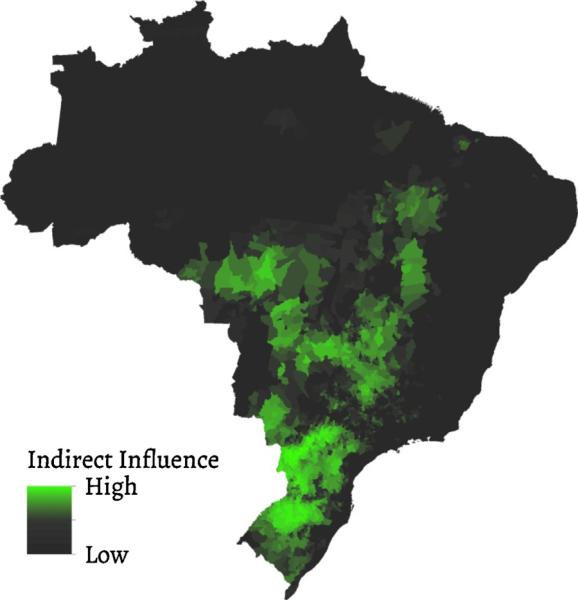
Per this formulation, I is highest in agricultural counties that feature a combination of more planted area and the most valuable croplands (see Figs. 4–6). We also test two alternative measures of I, namely where Ia,t = Aa,t and Ia,t = Va,t, or where ILUC is a function of solely soybean area Aa,t or cropland values, Va,t. Our general hypothesis is that counties that are in close proximity to counties wielding a higher level of I will exhibit higher levels of deforestation than peer counties located in areas farther from agricultural districts. Testing this hypothesis, however, requires distributing this influence over space. Our next step was to create a weighted neighborhood that linked each deforestation county, c, to the set of agricultural counties, a.
Fig. 4.
Deforestation counties.
Fig. 6.
Distribution of I, or planted soybean area * per hectare cropland value.
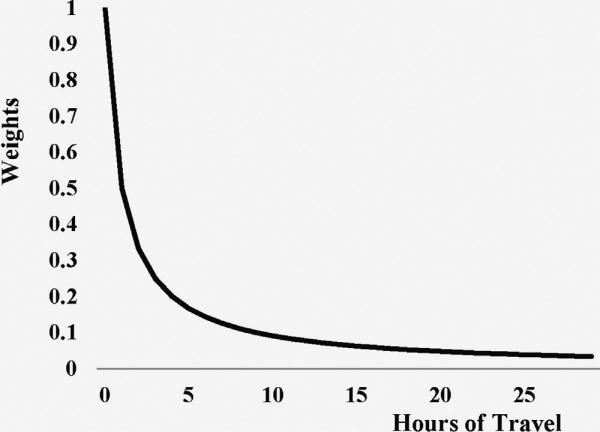
Following Arima et al. (2011), we created spatial neighborhoods for each of them from the set of agricultural counties, a, regarded as “distant” neighbors. We then weighted the influence of individual agricultural counties on the impact counties by calculating the “accessibility” provided by Brazil's federal and state road networks. In addition to physical nearness, accessibility between two arbitrary locations is a function of information availability, trade networks, and community and family ties. Despite this complexity, accessibility is often modeled by Euclidian distance, a proxy for transportation costs which affect land rentals as a function of both distance and freight rates. In this article we estimate transportation costs using travel times, constructed with ArcGIS's network analyst and shapefiles for Brazilian roads and cities provided by Brazil's Environmental Protection Agency, IBAMA. We start by estimating travel times between every one of Brazil's county seats; this yields in excess of 25,000,000 individual records (in a 5472 × 5472 matrix). We then take the reciprocal of each record, given in hours, to produce our “accessibility” weights, each one constituting an entry in our distance weighting matrix, w. For example, if it take 1.5 h to drive from county “c to a”, then the distance weight of “c on a” is 0.667. A drive of 10 h produces a weight of 0.1, and so on (Fig. 7). We then calculated ILUC, or WIE, (in Eq. 1), as the spatially weighted sum of cropland value from the set of agricultural counties.
| (3) |
Fig. 7.
Weighting mechanism, by hours of travel between cities.
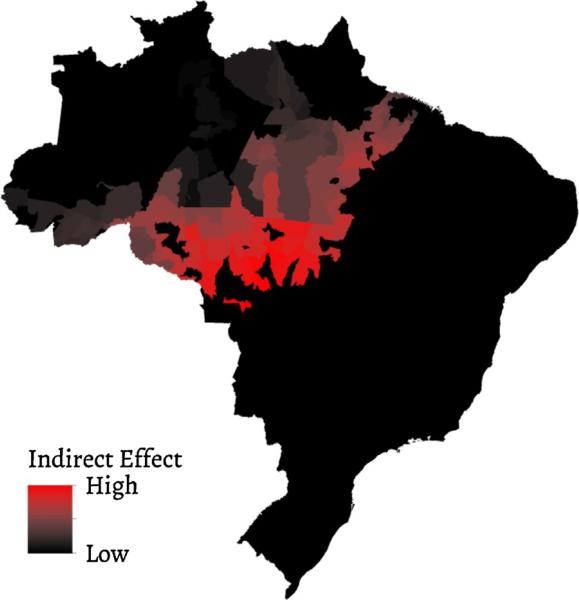
WIE varies relative to each county's location with respect to Brazil's highest valued and most densely planted agricultural regions. This reflects our hypothesis that indirect land use change should be highest in areas that are relatively close to the high value agricultural regions. We illustrate the spatial distribution of WIE in Fig. 8. WIE is strongest in northern and central Mato Grosso, areas that are comparatively closer to the densely planted and valuable agricultural regions of Brazil's southern states and southern Mato Grosso. In contrast, WIE is relatively low in the western and northern areas of the basin.
Fig. 8.
The indirect effect. Weighted indirect effect, distributed across the set of deforestation counties, 2010.
4.3. Data
We acquired land value data from annual statistics published by Informa Economics FNP (FNP) in their Agri-Annual series (FNP, 2002–2011). The FNP data included price indices for multiple land uses for selected counties across Brazil. We distilled this data into three land use categories: (1) natural land covers, (2) pasture, and (3) croplands. Where multiple land qualities were listed for one of the cover types (e.g., degraded/improved pasture or productive/ less productive agricultural land) the price for the higher land quality type was used. We linked the land price data to a pointfile of county centroid locations in ArcGIS, and then interpolated a continuous price landscape for pasture and cropland. We calculated average land values for each county from the interpolated value surface. This process was repeated for each year, from 2002 to 2011; however all land prices were deflated to year 2002 values based on Brazil's Consumer Price Index. In addition to land values, we also used data for municipal GDP (also deflated to 2002 values), soybean area, and cattle population, all of which were acquired from the Brazilian Institute of Geography and Statistics (IBGE, 2011, 2012). The dependent variable, deforestation, was produced by the Brazilian National Institute for Space Research (INPE) and downloaded through the PRODES project website (INPE, 2013). Descriptive statistics are included in Table 1.
Table 1.
Summary statistics.
| Units | Variable | Mean Statistics, by year |
||
|---|---|---|---|---|
| 2002 | 2006 | 2010 | ||
| km2 | Area | 11,082 | 11,082 | 11,082 |
| km2 | Area deforested | 1588 | 1952 | 2093 |
| $RS | Forest price | 244 | 292 | 300 |
| $RS | Pasture price | 665 | 921 | 1160 |
| $RS | Cropland price | 1391 | 2000 | 2329 |
| Head | Cattle population | 118,086 | 168,137 | 183,653 |
| $RS | GDP | 258,742 | 356,785 | 497,450 |
| Log WGDP | 16.21 | 16.52 | 16.74 | |
| Log WIE | 22.04 | 22.18 | 22.54 | |
4.4. Estimation results
We tested our models across three time periods: 2002–2011 (periodization 1); 2002–2006 (periodization 2); and 2007–2011 (periodization 3). The first periodization covers the extent of our dataset; the second, pre-2006 periodization captures the principal years of the soybean boom (2001–2004) and thus estimates deforestation before the increase in regulatory activities and protected areas expansions that occurred in or after 2006. The third periodization then estimates deforestation after the increase in regulatory activities and new institutional controls, and after the retraction in agricultural returns.
For periodization 1, our estimated coefficients for the indirect effect ranged from 0.13 for the AB model, to 0.39 for both the FE and AH model, to 0.45 for the FD model (see Table 2). The reported coefficients are elasticities, and indicate that a one percent increase in WIE would trigger between a 0.13 percent and 0.45 percent increase in forest loss (for the AB and FD models, respectively). Estimations of the elasticity of deforestation with respect to the indirect effect of the agriculture sector were significantly higher pre-2006 than post-2006. Pre-2006, we estimate elasticities of between 0.31 (using the FE approach) and 0.64 (FD model); however, in the latter period the estimate coefficients were far lower, from 0.01 in the AB model to 0.16 in the FD model (Table 3). These results are hardly unexpected, given that the structural and institutional incentives for forest clearing were dramatically altered between the two periodizations.
Table 2.
Regression results.
| Model | AB | FE | AH | FD |
|---|---|---|---|---|
| Deforestation(t–1) | 0.547** | 0.702** | 0.699** | –0.008** |
| Pasture prices(t–1) | –0.000 | –0.005* | –0.005** | –0.006 |
| Cattle head(t–1) | 0.006** | 0.001 | 0.001 | 0.000 |
| GDP(t–1) | 0.001 | –0.005 | –0.005* | –0.000** |
| WGDP (t–2) | 0.025 | 0.147** | 0.147** | –0.054 |
| WlE (t–2) | 0.132* | 0.386** | 0.386** | 0.446** |
| County fixed effects | Yes | Yes | Yes | No |
| Year effects | Yes | Yes | Yes | Yes |
| Area | Yes | |||
| Protected area | Yes | |||
| Average slope | Yes | |||
| Average elevation | Yes | |||
| Km to São Paulo | Yes | |||
| Total roads | Yes | |||
| Micro-region effects | Yes | |||
| State effects | Yes | |||
| Latitude | Yes | |||
| Longitude | Yes | |||
| Constant | –0.059 | –8.803** | –8.796** | 0.224* |
| R 2 | 0.94 | 0.50 | ||
| N | 1455 | 1663 | 1663 | 1455 |
Periodization 1: 2002-2011.
Dependent variable: log of total deforestation.
All variables are natural logs.
Reported coefficients are elasticities.
p < 0.05.
p < 0.01.
Table 3.
Indirect effect elasticities.
| Agricultural effect = weighted sum of crop area*crop prices | ||||
|---|---|---|---|---|
| Model type | AB | FE | AH | FD |
| 2002-2011 | 0.13** | 0.39** | 0.39** | 0.44** |
| 2002-2006 | 0.38** | 0.31** | 0.38** | 0.64** |
| 2007-2011 | 0.01 | 0.13** | 0.11** | 0.16** |
p < 0.01.
Finally, we considered two alternative measures of WIE. As we described in Section 4.2, we created and weighted two alternative measures of influence from the agricultural sector: a weighted cropland area variable and a weighted cropland value variable. We reran our models over the three periodizations, and compared the results (Table 4). Notably, we find that in each of the models the indirect impact of cropland area on deforestation is far larger in the pre-2006 periodization than in periodization 3. In the AB model, for example, the elasticity of deforestation with respect to change in agricultural area fell from 0.42 to −0.06. Cropland values, however, were a more influential factor in deforestation in periodization 3. For example, in the AB and FE models the relative influence of cropland value on deforestation increased from the pre-2006 to the post-2006 models, from 0.34 and 0.31 to 0.56 and 0.49, respectively. In the AH model the elasticity of deforestation with respect to land values remained stable at 0.45. These results broadly suggest that while the expansion of cropland had an important role in indirectly driving deforestation in Amazonia pre-2006, the indirect impact of cropland expansion on deforestation has since declined. Cropland appreciation in agricultural districts, however, may continue to drive regional losses in forest cover.
Table 4.
Indirect effect elasticities alternative measures.
| Model type Indirect effect | AB |
FE |
AH |
|||
|---|---|---|---|---|---|---|
| Crop area | Land price | Crop area | Land price | Crop area | Land price | |
| 2002-2011 | 0.19* | 0.21** | 0.44** | 0.40** | 0.43** | 0.40** |
| 2002-2006 | 0.42** | 0.34** | 0.47** | 0.31** | 0.63** | 0.45** |
| 2007-2011 | –0.06 | 0.56** | 0.07 | 0.49** | 0.06 | 0.45** |
p < 0.05.
p < 0.01.
4.5. Statistical projections
To estimate the actual amount of deforestation attributable to the indirect effect, we predicted forest loss based on the coefficients estimated from the pre and post-2006 FE models through a set of counterfactual scenarios. We used the FE results for this exercise, in order to adjust our county level estimates according to individual group effects. For each scenario we adjusted soybean area in each agricultural county accordingly, recalculated I for each agricultural county and then re-weighted the simulated influence through our weights matrix to re-estimate WIE. We then predicted total deforestation levels through a set of dynamic simulations, meaning that we predicted deforestation for each year and county, , as a function, in part, of the predicted deforestation in the earlier time period, e.g., .
Our scenarios were designed to reveal a “globalization effect” on Amazonian land change, as well as forest loss attributable to alternative regionalizations within Brazil. We thus estimated deforestation under several scenarios of reduced agricultural activity. For our first scenario, which focuses explicitly on the impact of agricultural exports, we estimated agricultural areas under a scenario where no new agricultural exports were permitted after 2002. For our second scenario we held agricultural areas in our set of agricultural counties constant to 2002 levels, effectively erasing much of the gains in cropland area made in the early 2000s and estimating the extent to which deforestation in Amazonia was linked indirectly to the expanding soybean sector; finally, for a third scenario we estimated the impact of agricultural expansion in Brazil's southern states exclusively (Rio Grande do Sul, Santa Catarina, and Paraná).
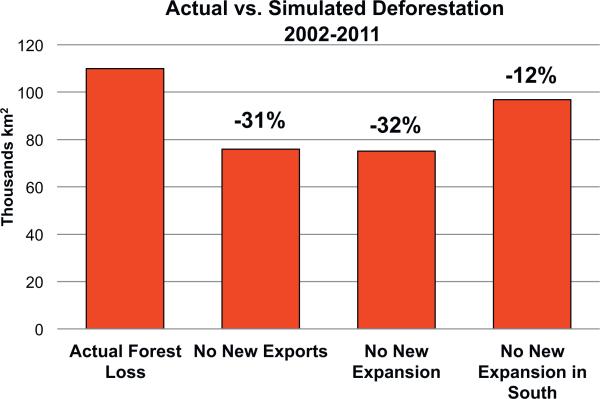
Our first scenario, namely the impact of increased exports on the Amazon forest (the globalization effect), reduces soybean production by the areas needed to fulfill export increases over 2002 levels. To accomplish this, we first estimated the area needed to meet the new demand for soybean exports. In 2002, we estimated total export weight as approximately thirty million tons. This increased to thirty-nine million in 2005, and forty-two million in 2009, before declining slightly to forty-one million tons in 2010. After accounting for yield changes over the time period we calculated the total area needed to produce the added export tons, and then subsequently reduced soybean area by the area we estimated as needed to meet the increased export quantity. This resulted in annual area adjustments ranging from negative eleven and negative ten percent in 2003–2004 to negative twenty-two percent in 2009, or an average area reduction of sixteen percent. For our simulations, we then reduced annual soybean areas for each county by the percent of area needed to fulfill Brazil's increased soybean exports. This scenario predicted a deforestation total of 75,000 km2 , which is approximately a thirty-one percent reduction from actual levels of forest loss in the set of deforestation counties, or 34,000 km2 less than the 110,000 km of forest lost here between 2002 and 2011 (see Fig. 9). Taken against the actual levels of deforestation over the time period, we thus suggest that agricultural expansion derived from increased exports after 2002 has led, indirectly, to nearly one-third of deforestation in Amazonia over the past decade.
Fig. 9.
Percent of total Amazon deforestation due to ILUC under three simulated scenarios.
To ascertain the indirect effects attributable to agricultural regions within Brazil, we analyzed two additional scenarios. First, we held soybean areas constant to 2002 levels across all Brazilian soybean producing regions, and second, we held areas to 2002 levels in the southern states only. In each case we held soybean areas constant for each county, but allowed land values to increase. In the first of these scenarios our simulation yielded an estimated total forest savings of 35,000 km2 , which amounts to thirty-two percent of total forest loss in our deforestation counties. Finally, we then compared these estimates to the indirect effect from the South region. Here, we estimated that new soybean expansion in the South alone resulted in approximately 13,000 km2 of forest loss, or about twelve percent of total deforestation in our impact counties. Consequently, we argue that not only has new soybean production led, indirectly, to approximately one-third of the forest loss that occurred in the Brazilian Amazon between 2002 and 2011, but that agricultural expansions in southern Brazil may be responsible for as much as one third of this indirect deforestation.
5. Discussion and conclusion
We argue that land appreciation constitutes a key mechanism by which high returns to soybean production will ultimately translate into regional scale forest loss in the Amazon. This argument is broadly congruent with past work tying forest loss to land appreciation and speculation (Ozorio de Almeida and Campari, 1995; Bowman et al., 2012). However, we build on this work by tying land appreciation and deforestation in Brazil's frontier regions to agricultural expansion and cropland prices elsewhere across Brazil. Consequently, here we argue that land use change in Brazil is tied not only to the ability of one sector to influence real returns to production, or even to the displacement of human and financial capital, but rather to a sector's ability to affect the speculative demand for rural land (whether for production or as an investment asset).
In our statistical models we have shown that the impact of the soybean sector on deforestation continues to loom large. Specifically, we estimated that approximately one-third of deforestation in Brazil's Amazon region can be linked, indirectly, to the expansion and valuation of the agricultural sector elsewhere in the nation, including the distant but agriculturally rich regions of the nation's southern states. However, in our models we also estimated that the impact of the agricultural sector, and in particular the impact of the expansion of soybean production on deforestation, has declined since 2006. This latter finding subscribes broadly to the argument that the once hyperbolic goal of ending deforestation in the Amazon, or at least net forest loss, may increasingly be in reach (Nepstad et al., 2009).
Certainly, the trend of declining rates of forest loss supports such a possibility, and a growing body of research now recognizes the positive results of recent policy changes in Brazil, and the broader success of Brazil's efforts to combat deforestation (Assunção et al., 2012; Arima et al., 2014). However, our results should also give pause to the assertion that agriculture has been decoupled from deforestation, or that the indirect effect is dead. In fact, our estimation of cropland change still suggests that cropland appreciation will continue to drive land cover change in the Amazon frontier regions. For even as displacement incentives for ranchers or farmers may be diminished by new policies that limit the clearing or opening of new farmlands, rising land values are increasing the financial rewards for those who succeed in opening their lands, legally or otherwise. As increasingly scarce croplands and pastures in Brazil's frontier regions appreciate in value, owners of forest in the Amazon will continue to have an incentive to render their forests into pasture to reap the speculative premium for opened land.
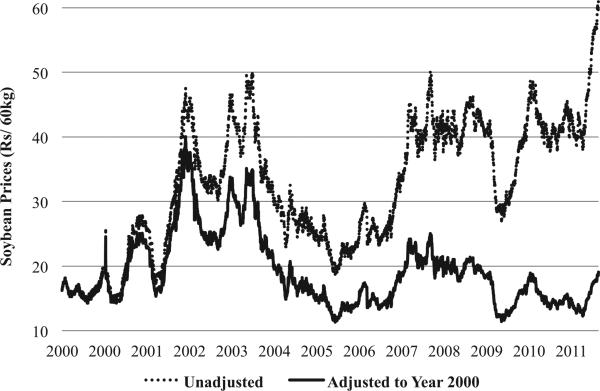
In this regard, we caution that while the recent downturn in forest loss may suggest that recent policy changes have led to a decoupling of the agricultural sector from regional forest loss in the Amazon, other recent research has argued that policies may in fact have a limited role in deterring forest change. Gasparri et al. (2013), for example, argue that agricultural expansion in both Brazil and Argentina has been closely correlated with macroeconomic shocks (Gasparri et al., 2013), and that, over the long term, the land use system will continue to expand, contract, or stabilize with macroeconomic adjustments. Not coincidentally, the economic shock of the devaluation of the real and favorable export policies led to the rapid advancement of the agriculture sector in the early 2000s (Richards et al., 2012). However, Brazil's agricultural sector has not been able to replicate the boom years of ten years ago. Rather, real soybean prices, adjusted for inflation to year 2000 $RS, have stabilized at pre-soybean boom levels (see solid black line in Fig. A1). Combined with new controls on deforestation, the stable returns to soybean production have diminished the incentive to open new lands. In this sense, the low rates of forest loss over the past five years might be interpreted as a signal of the stabilization of Brazil's agricultural sector, and thus a détente to the nation's demand for land. A price shock similar to the post-devaluation agricultural boom of the early 2000s, however, could well act to upset the current land use balance and possibly lead to another spike in deforestation levels. For example, a doubling or tripling of soybean prices, similar to what occurred in the early 2000s could very well trigger a new wave of deforestation, both through direct encroachments for cropland and through indirect land use change as prices rise or as capital is invested across the Amazon's frontier.
Finally, our models also estimated that agricultural change and cropland appreciation, even in southern Brazil, may influence land use decisions in the Amazon. Our work in this regard calls on historic conceptualizations of Brazil's Amazon frontier as a product of the inter-regional redistribution of resources, and of the factors pushing or pulling capital and labor from one region of the country to another (Hecht, 1984; Branford and Glock, 1985; Schmink and Wood, 1992). Yet, at the same time, this work aligns with evidence that the present-day agricultural expansion in the Amazon is a product of a growing global appetite for agricultural commodities (Nepstad et al., 2006; Walker et al., 2009; Lambin and Meyfroidt, 2011; Richards et al., 2012; Garrett et al., 2013b). Consequently, we seek an intermediate position, where we recognize that responsiveness to global market shifts is mediated by internal heterogeneity in infrastructure access, environmental policies, and trade relationships, as well as existing investments in land (Nassar et al., 2011). We extend this position to suggest that the future expansion of agriculture in Brazil will broadly affect not only the immediate vicinity of the nation's core agricultural areas, but also pressure for deforestation in the Amazon frontier. As Brazilian policymakers seek to balance the janus-faced development tracks of economic growth through agriculture and environmental conservation through forest preservation, they must do so with the knowledge that land change is a spatially complex phenomenon, and that pressures to convert the Amazonian forest are linked to events and developments occurring in both the nation's agricultural core and in global markets.
Fig 5.
Agricultural counties.
Acknowledgements
This research was supported by National Science Foundation Award # 1003562, Soy, Cattle, and Amazon Deforestation, the Inter-American Foundation Grass Roots Fellowship, The Mellon Foundation for International Study, and the North American Regional Science Association Ben Stevens Fellowship. We also thank Joseph Messina, Bill McConnell, and Scott Swinton, as well as several anonymous reviewers, for their helpful critiques and insights.
Appendix
See Fig. A1.
Fig. A1.
Nominal and real soybean prices.
Soybean prices spiked to decade highs from 2002–2003, before crashing in late 2004. Real Prices adjusted using Brazil's Consumer Price Indices. Soybean prices are values for Rondonopolis, Mato Grosso (IMEA 2012).
References
- Anderson TW, Hsiao C. Estimation of dynamic models with error components. J. Am. Stat. Assoc. 1981;76:598–606. [Google Scholar]
- Andrade de Sá S, Palmer C, di Falco S. Dynamics of indirect land-use change: empirical evidence from Brazil. J. Environ. Econ. Manage. 2013;65:377–393. [Google Scholar]
- Andrade de Sá S, Palmer C, Engel S. Ethanol production, food and forests. Environ. Resour. Econ. 2012;2012:1–21. [Google Scholar]
- Angelsen A. Forest Cover Change in Space and Time: Combining the von Thünen and Forest Transition Theories World Bank Policy Research Working Paper. 2007 [Google Scholar]
- Arellano M, Bond S. Some tests of specification for panel data: Monte Carlo evidence and an application to employment equations. Rev. Econ. Stud. 1991;58:277–297. [Google Scholar]
- Arima E, Richards PD, Walker R, Caldas M. Statistical confirmation of indirect land use change in the Amazon. Environ. Res. Lett. 2011;6 [Google Scholar]
- Arima EY, Barreto P, Araújo E, Soares-Filho B. Public policies can reduce tropical deforestation: lessons and challenges from Brazil. Land Use Policy. 2014;41:465–473. [Google Scholar]
- Assunçäo J, Gandour C, Rocha R. Deforestation Slowdown in the Legal Amazon: Prices or Policies.. Climate Policy Initiative (CPI) Working PaperPontífica Universidade Católica (PUC); Rio de Janeiro, RJ, Brazil. 2012. p. 3. [Google Scholar]
- Barona E, Ramankutty N, Hyman G, Coomes OT. The role of pasture and soybean in deforestation of the Brazilian Amazon. Environ. Res. Lett. 2010;5:024002. [Google Scholar]
- Bowman MS, Soares-Filho BS, Merry FD, Nepstad DC, Rodrigues H, Almeida OT. Persistence of cattle ranching in the Brazilian Amazon: a spatial analysis of the rationale for beef production. Land Use Policy. 2012;29:558–568. [Google Scholar]
- Branford S, Glock O. The Last Frontier: Fighting Over Land in the Amazon. Zed, London. 1985 [Google Scholar]
- Cohn AS, Mosnier A, Havlík P, Valin H, Herrero M, Schmid E, O'Hare M, Obersteiner M. Cattle ranching intensification in Brazil can reduce global greenhouse gas emissions by sparing land from deforestation. Proc. Natl. Acad. Sci. 2014;111:7236–7241. 201307163. doi: 10.1073/pnas.1307163111. [DOI] [PMC free article] [PubMed] [Google Scholar]
- Fargione J, Hill J, Tilman D, Polasky S, Hawthorne P. Land clearing and the biofuel carbon debt. Science. 2008;319:1235–1238. doi: 10.1126/science.1152747. [DOI] [PubMed] [Google Scholar]
- FNP . Informa Economics FNP. Säo Paulo: 2002–2011. Agrianual – Anuário da Agricultura Brasileira (editions 2002–2012). [Google Scholar]
- Garrett RD, Lambin EF, Naylor RL. The new economic geography of land use change: supply chain configurations and land use in the Brazilian Amazon. Land Use Policy. 2013a;34:265–275. [Google Scholar]
- Garrett RD, Rueda X, Lambin EF. Globalization's unexpected impact on soybean production in South America: linkages between preferences for non-genetically modified crops, eco-certifications, and land use. Environ. Res. Lett. 2013b;8:044055. [Google Scholar]
- Gasparri N, Grau H, Gutiérrez Angonese J. Linkages between soybean and neotropical deforestation: coupling and transient decoupling dynamics in a multi-decadal analysis. Glob. Environ. Change. 2013;23:1605–1614. [Google Scholar]
- Gasparri NI, Polain de Waroux Y. The coupling of South American soybean and cattle production frontiers: new challenges for conservation policy and land change science. Conserv. Lett. 2014;23(6):1605–1614. [Google Scholar]
- Hecht S. Cattle ranching in Amazoina: political and ecological considerations. In: Schmink M, Wood CH, editors. Frontier expansion in Amazonia. University of Florida Press, Center for Latin American Studies; 1984. [Google Scholar]
- Hertel TW, Golub AA, Jones AD, O’Hare M, Plevin RJ, Kammen DM. Effects of US maize ethanol on global land use and greenhouse gas emissions: estimating market-mediated responses. Bioscience. 2010a;60:223–231. [Google Scholar]
- Hertel TW, Tyner WE, Birur DK. The global impacts of biofuel mandates. Energy J. 2010b:75–100. [Google Scholar]
- IBGE . Produçäo Pecuária Municipal. (Municipal Cattle Production 1990–2010) Instituto Brasileiro de Geografia e Estatística[[nl]]Brazilian Institute of Geography and Statistics; Säo Paulo: 2011. [Google Scholar]
- IBGE . Produçäo Agicola Municipal. (Municipal Agricultural Production 1990–2011) Instituto Brasileiro de Geografia e Estatística[[nl]]Brazilian Institute of Geography and Statistics; Säo Paulo: 2012. [Google Scholar]
- INPE . (Monitoring Deforestation in the Brazilian Amazon by Satellite Project) National Institute of Space Research; 2013. PRODES –Projeto de Monitoramento do Desmatamento na Amazônia Brasileira por Satélite. [Google Scholar]
- Jepson W. Private agricultural colonization on a Brazilian frontier, 1970–1980. J. Hist. Geogr. 2006;32:839–863. [Google Scholar]
- Keeney R, Hertel TW. The indirect land use impacts of United States biofuel policies: the importance of acreage, yield, and bilateral trade responses. Am. J. Agric. Econ. 2009;91:895–909. [Google Scholar]
- Lambin EF, Meyfroidt P. Global land use change, economic globalization, and the looming land scarcity. Proc. Natl. Acad. Sci. 2011;108:3465–3472. doi: 10.1073/pnas.1100480108. [DOI] [PMC free article] [PubMed] [Google Scholar]
- Lapola DM, Schaldacha R, Alcamoa J, Bondeaud A, Kocha J, Koelkinga C, Priesse JA. Indirect land-use changes can overcome carbon savings from biofuels in Brazil. Proc. Natl. Acad. Sci. U. S. A. 2010;107:3388–3393. doi: 10.1073/pnas.0907318107. [DOI] [PMC free article] [PubMed] [Google Scholar]
- Margolis ML. The Moving Frontier: Social and Economic Change in a Southern Brazilian Community. University of Florida; Gainesville: 1973. [Google Scholar]
- Meyfroidt P, Carlson KM, Fagan ME, Gutiérrez-Vélez VH, Macedo MN, Curran LM, DeFries RS, Dyer GA, Gibbs HK, Lambin EF. Multiple pathways of commodity crop expansion in tropical forest landscapes. Environ. Res. Lett. 2014;9:074012. [Google Scholar]
- Meyfroidt P, Rudel TK, Lambin EF. Forest transitions, trade, and the global displacement of land use. Proc. Natl. Acad. Sci. 2010;107:20917–20922. doi: 10.1073/pnas.1014773107. [DOI] [PMC free article] [PubMed] [Google Scholar]
- Morton DC, DeFries R, Shimabukuro YE, Anderson LO, Aral E, del Bon Espirito-Santo F, Freitas R, Morisette J. Cropland expansion changes deforestation dynamics in the southern Brazilian Amazon. Proc. Natl. Acad. Sci. U. S. A. 2006;103:14637–14641. doi: 10.1073/pnas.0606377103. [DOI] [PMC free article] [PubMed] [Google Scholar]
- Nassar AM, Harfuch L, Bachion LC, Moreira MR. Biofuels and land-use changes: searching for the top model. Interface Focus. 2011;1:224–232. doi: 10.1098/rsfs.2010.0043. [DOI] [PMC free article] [PubMed] [Google Scholar]
- Nepstad D, Soares-Filho BS, Merry F, Lima A, Moutinho P, Carter J, Bowman M, Cattaneo A, Rodrigues H, Schwartzman S, McGrath DG, Stickler CM, Lubowski R, Piris-Cabezas P, Rivero S, Alencar A, Almeida O, Stella O. The end of deforestation in the Brazilian Amazon. Science. 2009;326:1350–1351. doi: 10.1126/science.1182108. [DOI] [PubMed] [Google Scholar]
- Nepstad D, Stickler CM, Almeida O. Globalization of the Amazon soy and beef industries: opportunities for conservation. Conserv. Biol. 2006;20:1595–1603. doi: 10.1111/j.1523-1739.2006.00510.x. [DOI] [PubMed] [Google Scholar]
- Nickell S. Biases in dynamic models with fixed effects. Econ.: J. Econ. Soc. 1981;49:1417–1426. [Google Scholar]
- Ozorio de Almeida AL, Campari JS. Sustainable Settlement in the Brazilian Amazon. Oxford University Press; New York: 1995. [Google Scholar]
- Richards P. Indirect Land Use Change and the Future of the Amazon Forest, Geography. Michigan State, East Lansing. 2012a [Google Scholar]
- Richards PD. Food, fuel, and the hidden margins of capital. J. Land Use Sci. 2012b;7:289–310. [Google Scholar]
- Richards PD, Myers RJ, Swinton SM, Walker RT. Exchange rates, soybean supply response, and deforestation in South America. Glob. Environ. Change. 2012;22:454–462. [Google Scholar]
- Robalino JA, Pfaff A. Contagious development: neighbor interactions in deforestation. J. Dev. Econ. 2012;97:427–436. [Google Scholar]
- Schmink M, Wood CH. Contested Frontiers in Amazonia. Columbia University Press; New York: 1992. [Google Scholar]
- Searchinger T, Heimlich R, Houghten RA, Dong F, Elobeid A, Fabiosa J, Tokgoz S, Hayes D, Tun-Hsiang Y. Use of U.S. croplands for biofuels increases greenhouse gases through emissions from land-use change. Science. 2008;319:1238–1240. doi: 10.1126/science.1151861. [DOI] [PubMed] [Google Scholar]
- VanWey LK, Spera S, Sa RD, Mahr D, Mustard JF. Socioeconomic development and agricultural intensification in Mato Grosso. Philos. Trans. R. Soc. Lond. Ser. B. 2013;368:20120168. doi: 10.1098/rstb.2012.0168. [DOI] [PMC free article] [PubMed] [Google Scholar]
- Walker R. Urban sprawl and natural areas encroachment: linking land cover change and economic development in the Florida Everglades. Ecol. Econ. 2001;37:357–369. [Google Scholar]
- Walker R. The impact of Brazilian biofuel production on Amazônia. Ann. Assoc. Am. Geogr. 2011;101:929–938. [Google Scholar]
- Walker R. Sparing land for nature in the Brazilian Amazon: implications from location rent theory. Geogr. Anal. 2014;46:18–36. [Google Scholar]
- Walker R, Browder J, Arima E, Simmons C, Pereira R, Caldas M, Shirota R, de Zen S. Ranching and the new global range: Amazônia in the 21st century. Geoforum. 2009;40:732–745. [Google Scholar]
- Walker R, Richards P. The ghost of von Thünen lives: a political ecology of the disappearance of the Amazonian forest. In: Brannstrom C, Vadjunec J, editors. Political Ecology and Land Change Science: Synergies and Differences. Routledge; New York: 2013. [Google Scholar]
- Weinhold D, Killick E, Reis EJ. Soybeans, poverty and inequality in the Brazilian Amazon. World Dev. 2013;52:132–143. [Google Scholar]


