Abstract
Rationale and Objectives
The objectives of this research study were to determine the magic-angle effect on different subregions of in vivo human femoral cartilage through the quantitative assessment of the effect of static magnetic field orientation (B0) on transverse (T2) relaxation time at 3.0 T.
Materials and Methods
Healthy volunteers (n = 5l; mean age, 36.4 years) and clinical patients (n = 5; mean age, 64 years) with early osteoarthritis (OA) were scanned at 3.0-T magnetic resonance using an 8-channel phased-array knee coil (transmit-receive).
Results
The T2 maps revealed significantly greater values in ventral than in dorsal regions. When the cartilage regions were oriented at 55° to B0 (magic angle), the longest T2 values were detected in comparison with the neighboring regions oriented 90° and 180° (0°) to B0. The subregions oriented 180° (0°) to B0 showed the lowest T2 values.
Conclusions
The differences in T2 values of different subregions suggest that magic-angle effect needs to be considered when interpreting cartilage abnormalities in OA patients.
Keywords: Osteoarthritis, T2 mapping, cartilage imaging, magic-angle effect, transverse relaxation time
The primary macromolecules in human cartilage are collagen type II and proteoglycans. Proteoglycan is responsible for much of the compressive stiffness through electrostatic repulsion, whereas collagen provides the tensile and shear strength (1). The earliest biochemical changes in osteoarthritis (OA) are the modifications at the molecular level of cartilage matrix, which occur without obvious morphologic changes. The loss of glycosaminoglycan and the collagen breakdown are the typical characteristics of early OA (2–4).
Human articular cartilage is a highly ordered and depth-dependent ultrastructure and is essentially defined by the organization of the collagen fibrils (5). Collagen fibers in histology have three predominant organizational zones across the depth of the cartilage tissue. In the superficial (tangential) zone, the collagen fabrils are parallel to the cartilage surface, whereas in the radial (deep) zone, the fabrils are oriented perpendicular to the surface. However, in the transitional (middle/intermediate) zone, the arrangement of collagen fibers is almost random. The characteristic arrangement of collagen fibers results in the “magic-angle effect” and exhibits anisotropic properties when measured at different tissue depths and from different physical orientations in the proton magnetic resonance (MR) images (5–7).
T2 mapping is a promising approach for assessing the underlying collagen microstructure in the extracellular matrix of articular cartilage. Damages to the extracellular matrix of articular cartilage and the increase of water content in degenerated cartilage give rise to increases in the T2 relaxation times (8–10).
Previous studies (5–7,11–14) have revealed that the T2 values will be elevated when the articular cartilage surface is placed at approximately 55° with respect to the external static magnetic field B0. The signal changes that occur at angles approximating 54.7° are known as the magic-angle phenomenon because the dipolar interaction between two nuclei scales is 3 cos2 θ − 1, where θ is the angle between the internuclear vectors joining the nuclei and B0. The dipolar interaction that tends to reduce signal intensity will vanish when (3 cos2 θ − 1) = 0, which is satisfied when θ equals 54.7°.
One manifestation of this magic-angle phenomenon is that the T2 decay of cartilage tissue is greatly retarded, and the signal intensity is maximal when the collagen fiber is oriented at this angle in relation to B0 (5,11). Other investigators (7,10,13,15–19) reported that T2 relaxation reflects the ability of free water proton molecules to move and to exchange energy inside the cartilaginous matrix. The T2 variation may be due to the regional differences in cartilage compression. The weight-bearing portion of the femoral–tibial joint is subject to compressive force that may lower the water content of the cartilage.
The aim of this work was to perform a quantitative assessment of the effect of B0 orientation on T2 relaxation times to determine the magic-angle effect on different subregions of in vivo human femoral cartilage at 3.0 T. We measured and compared the global and regional changes of femoral cartilages in T2 relaxation times for healthy controls and OA patients using quantitative T2 relaxation method at 3.0 T.
MATERIALS AND METHODS
Human Subjects
Five healthy volunteers (n = 4 men and n = 1 woman, ranging in age from 24 to 45 years, with an average age of 35.6 years) and five patients (n = 3 men and n = 2 women, ranging in age from 53 to 82 years, with an average age of 65 years) with clinically documented early knee OA by radiography (Kellgren–Lawrence [K–L] grading scale 1 and 2) (20) were recruited. All healthy volunteers and OA patients were scanned for T2 mapping. To limit the patient motion between acquisitions, the knee was fixed with foam padding, which is very important because the subject’s positioning is extremely critical for subsequent orientation studies of regional cartilage T2 values. All the human subjects provided informed consent to participate in the research, which was approved by our institutional review board.
Imaging Hardware
All MRI experiments were performed on a 3.0-T clinical MR scanner (MAGNETOM Tim Trio; Siemens Medical Solutions, Erlangen, Germany). An 18-cm diameter, 8-channel, transmit–receive, phased-array (PA) knee coil was used for all the imaging measurements.
Imaging Protocol
The protocol included the following sequence: 2D sagittal T2-weighted spin-echo (SE) imaging with the following imaging parameters: time of repetition (TR)/time of echo (TE) = 4000/16.5, 33, 49.5, 66, 82.5 milliseconds; field of view = 15 cm; matrix = 256 × 256; bandwidth = 130 Hz; slice thickness = 1.5 mm.
MR Images Analysis and Processing
All the MR images were analyzed based on global and regional compartments. Three subregions (55°, 90°, and 180° [0°] with respect to B0) were defined in the femoral cartilages of each subject. The in-house developed routines in MATLAB (version 7.1; The MathWorks, Natick, MA) and C++ were used for offline processing of the acquired MR images.
T2-weighted images with the shortest TE (16.5 milliseconds) were used for the segmentation of femoral cartilages. Regions of interest (ROIs) were segmented manually for each slice for all the subjects. These segmentations were used to draw ROIs for each MR image with different TE values. T2 maps were computed with custom-built MATLAB routines using the corresponding expression (10,12,13,15).
The intersubject variability of the T2 maps was quantified using root mean square coefficients of variation percentage (RMS-CV%), and the Student t test was used to determine whether there were any statistically significant differences in the T2 values among the local/global regions of femoral cartilages for asymptomatic and OA subjects.
RESULTS
Figure 1a displays the three subregions oriented 55°, 90°, and 180° (0°) related to the external static magnetic field B0 in the ventral and dorsal regions with the corresponding magnified details showing the highly organized collagen structure of the human cartilage, respectively. Figure 1b is the plot showing the (3 cos2 θ − 1) factor as a function of angle with respect to B0 for nuclear dipolar interaction. In the two positions with two arrows identifying the discrete sampling points where (3 cos2 θ − 1) = 0, the θ equals approximately 55° and 125°, respectively, and the magic-angle effect may emerge in these two sampling positions. Other arrows show the sampling points where the (3 cos2 θ − 1) factor has the maximal and minimal values, respectively.
Figure 1.
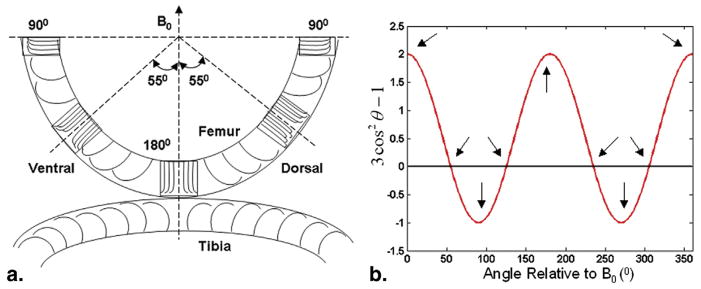
(a) The schematic diagram of the arrangement of collagen fibers across different layers of human cartilage. Three magnified details of the local regions of human femoral cartilage display the corresponding subregions oriented 90°, 55° (magic angle), and 180° with respect to the external static magnetic field B0, respectively. (b) The plot showing the (3 cos2θ−1) factor as a function of angle with respect to B0 for nuclear dipolar interaction. Two arrows identify the discrete sampling points where (3 cos2θ−1), the θ equals approximately 55° and 125°, respectively, and the magic-angle effect may emerge in these two sampling positions. Other arrows show the sampling positions where the (3 cos2θ−1) factor has the maximal and minimal values, respectively.
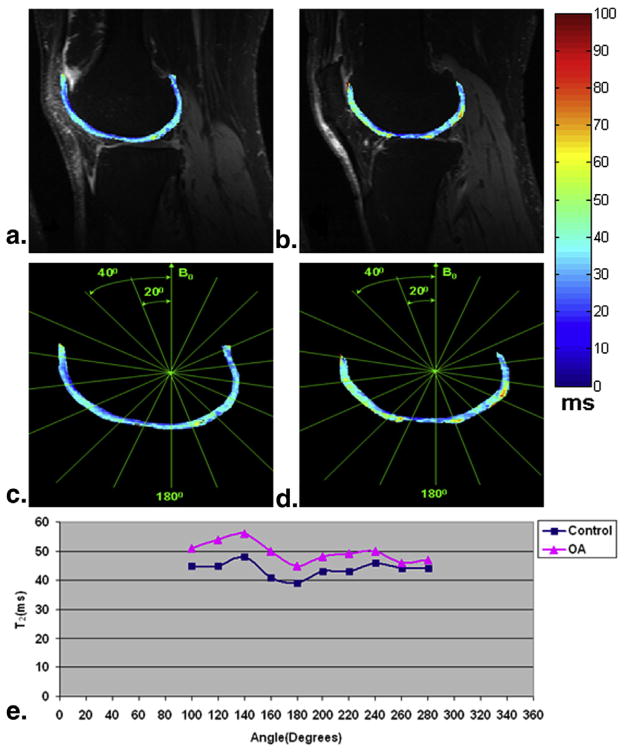
Two representative T2 (top row) slices obtained from an OA patient overlaid onto the shortest TE (16.5 milliseconds) were displayed in Figure 2a and b, respectively. Figure 2c and d correspondingly showed a series of subregions on the femoral cartilage segmented at every 20° with respect to B0. Figure 2e is the T2 profiles of the corresponding subregions segmented in Figure 2c or d. As shown in Figure 2e, the T2 values of OA generally were greater than those of healthy controls. In the sections oriented 55° relative to B0 (magic angle, 120°–140° and 240°–260° as shown in Fig 2c or d), the longest T2 values were detected in comparison with the neighboring sections oriented 90° (100° and 280° as shown in Fig 2c or d) and 180° with respect to B0. The subregions oriented 180° relative to B0 showed the lowest T2 values. Furthermore, the T2 values displayed obviously greater values in the ventral than in the dorsal regions.
Figure 2.
Two representative T2 (top row) slices obtained from an osteoarthritis (OA) patient were displayed (a and b). A series of subregions on the femoral cartilage segmented at every 20° with respect to B0 (c and d). The T2 profiles (e) of the corresponding subregions segmented in c and d.
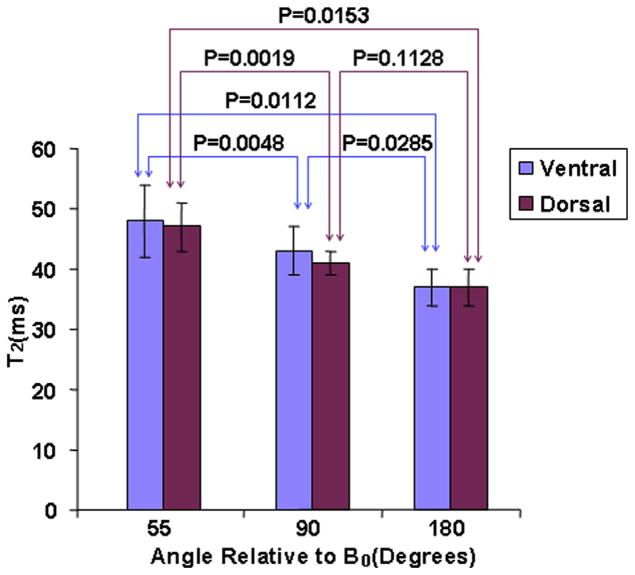
Figure 3 displayed the bar charts of the average ventral and dorsal T2 values in the subregions oriented 55°, 90°, and 180° relative to B0 for healthy controls, respectively. The T2 values showed obviously greater values in the ventral than in the dorsal regions. The subregions oriented 55°, 90°, and 180° with respect to B0 showed the greatest, the intermediate, and the lowest T2 values for ventral and dorsal regions, respectively (for ventral: 48 ± 6 milliseconds [mean ± standard deviation] vs. 43 ± 4 milliseconds vs. 37 ± 3 milliseconds; for dorsal: 47 ± 4 milliseconds vs. 41 ± 2 milliseconds vs. 37 ± 3 milliseconds). The P values of subregions oriented 55° versus 90°, 90° versus 180°, and 55° versus 180° relative to B0 for ventral were .0048, .0285, and .0112, respectively, whereas the P values of subregions oriented 55° versus 90°, 90° versus 180°, and 55° versus 180° relative to B0 for dorsal were .0019, .1128, and .0153, respectively. The root mean square coefficients of variation percentage (RMS-CV%) were 11.96, 10.25, and 7.22 for ventral subregions oriented 55°, 90°, and 180° relative to B0 among healthy subjects, respectively. The RMS-CV% were 8.33, 5.46, and 7.22 for dorsal subregions oriented 55°, 90°, and 180° relative to B0 across healthy subjects, respectively.
Figure 3.
The bar charts of the average ventral and dorsal T2 values in subregions oriented 55°, 90°, and 180° relative to B0 for healthy controls, respectively.
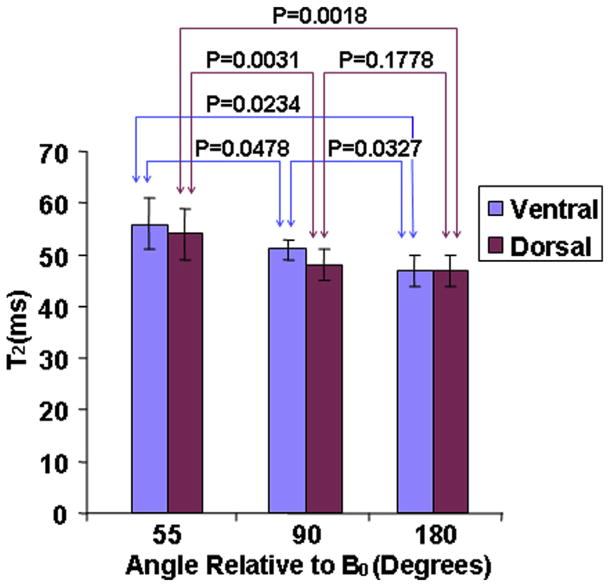
Figure 4 was the bar charts of the average ventral and dorsal T2 values in subregions oriented 55°, 90°, and 180° relative to B0 for OA subjects, respectively. Similarly, the T2 values were obviously greater in the ventral than in the dorsal regions. The subregions oriented 55°, 90°, and 180° with respect to B0 showed the greatest, the intermediate, and the lowest T2 values for ventral and dorsal regions (for ventral: 56 ± 5 milliseconds vs. 51 ± 2 milliseconds vs. 47 ± 3 milliseconds; for dorsal: 54 ± 5 milliseconds vs. 48 ± 3 milliseconds vs. 47 ± 3 milliseconds). The P values of subregions oriented 55° versus 90°, 90° versus 180°, and 55° versus 180° with respect to B0 for ventral were .0478, .0327, and .0234, respectively. And, the P values of subregions oriented 55° versus 90°, 90° versus 180°, and 55° versus 180° relative to B0 for dorsal were .0031, .1778, and .0018, respectively. The RMS-CV% were 9.7, 4.26, and 5.92 for ventral subregions oriented 55°, 90°, and 180° relative to B0 in OA subjects, respectively. The RMS-CV% were 8.46, 7.06, and 5.92 for dorsal subregions oriented 55°, 90°, and 180° relative to B0 in OA subjects, respectively.
Figure 4.
The bar charts of the average ventral and dorsal T2 values in subregions oriented 55°, 90°, and 180° relative to B0 for osteoarthritis subjects, respectively.
Figure 5 displayed the combined bar charts of the average ventral and dorsal T2 values in subregions oriented 55°, 90°, and 180° relative to B0 for healthy and OA subjects, respectively. Generally, the T2 values were obviously greater in OA subjects than in healthy controls except that the T2 values were obviously greater in the ventral than in the dorsal regions. The subregions oriented 55°, 90°, and 180° with respect to B0 showed the greatest, the intermediate, and the lowest T2 values for ventral and dorsal regions. All these T2 variation trends were consistent with those shown in Figure 2e. In subregion oriented 55° relative to B0, the P values of control versus OA subjects for ventral and dorsal were .0217 and .0011, respectively. In subregion oriented 90° relative to B0, the P values of control versus OA subjects for ventral and dorsal were .0019 and .003, respectively. Similarly, in subregion oriented 180° relative to B0, the P values of control versus OA subjects for ventral and dorsal were .0039 and .0039, respectively.
Figure 5.
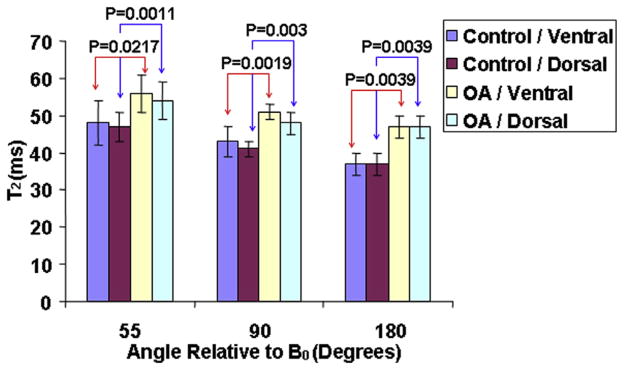
The combined bar charts of the average ventral and dorsal T2 values in subregions oriented 55°, 90°, and 180° relative to B0 for healthy and osteoarthritis (OA) subjects, respectively.
DISCUSSION
In this work, we compared the effect of static magnetic field orientation on the global and local T2 relaxation time of in vivo human femoral cartilage to determine the magic-angle effect on different subregions of in vivo human femoral cartilage at 3.0 T.
It is generally accepted that the free water is responsible for the elevation of T2 values in cartilage (8,10). OA is related to the damage to or the loss of the collagen component of the cartilage matrix, which results in the decrease of the cartilage tensile strength (18). T2 relaxation time mapping is one of the more promising methods for evaluating the underlying collagen structure in the extracellular matrix of articular cartilage. T2 mapping studies of articular cartilage have demonstrated a strong relationship between water T2 in cartilage and the underlying collagen structure (10,12). It is likely that early degenerative change in the cartilage matrix will alter the mobility, and thus, the T2 of cartilage water (7). As shown in Figure 2e, our T2 relaxation time measurements in both ventral and dorsal regions of human cartilage for OA subjects were generally greater than those for the healthy controls, which is in agreement with prior work (7–10).
The angular anisotropy of T2 in human cartilage implies that T2 is strongly influenced by the structure of the collagen extracellular matrix. As shown in Figure 1a, the highly organized structure in cartilage collagen is capable of restricting the motion of water molecules such that the spin–spin coupling becomes to some degree orientation dependent. On the other hand, because human femoral cartilage has a higher curvature than tibial or patella cartilage, the angle between its collagen fibers and the external static magnetic field orientation throughout the femoral cartilage tissue attains a wide range of values (14).
Our results further validated this magic-angle effect of maximal T2 values at approximately 55° with respect to B0 orientation. As shown in Figure 1b, Figure 2e, Figure 3, and Figure 4, the T2 values of subregions oriented approximately 55° relative to B0 orientation were obviously greater than the neighboring subregions oriented approximately 90° and 180° relative to B0 orientation for healthy and OA subjects with the minimal increase of about 4.5% in T2 values across all the sampling subregions along the femoral cartilage. The femoral/tibial joint is a weight-bearing joint and is subject to different biomechanical stresses than patella cartilage (13). Generally, the femoral and tibial cartilages bear more weight than patella cartilage. This is another reason that we chose human femoral cartilage of healthy and OA subjects for T2 quantitative assessment except that the femoral cartilage has a higher degree of flexion, which is more sensitive to the magic-angle effect.
The overall T2 values in ventral femoral cartilage are greater than those in dorsal femoral cartilage for healthy and OA subjects, which corresponds to the weight-bearing and non–weight-bearing femoral cartilage regions (Fig 2e, Fig 3, and Fig 4). This is most likely due to the known exudation of water from cartilage under compression. Because T2 relaxation time varies linearly with water content, cartilage under biomechanical load should show lower values (7). On the other hand, the magic-angle effect seems to show the same trend along the measured subregions of human femoral cartilage with the maximal increase of ~17% in ventral region and ~14% in dorsal region of T2 values between OA and healthy subjects (Fig 2e). The positions of the maximal increase in T2 values between OA and healthy subjects in both ventral and dorsal regions are all close to the magic angle (120°–140° and 240°–260°). Therefore, it is hypothesized that the magic-angle effect may need to be considered in the interpretation of T2 data.
As was shown in Fig 2e, the average T2 values were 48 and 39 milliseconds near the subregions oriented 55° and 180° relative to B0 orientation in ventral regions for healthy controls, respectively. However, the average T2 values were 56 and 45 milliseconds near the subregions oriented 55° and 180° relative to B0 orientation in ventral regions for OA subjects, respectively. The percentage increase in T2 values for the subregions oriented 55° and 180° relative to B0 orientation in ventral regions between healthy controls and OA subjects were ~17% and ~15%, respectively. On the other hand, the percentage increase in T2 values between the subregions oriented 55° and 180° relative to B0 orientation in ventral regions for healthy controls was ~23%, whereas the percentage increase in T2 values between the subregions oriented 55° and 180° relative to B0 orientation in ventral regions for OA subjects was ~24%. It seems that the magic-angle effect is relatively more obvious based on the percentage change between the subregions oriented 55° and 180° relative to B0 orientation in ventral regions for OA subjects.
As were shown in Figure 3, Figure 4, and Figure 5, there exists significant difference in T2 values between subregions oriented 55° relative to B0 and those of the neighboring subregions oriented 90° and 180° relative to B0 in ventral and dorsal femoral cartilages for healthy and OA subjects (P < .05). Although the longest T2 values were detected in sections oriented 55° to B0 (magic angle) in comparison with the neighboring sections oriented 90° and 180° to B0, the subregions oriented 90° to B0 showed the intermediate T2 values, and the subregions oriented 180° to B0 showed the lowest T2 values, there is no significant difference in T2 values between subregions oriented 90° relative to B0 and those of subregions oriented 180° relative to B0 in ventral and dorsal femoral cartilages for healthy and OA subjects (for healthy controls: ventral, P = .0285; dorsal, P = .1128, as shown in Fig 3; for OA subjects: ventral, P = .0327; dorsal, P = .1778, as shown in Fig 4). This may be because of the relatively lower insensitivity of magic-angle effect on subregions oriented 90° and 180° relative to B0 in comparison with the sections oriented 55° to B0 and the more biologic load in subregions oriented 180° than subregions oriented 90° with respect to B0 may lead to the lowest T2 values for the former which may exude more water from the cartilage collagen matrix and thus give rise to the decrease of T2 values (2,7–10).
The T2 relaxation time is sensitive to slow molecular motions of water protons and anisotropy of the human cartilage and has been shown to demonstrate modifications in anatomically intact tissue in vivo (10). The inherent T2 relaxation time of cartilage is derived from the interactions of cartilage water with the cartilage macromolecules (predominantly from collagen integrity), which are modulated by their chemical and structural states.
Previous in vitro studies (5,6) have reported that T2 relaxation time variations showed the obvious orientation dependence on the static magnetic field. The present preliminary study is the first to ever report that a quantitative assessment of the effect of static magnetic field orientation on T2 relaxation time was performed to determine the magic-angle effect on different subregions of in vivo human femoral cartilage at 3.0 T for healthy and OA subjects. Although it was unlikely that the magic-angle effect for T2 map accounted for regional differences in cartilage signal intensity in the case of the small orientation effect (12) and the angular dependence on the external B0 magnetic field for T2 values has made it difficult in acquiring a correct appearance of T2 maps, previous in vivo (10) and our own results showed obvious increase in T2 values in OA patients when compared to the healthy subjects (P < .5, Fig 5); therefore, it is of great significance to measure and compare the T2 mapping of different subregions of human cartilage because of the magic-angle effect, which may provide a consistent information for the in vivo evaluation of cartilage physiology and pathology. Although previous studies (5,6,10) have shown the T2 dependence of oriented water in the ordered collagen matrix in cartilage, the present work extends these experiments to both in vivo and regional cartilage experiments. The results of this study are likely to impact future research studies on T2 relaxation in cartilage.
There are several limitations to this work. First, we evaluated this phenomenon exclusively at 3 T, extrapolation to 1.5 T, or 7 T should be done with care. Second was the relatively small number of both volunteers and patients studied. Future study may include the investigation of the effect of static magnetic field orientation on T2 relaxation time and the determination of the magic-angle effect on in vivo human tibial and patella cartilages at different field strengths with larger numbers of individuals evaluated.
CONCLUSIONS
The preliminary results indicate that magic-angle effect may play an important role in cartilage T2 mapping and needs to be considered when interpreting the cartilage abnormalities in OA patients.
Acknowledgments
The authors would like to acknowledge the support by research grants RO1 AR053133, RO1 AR056260, and RO1 AR060238 A2 from the National Institute of Arthritis and Musculoskeletal and Skin Diseases, National Institutes of Health, USA. This work was equally supported by the Priority Academic Program Development of Jiangsu Higher Education Institutions, China.
References
- 1.Regatte RR, Akella SV, Borthakur A, et al. Proteoglycan depletion-induced changes in transverse relaxation maps of cartilage: comparison of T2 and T1rho. Acad Radiol. 2002;9(12):1388–1394. doi: 10.1016/s1076-6332(03)80666-9. [DOI] [PubMed] [Google Scholar]
- 2.Menezes NM, Gray ML, Hartke JR, et al. T2 and T1rho MRI in articular cartilage systems. Magn Reson Med. 2004;51:503–509. doi: 10.1002/mrm.10710. [DOI] [PubMed] [Google Scholar]
- 3.Pakin SK, Xu J, Schweitzer ME, et al. Rapid 3D-T1rho mapping of the knee joint at 3. 0T with parallel imaging. Magn Reson Med. 2006;56:563–571. doi: 10.1002/mrm.20982. [DOI] [PubMed] [Google Scholar]
- 4.Borthakur A, Mellon E, Niyogi S, et al. Sodium and T1rho MRI for molecular and diagnostic imaging of articular cartilage. NMR Biomed. 2006;19(7):781–821. doi: 10.1002/nbm.1102. [DOI] [PMC free article] [PubMed] [Google Scholar]
- 5.Xia Y, Moody JB, Alhadlaq H. Orientational dependence of T2 relaxation in articular cartilage: a microscopic MRI (microMRI) study. Magn Reson Med. 2002;48(3):460–469. doi: 10.1002/mrm.10216. [DOI] [PubMed] [Google Scholar]
- 6.Xia Y. Magic-angle effect in magnetic resonance imaging of articular cartilage: a review. Invest Radiol. 2000;35(10):602–621. doi: 10.1097/00004424-200010000-00007. [DOI] [PubMed] [Google Scholar]
- 7.Dardzinski BJ, Mosher TJ, Li S, et al. Spatial variation of T2 in human articular cartilage. Radiology. 1997;205(2):546–550. doi: 10.1148/radiology.205.2.9356643. [DOI] [PubMed] [Google Scholar]
- 8.David-Vaudey E, Ghosh S, Ries M, et al. T2 relaxation time measurements in osteoarthritis. Magn Reson Imaging. 2004;22(5):673–682. doi: 10.1016/j.mri.2004.01.071. [DOI] [PubMed] [Google Scholar]
- 9.Dunn TC, Lu Y, Jin H, et al. T2 relaxation time of cartilage at MR imaging: comparison with severity of knee osteoarthritis. Radiology. 2004;232(2):592–598. doi: 10.1148/radiol.2322030976. [DOI] [PMC free article] [PubMed] [Google Scholar]
- 10.Li X, Benjamin Ma C, Link TM, et al. In vivo T(1rho) and T(2) mapping of articular cartilage in osteoarthritis of the knee using 3 T MRI. Osteoarthritis Cartilage. 2007;15(7):789–797. doi: 10.1016/j.joca.2007.01.011. [DOI] [PMC free article] [PubMed] [Google Scholar]
- 11.Erickson SJ, Prost RW, Timins ME. The “magic angle” effect: background physics and clinical relevance. Radiology. 1993;188(1):23–25. doi: 10.1148/radiology.188.1.7685531. [DOI] [PubMed] [Google Scholar]
- 12.Mosher TJ, Dardzinski BJ. Cartilage MRI T2 relaxation time mapping: overview and applications. Semin Musculoskelet Radiol. 2004;8(4):355–368. doi: 10.1055/s-2004-861764. [DOI] [PubMed] [Google Scholar]
- 13.Smith HE, Mosher TJ, Dardzinski BJ, et al. Spatial variation in cartilage T2 of the knee. J Magn Reson Imaging. 2001;14(1):50–55. doi: 10.1002/jmri.1150. [DOI] [PubMed] [Google Scholar]
- 14.Regatte RR, Schweitzer ME. Ultra-high-field MRI of the musculoskeletal system at 7. 0T. J Magn Reson Imaging. 2007;25(2):262–269. doi: 10.1002/jmri.20814. [DOI] [PubMed] [Google Scholar]
- 15.Mosher TJ, Smith H, Dardzinski BJ, et al. MR imaging and T2 mapping of femoral cartilage: in vivo determination of the magic angle effect. AJR Am J Roentgenol. 2001;177(3):665–669. doi: 10.2214/ajr.177.3.1770665. [DOI] [PubMed] [Google Scholar]
- 16.Nieminen MT, Menezes NM, Williams A, et al. T2 of articular cartilage in the presence of Gd-DTPA2. Magn Reson Med. 2004;51(6):1147–1152. doi: 10.1002/mrm.20083. [DOI] [PubMed] [Google Scholar]
- 17.Goodwin DW, Dunn JF. High-resolution magnetic resonance imaging of articular cartilage: correlation with histology and pathology. Top Magn Reson Imaging. 1998;9(6):337–347. [PubMed] [Google Scholar]
- 18.Kurkijarvi JE, Nissi MJ, Kiviranta I, et al. Delayed gadolinium-enhanced MRI of cartilage (dGEMRIC) and T2 characteristics of human knee articular cartilage: topographical variation and relationships to mechanical properties. Magn Reson Med. 2004;52(1):41–46. doi: 10.1002/mrm.20104. [DOI] [PubMed] [Google Scholar]
- 19.Lammentausta E, Kiviranta P, Nissi MJ, et al. T2 relaxation time and delayed gadolinium-enhanced MRI of cartilage (dGEMRIC) of human patellar cartilage at 1.5 T and 9. 4 T: relationships with tissue mechanical properties. J Orthop Res. 2006;24(3):366–374. doi: 10.1002/jor.20041. [DOI] [PubMed] [Google Scholar]
- 20.Kellgren JH, Lawrence JS. Radiological assessment of osteo-arthrosis. Ann Rheum Dis. 1957;16:494–502. doi: 10.1136/ard.16.4.494. [DOI] [PMC free article] [PubMed] [Google Scholar]


