Abstract
Background:One of the main problems especially in operating room and monitoring devices is measurement of Blood Pressure (BP) by sphygmomanometer cuff.
Objective:In this study we designed a new method to measure BP changes continuously for detecting information between cuff inflation times by using vital signals in monitoring devices. This will be achieved by extraction of the time difference between each cardiac cycle and a relative pulse wave.
Methods:Finger pulse and ECG signals in lead I were recorded by a monitoring device. The output of monitoring device wasinserted in a computer by serial network communication. A software interface (Microsoft Visual C#.NET ) was used to display and process the signals in the computer. Time difference between each cardiac cycle and pulse signal was calculated throughout R wave detection in ECG and peak of pulse signal by the software. The relation between time difference in two waves and BP was determined then the coefficients of equation were obtained in different physical situations. The results of estimating BP were compared with the results of sphygmomanometer method and the error rate was calculated.
Results:In this study, 25 subjects participated among them 15 were male and 10 were female. The results showed that BP was linearly related to time difference. Average of coefficient correlation was 0.9±0.03 for systolic and 0.82±0.04 for diastolic blood pressure. The highest error percentage was calculated 8% for male and 11% for female group. Significant difference was observed between the different physical situation and arm movement changes. The relationship between time difference and age was estimated in a linear relationship with a correlation coefficient of 0.76.
Conclusion: By determining linear relation values with high accuracy, BP can be measured with insignificant error. Therefore it can be suggested as a new method to measure the blood pressure continuously.
Keywords: Blood Pressure monitoring, Electrocardiography, Pulse Oximetry signal
Introduction
Blood pressure (BP) acts as one of the vital signs providing useful information about cardiac output and elasticity of the blood vessel, and physiological variation [1, 2]. Continuous blood pressure monitoring is of great importance in many clinical situations, including emergency and critical care medicine and also during anesthesia. Blood Pressure can be measured as an invasive way through intra-arterial blood pressure (IAP) or as a noninvasive way with a cuff around the upper arm [3, 4]. The invasive method measures blood pressure by inserting a catheter into the blood vessel accurately but it has still the disadvantage of accompanying pain and contamination, as well as the side effects arising from inserting the catheter-tip. However, IAP is considered the clinical “gold standard”, in clinical practice. Blood pressure is frequently measured using the noninvasive blood pressure (NIBP) technique[3]. This provides only intermittent measurements which may also be less reliable. Several studies have suggested that NIBP and IAP may differ significantly [5]. Periodically obtained blood pressure measurement is necessary for first of all observing the cardiovascular state of patients over a predefined period or in elderly and secondly monitoring blood pressure changes during surgery and anesthesia, and as well as for those who are in intensive care. In above cases, the conventional noninvasive BP measurement technique is not suitable for obtaining continuous blood pressure values due to the periodic cuff inflation and deflation. Frequent occlusion of artery will also induce measurement error. Also cuff-based methods have some disadvantages, which limit their use in certain clinical situations. Since a pause of at least 3–15 min between two BP measurements is necessary to avoid errors in the measurement, a continuous measurement of blood pressure is not possible by cuff [2, 3]. Therefore, short-term changes in BP cannot be detected. Furthermore, the inflation of the cuff may disturb the patient and the consequences of these disturbances are alterations of the BP. So researchers are looking for ways to measure continuous blood pressure without using a cuff. One method is using a pulse sensor with Impedance PlethysmoGraph (IPG) for the detection of blood volume, but it is used less in treatment centers due to the high complexity of this method in the calculation of blood pressure since It is not simple to make the measurement systems and IPG sensors [6, 7]. Another method is based on pulse sensor and using a small finger cuff. This method can determinate the diastolic pressure only. Also its cuff mechanism is similar to other cuff methods. The aim of this study was to design a method in which blood pressure is monitored continuously and without using a cuff. In this study we used the time between two pulse waves propagating on the same cardiac cycle from two separate arterial sites. The time is called Pulse Transit Time (PTT). This will be achieved by extraction of the time difference between each cardiac cycle with a finger pulse wave throughout ECG and Spo2 signals [1, 2]. In this method features of SpO2 and ECG were extracted and processed. Therefore blood pressure can be measured with continuous recording of ECG, pulse signal and extract PTT time features.
Material and Methods
The following equation describes how pulse wave velocity (PWV) relates to arterial dispensability [5].
Where Δp and ΔV are the changes of blood pressure and volume, ρ is the blood density. PWV relation by PTT was shown in equation 2.
L is the distance the pulse travels (roughly equals to the arm length).
By substituting Eq.1 to Eq.2 and re-arranging the equation with Taylor expansions, we obtain the relationship between PWV or PTT and blood pressure (P).
This derived equation suggests that BP is linearly related to PTT and the coefficients A and B could be achieved by curve fitting based on the PTT and BP at different physical situation.
In this paper, PTT was defined as the time between the R wave of ECG and peak of pulse signal. Continuous recording of ECG and SpO2 signals were performed by monitoring device. Finger pulse signal was recorded by using photo pulse sensor on the left index finger and ECG in lead I by Ag-AgCl electrode on the chest. PTT was measured as the time interval from the R wave to the peak of the pulse signal. The output of monitoring device was inserted in a computer by serial network communication. An external personal computer can monitor measured signals in real time. A software interface (Microsoft Visual C#.NET) was used to display, save, process and analyze the signals in the computer. R waves in ECG and peak of pulse signal were obtained in each cardiac cycle by the software. Also PTT was calculated as difference time between two signals. For continuous measurement of blood pressure the constant coefficients were needed in addition to the continuous extraction of PTT. A and B coefficients were calculated for diastolic and systolic blood pressure in different physical situation. To increase the arterial blood pressure, it was used to go up and down stairs. The workload was kept until the sub maximal heart rate was achieved, thereafter 3-7 minute back to normal. PTT, systolic and diastolic blood pressure was measured for each individual in the normal conditions and in different physical activities to approach the coefficients. All reference BP measurements were taken by digital brachial blood pressure device (Citizen, BK202) on the left upper arm. This study was carried out for different people and effect of age on blood pressure was evaluated. After determining the linear coefficients for each individual, blood pressure was measured by cuff method in 20 minutes with 4-minute intervals. The continuous measurement of blood pressure was also done by the present method. Error values were calculated and the results were compared. Moreover the relationship between PTT changes and age were estimated. Best fitting and evaluating result were done by Matlab software ver. 2011a.
Results
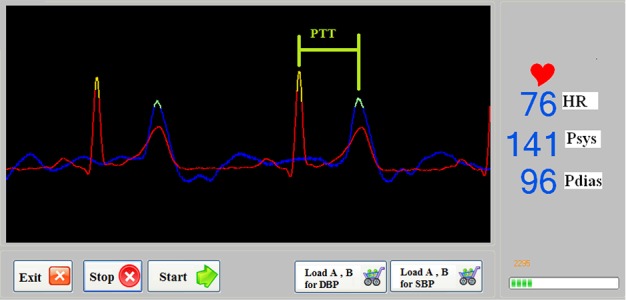
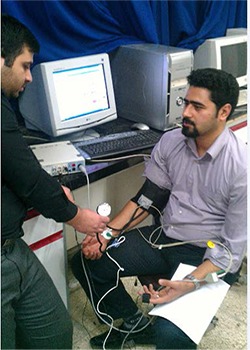
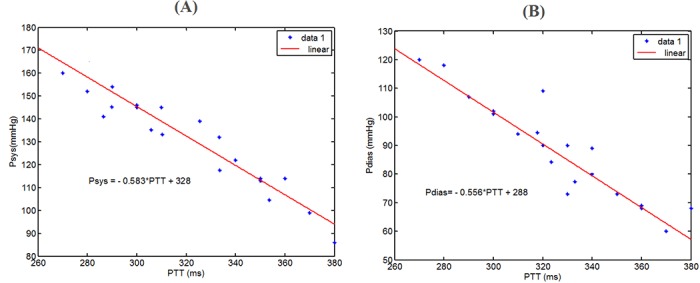
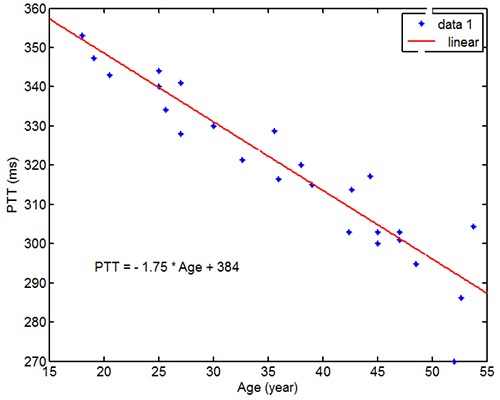
In this study 25 subjects participated ranging from 21 to 53 among them 15 were male and 10 were female. For all the subjects, the mean heart rate 72±8 per min and the average height 1.61±0.07 m. Data collection was done in room at temperature of 26 ±1° C. A view of the software is shown in figure 1. Figure 2 shows the recording blood pressure by present method and cuff method. The appropriate and acceptable linear correlation was determined for constant coefficients A and B in both male and female group. In male group, mean coloration coefficients were 0.92±0.036 for systolic blood pressure and 0.84±0.044 for diastolic blood pressure. Absolute error and error percentage between cuff method and PTT method were 6.16±2.24 mmHg and %4.13±1.83 for systolic BP and 7.39±3.19 mmHg and %6.26±2.74 for diastolic BP. In female group, mean coloration coefficients were 0.86±0.031 for systolic blood pressure and 0.81±0.042 for diastolic blood pressure. Absolute error and error percentage between cuff method and PTT method were 7.29±3.11 mmHg and %4.21±1.68 for systolic BP and 8.86±3.62 mmHg, %7.33±3.76 for diastolic BP. The results showed that error in female group was more than male group and correlation coefficient in male group was better than female group. Also, in both groups systolic blood pressure was measured more accurately than diastolic blood pressure. Figure 3(A) shows the relation between PTT and systolic pressure and figure 3 (B) shows the relation between PTT and diastolic pressure for one sample. The relationship between PTT and BP in both group showed that blood pressure increased while PTT decreased. The A and B were variable as the age increased. A was 0.51±0.44 for systolic BP and 0.54±0.56 for diastolic BP. B was 311.23±45.32 for systolic BP and 263.37±52.22 for diastolic BP. Figure 4 shows variations of pulse transition time according to age. According to figure 4 age and PTT changes were linear, but in people older than 52 years old it doesn’t follow this linear relationship. Significant difference was observed between the different physical situation and arm movement changes. Decrease of blood pressure was observed by changing angel of arm from -90 to +90 as PTT increased.
Figure 1.

Extract of Pulse Transit Time from ECG and Pulse signals by the Microsoft Visual C#.NET software.
Figure 2.

Recording blood pressure by present method and cuff method
Figure 3.

(A) Relation of the systolic blood pressure and pulse transit time, (B) Relation of the diastolic blood pressure and pulse transit time
Figure 4.

The relation between PTT changes and age for the subjects
Conclusion
This paper presents a new method for obtaining the non invasive and continuous blood pressure by using ECG and SpO2 signals. The results show that maximum error was 8.89 mmHg for male group and 10.68 mmHg for female group so the error in female group was more than male group. The relation between PTT method and measured SBP and DBP by cuff method followed a linear function with suitable correlation coefficients. The lowest range of correlation coefficient was calculated 0.76 for systolic pressure and 0.71 for diastolic pressure so systolic blood pressure could be measured more accurately than diastolic blood pressure. Through the pulse transit time method, the systolic, diastolic, and mean blood pressures can be predicted using the time interval between the ECG and SpO2. The results were comparable with measurements of cuff blood pressure and continuous methods such as IPG and a finger cuff. By determining the correct values of A and B in this method, cuff and its limitations will disappear. In finger cuff blood pressure monitoring, measurement of diastolic blood pressure is very difficult and has a very low degree of accuracy [8]. IPG is a method for estimating the pattern of blood pressure changes continuously and showing blood pressure signals during the time. The accuracy of this method is dependent on the complex calculations [7]. Benefits of PTT are lower cost and non-complexity. The initial calibration is required on each subject because of different physiological parameters, such as the blood density and the stiffness of the arterial wall. However, those parameters can be treated as constant for each personal subject. By doing several measurements, the linear regression line is established. Then the blood pressure can be predicted based on the PTT. This method doesn’t require accurate calculation of the coefficients in critical situation. In this case, approximate values which are usually varies according to age range in different people were considered for measuring blood pressure changes. The most important application of this system is in operating rooms during high-risk condition and general anesthesia. In other cases, we cannot take blood pressure measurements in different physical conditions to determine the coefficients of the linear relationship. During a period of time, blood pressure reference can be calculated based on PTT reference at the beginning. Approximate coefficients are considered for linear correlation through age range. Changes in blood pressure are measured continuously by calculating the PTT in other parts of the signal and its difference with PTT reference. This is applicable by adding software to monitoring device in operating rooms. PTT measurement shouldn’t disrupt daily activities, therefore we can use ECG chest electrodes and ear pulse sensor[9, 10]. Coefficients can be selected after determining the linear correlation coefficients and body position for continuous and cuffless measurement of blood pressure. Therefore we can minimize the error due to unexpected movements[11]. the estimating BP accuracy depends on the initial calibration, so the blood pressure, ECG and pulse measurements should be performed with the standard devices to obtain highly accurate results. So Continuous blood pressure measurement based on present method can be suggested for observing blood pressure changes during surgery and crisis conditions.
Conflict of Interest: None
References
- 1.Chen W, Kobayashi T, Ichikawa S, Takeuchi Y, Togawa T. Continuous estimation of systolic blood pressure using the pulse arrival time and intermittent calibration. Med Biol Eng Comput. 2000;38:569–74. doi: 10.1007/BF02345755. [DOI] [PubMed] [Google Scholar]
- 2.Marie GV, Lo CR, Van Jones, Johnston DW. The relationship between arterial blood pressure and pulse transit time during dynamic and static exercise. Psychophysiology. 1984;21:521–7. doi: 10.1111/j.1469-8986.1984.tb00235.x. PubMed PMID: 6473621. [DOI] [PubMed] [Google Scholar]
- 3.Allen J, Murray A. Age-related changes in peripheral pulse timing characteristics at the ears, fingers and toes. J Human Hypertension. 2002;16:711–7. doi: 10.1038/sj.jhh.1001478. doi: 10.1038/sj.jhh.1001478. PubMed PMID: 12420195. [DOI] [PubMed] [Google Scholar]
- 4.Im JJ, Lessard CS IEEE Engineering in Medicine and Biology Society, editors. A study for the development of a noninvasive continuous blood pressure measuring system by analyzing radial artery pulse from a wrist; IEEE 17th Annual Conference on Engineering in Medicine and Biology Society; 1995 Sep 20-23; New York: IEEE; 1995. pp. 1033–4. [Google Scholar]
- 5.Poon CY, Zhang YT, Yinbo L IEEE Engineering in Medicine and Biology Society, editors. Modeling of Pulse Transit Time under the Effects of Hydrostatic Pressure for Cuffless Blood Pressure Measurements; 3rd IEEE/EMBS International Summer School on Medical Devices and Biosensors; 2006 Sep 4-6; Cambridge, MA. New York: IEEE; 2006 . pp. 65–8. [Google Scholar]
- 6.Blinov AV, Selivanov EP. Plethysmographic impedance device for measuring blood pressure. Measurement Techniques. 1997;40:188–92. [Google Scholar]
- 7.Santic A, Saban M IEEE Engineering in Medicine and Biology Society, editors. Two Methods for Determination of Diastolic and Systolic Pressures in Fingers; IEEE 17th Annual Conference on Engineering in Medicine and Biology Society; 1995 Sep 20-25; Montreal, Que. New York: IEEE; 1995. pp. 149–50. [Google Scholar]
- 8.Azmal GM, Al-Jumaily A, Al-Jaafreh M Nanyang Technological University, editors. Continuous Measurement of Oxygen Saturation Level using Photoplethysmography Signal; International Conference on Biomedical and Pharmaceutical Engineering; 2006 Dec 11-14; Singapore. New York: IEEE; 2006. pp. 504–7. [Google Scholar]
- 9.Lee YD, Jung SJ, Seo YS, Chung WY IEEE Computer Society, editors. Measurement of Motion Activity during Ambulatory Using Pulse OximeterandTriaxial Accelerometer; Third International Conference on Convergence and Hybrid Information Technology; 2008 Nov 11-13; Busan. New York: IEEE; 2008. pp. 436–41. [Google Scholar]
- 10.Jeong DU, Kim SJ IEEE Computer Society, editors. Development of a Technique for Cancelling Motion Artifact in Ambulatory ECG Monitoring System; Third International Conference on Convergence and Hybrid Information Technology; 2008 Nov 11-13; Busan. New York: IEEE; 2008. pp. 954–61. [Google Scholar]
- 11.Nitzan M, Khanokh B, Slovik Y. The difference in pulse transit time to the toe and finger measured by photoplethysmography. Physiol Meas. 2002;23:85–93. doi: 10.1088/0967-3334/23/1/308. [DOI] [PubMed] [Google Scholar]


