

Abstract
Background
Crossed High Alcohol Preferring (cHAP) mice were selectively bred from a cross of the HAP1xHAP2 replicate lines, and demonstrate blood ethanol concentrations (BECs) during free-choice drinking that are reminiscent of those observed in alcohol-dependent humans. Therefore, this line may provide an unprecedented opportunity to learn about the consequences of excessive voluntary ethanol consumption, including metabolic tolerance and liver pathology. Cytochrome p450 2E1 (CYP 2E1) induction plays a prominent role in driving both metabolic tolerance and ethanol-induced liver injury. In this report, we sought to characterize cHAP drinking by assessing whether pharmacologically relevant BEC levels are sustained throughout the active portion of the light-dark cycle. Given that cHAP intakes and BECs are similar to those observed in mice given an ethanol liquid diet, we assessed whether free-choice exposure results in metabolic tolerance, hepatic enzyme induction, and hepatic steatosis.
Methods
In Experiment 1, blood samples were taken across the dark portion of a 12:12 light-dark cycle to examine the pattern of ethanol accumulation in these mice. In Experiments 1 and 2, mice were injected with ethanol following 3–4 weeks of access to water or 10% ethanol and water, and blood samples were taken to assess metabolic tolerance. In Experiment 3, 24 mice had 4 weeks access to 10% ethanol and water or water alone, followed by necropsy and hepatological assessment.
Results
In experiment 1, cHAP mice mean BEC values exceeded 80 mg/dl at all sampling points, and approached 200 mg/dl during the middle of the dark cycle. In experiments 1 and 2, ethanol-exposed mice metabolized ethanol faster than ethanol-naïve mice, demonstrating metabolic tolerance (p < .05). In experiment 3, ethanol-drinking mice showed greater expression of hepatic CYP 2E1 than water controls, consistent with the development of metabolic tolerance (p < .05). Ethanol access altered neither hepatic histology nor levels of ADH and ALDH.
Conclusions
These results demonstrate that excessive intake by cHAP mice results in sustained BECs throughout the active period, leading to the development of metabolic tolerance and evidence of CYP 2E1 induction. Together these results provide additional support for the cHAP mice as a highly translational rodent model of alcoholism.
Keywords: Selective breeding, self-administration, rodent model, alcohol metabolism
Introduction
Alcoholism is defined by uncontrolled and excessive use of alcohol to the degree that individuals continue its use in the wake of adverse consequences (Morse and Flavin, 1992). A long history of rodent research has attempted to model human excessive alcohol consumption. In particular, 2-bottle free-choice procedures between water and ethanol have been widely used to assess both intake levels and ethanol preference in alcohol preferring inbred strains and selectively bred lines of rodents. It is a simple procedure, and has yielded a significant amount of information regarding the correlated traits, neurobiology, and the genetics of ethanol preference (McBride and Li, 1998). These procedures also have a high level of face validity for modeling human alcohol consumption, considering they capture a naturalistic, voluntary behavior. Further, variation in reinforcement driven behavior appears to be strongly related to differences in free-choice alcohol consumption (Green and Grahame, 2008).
Traditionally, there have been limitations to free-choice studies, because most rodents drink in discrete bouts and do not sustain a high rate of intake. Pharmacologically relevant blood ethanol concentrations (BECs) have been found in different strains of rats and mice, though these levels are modest and are often not sustained for long periods of time in a way that models excessive human intake (Aalto, 1986; Agabio et al., 1996; Dole and Gentry, 1984; Murphy et al., 1986). Complicating the free-choice procedure is that individual differences in consumption throughout the diurnal cycle have made it difficult to predict high intake periods, therefore making it difficult to manipulate or measure behaviors related to alcohol consumption (Crabbe, 2010). As a result, daily fluid intake values have been reported, which does not provide information about the relationship between consumption and intoxication, as might be indicated by concurrently assessing intake and BECs. Observing moderate ethanol intake and low BEC levels during free-choice access has also made it difficult to ascertain whether animals are consuming ethanol for its pharmacologic effects (Cunningham et al., 2000; Rodgers et al., 1963).
Recently, we observed ethanol drinking patterns in selectively bred high alcohol preferring (HAP) mice, and observed that all of the lines demonstrate stable, excessive patterns of ethanol intake across the dark portion of a 12:12 light-dark cycle (Matson and Grahame, 2011). HAP mice were selected from the HS/Ibg line (Institute of Behavior Genetics, Boulder, CO) for their ethanol intake during free-choice access to 10% ethanol and water over a four-week period (Grahame et al., 1999; Oberlin et al., 2010). While all of the HAP lines drink considerable quantities of alcohol, the highest intakes are seen in the crossed HAP (cHAP) line, generated by a cross and subsequent selection from HAP replicate 1 (HAP1) X HAP replicate 2 (HAP2). At peak hours of intake, all of the lines reach moderate to high BECs, with the HAP1 and crossed HAP (cHAP) line reaching mean BEC levels of greater than 200 mg/dl (Matson and Grahame, 2011). These observations challenge the previously held notion that rodents will not consistently drink at a rate that will surpass their capacity to metabolize ethanol during free-choice access. Further, the HAP1 and cHAP lines demonstrate BECs and levels of intake that are reminiscent of those observed in alcohol-dependent humans (Mello and Mendelson, 1970), and therefore, may provide a unique opportunity to learn about the vulnerabilities and consequences of voluntary chronic, excessive consumption in rodents (Leeman et al., 2010).
The development of tolerance in some capacity is often a characteristic of alcohol-dependent individuals, and is thought to be an important factor in the development of dependence. Tolerance is defined the by the DSM-IV as a need for markedly increased amounts of a substance to achieve intoxication, or a diminished effect with continued use of the same amount of a substance (American Psychological Association, 2000). Metabolic tolerance is a type of dispositional tolerance involving an increase in the excretion rate of ethanol, and has been demonstrated in humans as well as mice and rats following ethanol liquid diet or injection procedures (Hall et al., 2001). In a series of experiments, Lieber and DeCarli (1968; 1970) demonstrated that a hepatic microsomal ethanol oxidizing system (MEOS) exists in both rats and humans, and that this system metabolizes ethanol in a separate pathway from that involving ethanol oxidation by alcohol dehydrogenase (ADH) and catalase. MEOS activity also increases following chronic exposure to ethanol liquid diet compared to pair-fed animals. It is now clear that adaptations in MEOS, through induction of cytochrome p450 enzymes, result in increased ethanol metabolism following chronic exposure to a liquid ethanol diet (Lieber and DeCarli, 1972; Ohnishi and Lieber, 1977). Specifically, the induction of cytochrome p450 2E1 (CYP 2E1) is thought to play a prominent role in driving metabolic tolerance, as it is induced following chronic exposure to high levels of blood ethanol (Lieber, 1997; Ronis et al., 1993). Induction of CYP 2E1 also results in increased production of reactive oxygen species and acetaldehyde following heavy ethanol use, and this has been postulated to be an important mechanism for ethanol-induced liver injury (for review Lieber, 2004). Although modest ADH induction has been found following chronic ethanol exposure, this was demonstrated to be a downstream effect of ethanol inhibiting gonadal hormone production (Rachamin et al., 1980). More recently, Badger et al. (2000) found cyclic induction of ADH in rats given alcohol by chronic intragastric infusion, which correlated with cyclic changes in urinary alcohol levels, but this phenomenon has not been seen with the amounts of ethanol rodents will voluntarily consume.
The Lieber-DeCarli ethanol liquid diet was developed as an alternative to free-choice ethanol procedures, largely because the low intakes observed during testing do not result in alteration in hepatic pathology as has been observed in humans with heavy drinking. The diet incorporates ethanol into a liquid diet resulting in high ethanol intake, high BECs, and evidence of hepatic steatosis after 24 days of access (DeCarli and Lieber, 1967; Lieber and DeCarli, 1970). This paradigm has successfully allowed for the investigation on the mechanisms of alcohol-induced liver damage (for review Lieber and DeCarli, 1989). While this has become the standard method of inducing fatty liver in rodents, a free choice drinking and feeding paradigm would be a substantially simpler system for testing pathological effects of heavy alcohol use on the liver and possibly other organs.
In this report, cHAP drinking behavior was characterized by assessing whether pharmacologically relevant BEC levels are sustained throughout the active portion of the light-dark cycle during chronic free-choice access to 10% ethanol. We hypothesized that pharmacologically relevant levels would be maintained throughout the dark period, and decrease at the beginning of the inactive (light) period. Metabolic tolerance has previously been observed in P rats following chronic free-choice access to ethanol and water, but this procedure also involved providing 4 days of forced access prior to free-choice ethanol access (Lumeng and Li, 1986). To our knowledge, metabolic tolerance has not been demonstrated in rodents following strictly voluntary ethanol consumption. Given the high ethanol intakes observed in cHAP mice, it is plausible that chronic exposure to ethanol will result in metabolic tolerance and corresponding changes in hepatic histology. In this study, we examined hepatic histology to assess whether the high intake and BEC levels in cHAP mice caused ethanol-induced liver injury, as the levels we observe in these mice during free-choice ethanol access are similar to those observed in mice and rats given an ethanol liquid diet.
Materials and Methods
Male and female cHAP mice were born in the IUPUI Animal Care Facilities. Water and food (Purina 5001) were available ad libitum, and ambient temperature was maintained at 21 ± 1° C. All experiments were performed in drug-naïve mice, and the animals were single-housed approximately 1 week before beginning testing.
Experiment 1 consisted of 47 female and male cHAP mice from the 17th generation aged 55–66 days old at day 1 of ethanol access. Experiment 2 consisted of 24 female and male cHAP mice from the 18th generation, aged 64 to 81 days old at day 1 of ethanol access. In experiments 1 and 2, mice were put on a reverse 12:12 light dark cycle at least 2 weeks prior to the study. Experiment 3 consisted of 24 female and male cHAP mice from the 18th generation, aged 57–66 days old at day 1 of ethanol access.
Experimental Procedures
Experiment 1
Ethanol mice (n = 36) had access to water and a 10% ethanol solution for 26 days. Intakes were recorded and bottles sides were switched 3 times per week using 25- and 50-ml graduated cylinders mounted on wire cage tops. Water mice (n = 11) were given water access using two 25 ml tubes. On day 22, the ethanol-exposed mice had access to 10% ethanol and water using 10 mL tubes (readable to ± .05 mL), and bihourly readings were taken from 6 am-10pm, 2 hours prior to lights off and 2 hours after lights on. On day 24 of ethanol access, retro-orbital blood samples were taken at 4 time-points across the cycle in a between-subjects manner with 8–9 animals sampled at each time-point (10 am, 2 pm, 6 pm and 10 pm). Ethanol bottles were returned until lights on (8 pm) the following day, when they were removed to allow for the clearance of blood ethanol before metabolism testing on day 26. Beginning at lights off (8 am), 6 ethanol-naive and 6 ethanol-exposed mice were each given a 2 g/kg intra-peritoneal (i.p.) injection of 20% v/v ethanol. Each mouse was sampled via the retro-orbital sinus at 25 and 75 minutes. Another cohort of mice was sampled at 50 and 125 minutes, but these data are not reported, because several of the mice reached zero blood ethanol levels at 125 minutes and we were unable to estimate the slope of ethanol metabolism. The dose and time parameters were adapted from Grahame and colleagues (1999), and were used to obtain linear regressions of ethanol elimination rates. All blood samples were determined using an Analox Analyzer (Analox Instruments, Luneburg, MO, USA)
Experiment 2
In experiment 2, 12 male and female cHAP mice had access to 10% ethanol and water, and 12 male and female cHAP mice had access to water for 3 weeks using the same procedure described for Experiment 1. On day 21, ethanol bottles were removed at 8pm (lights on) to allow ethanol to clear prior to testing on the following day. In experiment 1, we observed that the ethanol-exposed animals metabolized all ethanol prior to 125 minutes, thus we chose to increase the dose to 3 g/kg. Beginning at lights off (8 am) the following day, all mice were given a 3 g/kg injection of 20% ethanol (v/v, diluted from 100% using a 0.9% saline solution). Each mouse was sampled via the retro-orbital sinus twice with a cohort having blood drawn at at 25 and 75 minutes, and another cohort having blood drawn at 50 and 125 minutes following the injection (12 mice at each time-point, 5–6 per group). Blood ethanol concentrations were assessed using gas chromatography as previously described (Lumeng et al., 1982). This experiment extended the result from experiment 1 by assessing whether metabolic tolerance is evident at another dose (3 g/kg) at which certain enzymes may be differently recruited, as well as whether the effect persists throughout clearance. Experiment 2 also allowed us to assess whether metabolic tolerance is evident following the third week (versus fourth week) of ethanol exposure.
Experiment 3
In experiment 3, 12 male and female cHAP mice had access to 10% ethanol and water for 4 weeks using the same procedure described for Experiment 1, and an additional 12 mice had access to water during this time. We lengthened the access period from 3 to 4 weeks to increase the likelihood of observing pathological effects of ethanol consumption on the liver. All mice were weighed and anesthetized using isoflourane. A blood sample was taken via cardiac puncture and liver tissues were harvested as rapidly as possible, immediately freeze-clamped with Wollenberger tongs at the temperature of liquid nitrogen, powdered under liquid nitrogen with a mortar and pestle, and stored at −80°C for analysis. A part of the sliced liver tissues was fixed in 10% formalin solution for routine hematoxylin and eosin staining. Frozen sections of the liver were stained with Oil Red O. Sixty milligrams of whole liver tissue powder prepared under liquid nitrogen were homogenized with RIPA buffer. Protein concentrations were determined by the Bio-Rad assay. Equal amounts of protein (20 μg of protein) were separated on SDS-polyacrylamide gels, transferred to a nitrocellulose membrane by the wet blotting method, and probed with antibodies as indicated. The following primary antibodies were used: anti-CYP2E1 (Abcam, Cambridge, MA), anti-human ADH (Dr. William Bosron, Indiana University), and anti-ALDH2 (Dr. Henry Weiner, Purdue University). The amounts of bound antibodies were assessed by the peroxidase activity of horseradish peroxidase-conjugated secondary antibody, as detected by chemiluminescence with Lumi-light Western blotting substrate (Amersham Biosciences, Piscataway, NJ).
Analyses
Experiment 1
The pattern of drinking rhythms was analyzed using a Repeated Measures ANOVA using Time (9 time-points) and Sex as independent variables. To look at the time-course of BECs, a Sex x Time-point (10 am, 2 pm, 6 pm, 10 pm) ANOVA was performed. Pearson correlations were performed to assess whether there was a correlation between the rate of alcohol intake and BEC at each time-point, as well as across all time-points.
Individual metabolic rates were calculated using a linear regression, and the slopes were derived to assess changes in BEC across minutes. To assess whether metabolic tolerance develops following chronic access to ethanol, a Group x Sex ANOVA assessed whether there were significant differences in slope between the sexes, as well as between ethanol-exposed and water-exposed mice. Separate Sex x Group ANOVAs were performed to assess for body weight differences in all three experiments on test day.
Experiment 2
Linear regressions were calculated to assess change in BEC across minutes. To assess whether metabolic tolerance developed following chronic access to ethanol, we compared the slopes of these regressions using an omnibus Cohort x Group x Sex ANOVA to determine if there were significant differences in the slope between the sampling cohorts, sexes, and between ethanol-exposed and water-exposed mice.
Experiment 3
Liver weight was divided by body weight to obtain a liver/body weight ratio. A Group x Sex ANOVA was run to assess whether there were differences in this ratio between the sexes or between ethanol-naïve and ethanol-exposed groups. Separate Group ANOVAS were run to determine if there were differences in levels of ALDH, ADH, and CYP-2e protein between ethanol-exposed and water control mice. We chose not to include Sex as a factor, since the gels were stratified by sex during electrophoresis, therefore making it difficult to directly compare the sexes. Hepatic histology was determined from hematoxylin and eosin staining.
Results
Experiment 1
A timeline of the procedure is presented in Figure 1A. As previously observed, cHAP mice maintain a stable drinking rhythm during the dark portion of the light-dark cycle following chronic access (Matson and Grahame, 2011). The rate of intake is low during the 2 hours prior to lights off, and rapidly increases to a high level during the following 2 hours. Mauchley’s Test of Sphericity was significant (p < .05), therefore we used the Greenhouse-Geisser test for repeated measures. A repeated measures ANOVA indicated there was a main effect of Sex, F(1, 34) = 13.58, p < .05, with females drinking at a higher rate than males. There was also a main effect of Time, F(2.12, 72.02) = 50.00, p < .05 (Figure 1), but there was no interaction of Time and Sex, F(2.12, 72.02) = p > .05. Time was further analyzed to assess whether there was a peak point of intake. A Bonferroni adjustment was used to conduct post-hoc analysis of the Time variable (.05/9 timepoints = .006), which revealed that the highest point of intake (8–10 am) was significantly different from all other time-points (ps < .006) (Figure 1B).
Figure 1.

(A) Timeline for Experiment 1 (B) Chronic drinking rhythm in cHAP mice including 2 hours before and after the dark portion of the cycle, with shading during the dark portion of the light-dark cycle and arrows indicating time of blood sampling on day 24. We report intake in g/kg/h and the asterisk (*) indicates the peak point of intake compared to all other points of intake.
A Sex x Time between-subjects ANOVA indicated there were significant differences in BEC values across the four sampling points, F(3, 27) = 5.05, p < .05, but there was no difference in BEC between the sexes, F(1, 27) = 2.43, p > .05. There was also no interaction of Time and Sex, F(3, 27) = .58, p > .05. Post hoc analyses were performed for Time using a Bonferroni correction (.05/4 = .013), and indicated that the BEC values at 2 pm and 6 pm were not different from each other, but were significantly higher than BEC at 10 pm. The BEC values from the 10 am sampling point were not significantly different from any other time-point. Mean ± SEM BEC values (in mg/dl) were 112 ± 20 at 2 hours after lights off, 189 ± 27 at 6 hours after lights off, 194 ± 30 at 10 hours after lights off, and 90 ± 22 at 2 hours after lights on (Figure 2a). A Bonferroni correction was used to assess whether there were significant Pearson correlations for rate of intake and BEC (.05/5 = .01). There was a significant correlation between rate of intake across all sampling points and BEC (p < .01), but there were no significant correlations between rate of intake and individual sampling points (ps > .01) (Figure 2b).
Figure 2.

(A) BECs across the day in cHAP mice (n = 8–9 per time point). Mean BECs were 112 ± 20 mg/dl at 2 hours after lights off (6/9 above 80 mg/dl), 189 ± 27 mg/dl at 6 hours after lights off (8/9 above 80 mg/dl), 194 ± 30 mg/dl at 10 hours after lights off (7/8 above 80 mg/dl), and 90 ± 22 mg/dl at 2 hours after lights on (6/9 above 80 mg/dl). (B) The correlation of BEC (mg/dl) with rate of intake across the day (g/k/h) until the point of blood sampling. Rate of intake was calculated by dividing intake in g/kg by the number of intake hours prior to sampling beginning at lights off (8 am).
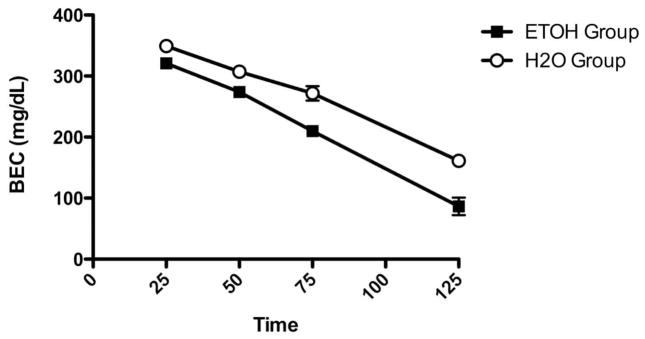
A Sex x Group ANOVA indicated there was a significant difference in ethanol metabolism between the chronically ethanol-exposed and water-exposed mice F(1, 8) = 6.05, p < .05, with metabolic rates of 2.3 ± .4 mg/dl/min and 1.5 ± .2 mg/dl/min, respectively (Figure 3a). There were no differences in metabolic rate between the sexes, F(1, 8) = 4.98, p > .05 and there was no interaction of Sex and Group, F(1, 7) = 3.14, p > .05. Another Sex x Group ANOVA indicated males were heavier than females, F(1, 19) = 14.99, p < .005, with body weights of 24.2 ± .6 g and 21.3 ± .3 g, respectively. There were no significant differences in body weight between ethanol- and water-exposed mice, F(1, 19) = .14, p > .05, nor was there an interaction of Sex and Group, F(1, 19) = 0.00, p > .05.
Figure 3.

Clearance in ethanol-exposed and ethanol-naive mice following a 2 g/kg challenge dose with 20% ethanol. Ethanol-exposed mice metabolized alcohol faster than naïve mice with clearance rates of 2.3 ± .4 mg/dl/min and 1.5 ± .2 mg/dl/min, respectively.
Experiment 2
During the last week of ethanol access, cHAP mice averaged intakes of 23.0 + .67 g/kg. A t-test indicated that the sexes did not differ in intake, t(10) = .568, p > .05. To assess differences in alcohol metabolism as a function of drinking history, a Cohort x Group x Sex ANOVA indicated that there was a significant main effect of Group, F(1, 16) = 14.42, p < .005. Ethanol-exposed mice metabolized ethanol faster than ethanol-naïve mice with rates of 2.4 ± .2 mg/dl/min and 1.8 ± .1 mg/dl/min, respectively (Figure 4). There was also a main effect of Sex, F(1, 16) = 5.43, p < .05. Males metabolized ethanol faster than females, with metabolic rates of 2.2 ± .2 and 1.9 + .1 mg/dl/min, respectively. There was no main effect of Cohort, F(1, 16) = 4.29, p > .05 nor were there any significant interactions, Fs(1, 16) < 3.25, ps > .05. A Sex x Group ANOVA on body weight at time of testing indicated that male mice were heavier than female mice, F(1, 20) = 21.30, p < .05, with body weights of 24.6 ± .4 g and 22.2 ± .2 g, respectively. There was no significant effect of Group, F(1, 20) = .20, p > .05, nor was there an interaction of Group and Sex, F(1, 20) = .06, p > .05.
Figure 4.
Clearance in ethanol-exposed and ethanol-naïve mice following a 3 g/kg challenge dose with 20% ethanol. Ethanol-exposed mice had a faster metabolism rate than ethanol-naïve mice with rates of 2.4 ± .2 mg/dl/min and 1.8 ± .1 mg/dl/min, respectively.
Experiment 3
By the fourth week of ethanol access, cHAP intake averaged 27.6 ± 1.2 g/kg, although a t-test indicated that there was no sex difference in ethanol intake, t(6) = 1.15, p > .05. A Sex x Group ANOVA indicated that there were no differences in the liver/body weight ratios between genders or between ethanol-exposed and –naïve groups, nor was there an interaction of sex and group F(1, 12) < .69, ps > .05. Another Sex x Group ANOVA indicated that males were heavier than females, F(1, 12) = 18.24, p < .05, with body weights of 25.9 ± 1.0 g and 21.2 ± .4 g, respectively. Again, there were no significant differences between ethanol-exposed and -naïve mice, F(1, 12) = 1.02, p > .05, nor was there an interaction of Sex and Group, F(1, 12) = 1.53, p > .05.
An ANOVA indicated that there was no difference in the level of ALDH protein between the ethanol-exposed and ethanol-naïve groups, F(1, 14) = .012, p > .05 (Figure. There was also no difference in the level of ADH protein between the ethanol-exposed and ethanol-naïve groups F(1, 14) = .004, p > .05. Conversely, another ANOVA indicated there was a significantly higher level of CYP-2E1 in ethanol-exposed versus ethanol-naïve mice, F(1, 14) = 42.96, p < .001 (Figure 5B, E, C, F). Histological examination showed no evidence of hepatic steatosis or other liver injury in ethanol-exposed mice compared to controls (Figure 5A, D).
Figure 5.

Histological analysis of the livers and the protein expression of alcohol metabolizing enzymes (ADH, ALDH, and CYP 2E1) in mice with ad libitum access to either water or ethanol and water, and stratified by gender (males panels A–C and females panels D–F). There were no significant alterations in hepatic histology between with free access to water and ethanol for both genders (5A and 5D). The levels of ADH, ALDH, and CYP 2E1 were determined by western blotting (using actin as the loading control). There were no significant changes in the levels of ADH and ALDH in cHAP mice following ethanol access compared to water controls (p > .05). However, the expression of hepatic CYP 2E1 was significantly increased in mice with free access to ethanol when compared to water access controls (p < .05) (5B, 5C, 5E, and 5F).
Discussion
In this paper, we have shown that the excessive rate of intake demonstrated in cHAP mice throughout the active portion of the light dark cycle also results in high blood ethanol levels through the entire dark portion of the light dark cycle. Further, this high level of ethanol intake results in evidence of metabolic tolerance, as is demonstrated by a faster ethanol clearance and an increased level of hepatic CYP 2E1 expression compared to water-exposed control mice. Finally, this high level of exposure does not result in hepatic steatosis, which we had expected might occur based on previous results demonstrating that 4 weeks of ethanol liquid diet causes hepatic steatosis in mice (Lieber and DeCarli, 1963; DeCarli and Lieber, 1970).
The results from experiment 1 and recent observations in HAP mice challenge the notion that rodents will not voluntarily self-administer past their capacity to metabolize consumed ethanol (Matson and Grahame, 2011). In experiment 1, we were interested in assessing the daily “area under the curve” with regard to blood ethanol levels in the cHAP line, and were able to demonstrate that a majority of cHAP mice maintain pharmacologically relevant BECs throughout the dark portion of the light-dark cycle, and even up through 2 hours following lights on. Although BECs decrease following lights on, 67% of the mice still had pharmacologically relevant levels (> 80 mg/dl) at 10 pm. In addition, BEC is strongly and positively correlated with rate of intake across the day, and when taken with the replication of the drinking pattern in cHAP mice, suggests these animals engage in predictable alcohol consumption behavior that is highly useful for a variety of experiments. Quantification of the daily pattern of alcohol exposure in these mice may allow for behavioral, neurobiological, or genetic changes to be examined in a dose- and time-dependent manner.
Demonstrating high BECs in HAP mice not only allows for exploration of questions surrounding drinking and the presumed intoxication that results, but also for studying behaviors that may result from chronic alcohol intake. Few studies have assessed whether tolerance results following 24-hour, free-choice administration in rodents, as this type of drinking paradigm is often limited by the amount of ethanol rodents will voluntarily consume. It has been shown that P rats demonstrate metabolic tolerance following a period of free-choice access to ethanol, and further, that the degree of metabolic tolerance did not differ from P rats fed an alcohol liquid diet (Lumeng and Li, 1986). This procedure used a 4-day period with ethanol available as the only source of liquid prior to free-choice ethanol access. Otherwise, forced access, injection, or gastric intubation of ethanol has typically been necessary to induce metabolic tolerance (Lieber, 2004). Although these models result in high BECs, free-choice consumption may be less stressful and closely models human behavior. Our results demonstrate that cHAP mice develop metabolic tolerance following strictly voluntary access to ethanol, which is a novel finding in rodents (Matson and Grahame, 2011). We also recently demonstrated that cHAP mice increase their daily ethanol intake during three weeks of free-choice access, therefore the increase may be at least partially driven by the development of metabolic tolerance, which is also thought to occur in human heavy ethanol consumption (Lieber, 2004; Matson and Grahame, 2011).
Further, cHAP mice had increased levels of CYP 2E1 protein following chronic ethanol exposure. This is consistent with a body of literature supporting the idea that increased CYP 2E1 activity is largely responsible for driving metabolic tolerance in both rodents and humans (Takahashi et al., 1993). In addition, this adds to the evidence that this rodent model is unique in its ability to demonstrate physiological alterations in liver following chronic exposure to high BECs through strictly voluntary ethanol access. It is interesting that changes in CYP 2E1 seem to be dependent on both the duration and the level of blood ethanol. CYP 2E1 induction has been shown to occur through post-translational mechanisms following lower BECs (< 200 mg/dl), but is driven by transcriptional and post-translational changes at high BECs (> 250 mg/dl) (Badger et al., 1993; Ronis et al., 1993). Our results demonstrate that there is a sufficient amount of ethanol exposure during free-choice access in cHAP mice to induce CYP 2E1 through increasing levels of the protein. Considering that cHAP mice will sustain BEC levels of between 100–200 mg/dl throughout the active portion of the light dark cycle, future studies should address whether there are accompanying increases in enzyme activity and mRNA expression of CYP 2E1.
Hepatic steatosis was not evident following chronic free-choice access to ethanol. This was somewhat surprising, as cHAP intake and BECs are similar to the levels observed in rats given an ethanol liquid diet (for review, Lieber and DeCarli, 1989). On the other hand, the C57/Bl6J (B6) inbred strain has been observed to consume ~19 g/kg/day and achieve BEC levels around 300 mg/dl during liquid ethanol diet access (Anji and Kumari, 2008). Although cHAP intake is higher, the BECs observed across the dark cycle are lower than what was observed in B6 mice given a liquid diet. Lower BECs in cHAP mice may be explained by the development of metabolic tolerance, as the rate of ethanol metabolism may be high enough to prevent BECs from reaching levels that are necessary to cause hepatotoxicity. Further, nutritional composition is important in determining the extent of ethanol-induced liver damage. It is well known that a high fat diet exacerbates alcohol-induced fatty liver in rodents (D’Souza El-Guindy et al., 2010; Fisher et al., 2002). However, we observe fatty liver in C57 mice fed the Dytes low fat Lieber-DeCarli diet (Liangpunsakul et al., 2012). This diet contains 13.6 g fat/l and with intakes of approximately 15 ml/day, they consume 0.2 g of fat/day. The control Purina 5001 diet contains 4% fat, and with an average intake of 5 g/day of mouse chow, the intake would have been in the same range as with the liquid diet. Thus, the type of fat (pork fat for the Purina diet, hence saturated, which is known to protect against fatty liver vs polyunsaturated vegetable fat in the Dytes formulation), may be critical (You et al., 2005). In addition, there are strain differences in susceptibility to steatosis (unpublished data), and the selection of the HAP and cHAP mice involved testing breeding animals for alcohol consumption. Therefore, selection might have resulted in epigenetic changes that alter hepatic responses to alcohol.
In conclusion, the cHAP line demonstrates a stable, excessive pattern of ethanol intake and corresponding BECs across the dark portion of a diurnal cycle. Achieving stable, high intake in cHAP mice to the observed level of intoxication may provide a unique opportunity for modeling chronic, excessive human intake (Leeman et al., 2010). This excessive intake results in the development of metabolic tolerance in the cHAP line and evidence of CYP 2E1 induction, which provides additional support for the cHAP mice as a highly translational rodent model of alcoholism. Together, our observations provide justification for exploration into other predisposing factors surrounding excessive consumption, as well as the development of other physiological and toxicological outcomes following voluntary chronic ethanol exposure.
Contributor Information
Liana Matson, Email: lmmatson@iupui.edu, Dept. of Psychology, Indiana University Purdue University at Indianapolis (IUPUI), 402 N Blackford St., Indianapolis, IN 46202, USA, FAX: (317) 274-6756
Suthat Liangpunsakul, Email: sliangpu@iupui.edu, Associate Professor, Dept. of Medicine, Indiana University School of Medicine, University Hospital, Room 4100, 550 University Blvd. Indianapolis, IN 46202-5149, Voice: (317) 278-1630.
David Crabb, Email: dcrabb@iupui.edu, Professor and Chair, Dept. of Medicine, Indiana University School of Medicine, Emerson Hall, Room 317, 545 N. Barnhill Dr. Indianapolis, IN 46202-5124, Voice: (317) 274-8438
Amy Buckingham, Email: abucking@umail.iu.edu, Dept. of Psychology, Indiana University Purdue University at Indianapolis (IUPUI), 402 N Blackford St., Indianapolis, IN 46202, USA, FAX: (317) 274-6756.
Ruth Ann Ross, Email: raross@iupui.edu, Dept. of Medicine, Indiana University School of Medicine.
Meredith Halcomb, Email: mheighto@iupui.edu, Dept. of Psychology, Indiana University Purdue University at Indianapolis (IUPUI), 402 N Blackford St., Indianapolis, IN 46202, USA, Voice: (317) 278-8456, FAX: (317) 274-6756
Nicholas Grahame, Email: ngrahame@iupui.edu, Associate Professor, Dept. Psychology, Indiana University Purdue University at Indianapolis (IUPUI), 402 N Blackford St., Indianapolis, IN 46202, USA, Voice: (317) 274-0194, FAX: (317) 274-6756
Works Cited
- Aalto J. Circadian drinking rhythms and blood alcohol levels in two rat lines developed for their alcohol consumption. Alcohol. 1986;3(1):73–5. doi: 10.1016/0741-8329(86)90074-1. [DOI] [PubMed] [Google Scholar]
- Agabio R, Cortis G, Fadda F, Gessa GL, Lobina C, Reali R, Colombo G. Circadian drinking pattern of Sardinian alcohol-preferring rats. Alcohol Alcoholism. 1996;31(4):385–8. doi: 10.1093/oxfordjournals.alcalc.a008166. [DOI] [PubMed] [Google Scholar]
- American Psychological Association. Diagnostic and Statistical Manual of Mental Disorders. Text Revision. 4. American Psychiatric Press; Washington, DC: 2000. [Google Scholar]
- Anji A, Kumari M. Supplementing the liquid alcohol diet with chow enhances alcohol intake in C57 BL/6 mice. Drug Alcohol Depen. 2008;97(1–2):86–93. doi: 10.1016/j.drugalcdep.2008.03.022. [DOI] [PMC free article] [PubMed] [Google Scholar]
- Badger TM, Hoog JO, Svensson S, McGehee RE, Jr, Fang C, Ronis MJ, Ingelman-Sundberg M. Cyclic expression of class I alcohol dehydrogenase in male rats treated with ethanol. Biochem Bioph Res Co. 2000;274(3):684–8. doi: 10.1006/bbrc.2000.3186. [DOI] [PubMed] [Google Scholar]
- Badger TM, Huang J, Ronis M, Lumpkin CK. Induction of cytochrome P450 2E1 during chronic ethanol exposure occurs via transcription of the CYP 2E1 gene when blood alcohol concentrations are high. Biochem Bioph Res Co. 1993;190(3):780–5. doi: 10.1006/bbrc.1993.1117. [DOI] [PubMed] [Google Scholar]
- Crabbe JC. Consilience of rodent and human phenotypes relevant for alcohol dependence. Addict Biol. 2010;15(2):103–8. doi: 10.1111/j.1369-1600.2009.00188.x. [DOI] [PMC free article] [PubMed] [Google Scholar]
- Cunningham CL, Fidler TL, Hill KG. Animal models of alcohol’s motivational effects. Alcohol Res Health. 2000;24(2):85–92. [PMC free article] [PubMed] [Google Scholar]
- D’Souza El-Guindy NB, Kovacs EJ, De Witte P, Spies C, Littleton JM, de Villiers WJ, Lott AJ, Plackett TP, Lanzke N, Meadows GG. Laboratory models available to study alcohol-induced organ damage and immune variations: choosing the appropriate model. Alcoholism Clin Exp Res. 2010;34(9):1489–511. doi: 10.1111/j.1530-0277.2010.01234.x. [DOI] [PMC free article] [PubMed] [Google Scholar]
- DeCarli LM, Lieber CS. Fatty liver in the rat after prolonged intake of ethanol with a nutritionally adequate new liquid diet. J Nutr. 1967;91(3):331–6. doi: 10.1093/jn/91.3_Suppl.331. [DOI] [PubMed] [Google Scholar]
- Dole VP, Gentry RT. Toward an analogue of alcoholism in mice: scale factors in the model. P Natl Acad Sci USA. 1984;81(11):3543–6. doi: 10.1073/pnas.81.11.3543. [DOI] [PMC free article] [PubMed] [Google Scholar]
- Fisher H, Halladay A, Ramasubramaniam N, Petrucci JC, Dagounis D, Sekowski A, Martin JV, Wagner GC. Liver fat and plasma ethanol are sharply lower in rats fed ethanol in conjunction with high carbohydrate compared with high fat diets. J Nutr. 2002;132(9):2732–6. doi: 10.1093/jn/132.9.2732. [DOI] [PubMed] [Google Scholar]
- Grahame NJ, Li TK, Lumeng L. Selective breeding for high and low alcohol preference in mice. Behav Genet. 1999;29(1):47–57. doi: 10.1023/a:1021489922751. [DOI] [PubMed] [Google Scholar]
- Green AS, Grahame NJ. Ethanol drinking in rodents: is free-choice drinking related to the reinforcing effects of ethanol? Alcohol. 2008;42(1):1–11. doi: 10.1016/j.alcohol.2007.10.005. [DOI] [PMC free article] [PubMed] [Google Scholar]
- Hall Mdl, Lieber CS, DeCarli LM, French SW, Lindros KO, Jarvelainen H, Bode C, Parlesak A, Bode JC. Models of alcoholic liver disease in rodents: a critical evaluation. Alcohol Clin Exp Res. 2001;25(5 Suppl ISBRA):254S–261S. doi: 10.1097/00000374-200105051-00041. [DOI] [PubMed] [Google Scholar]
- Leeman RF, Heilig M, Cunningham CL, Stephens DN, Duka T, O’Malley SS. Ethanol consumption: how should we measure it? Achieving consilience between human and animal phenotypes. Addict Biol. 2010;15(2):109–24. doi: 10.1111/j.1369-1600.2009.00192.x. [DOI] [PMC free article] [PubMed] [Google Scholar]
- Liangpunsakul S, Rahmini Y, Ross RA, Zhao Z, Xu Y, Crabb DW. Imipramine blocks ethanol-induced ASMase activation, ceramide generation, and PP2A activation, and ameliorates hepatic steatosis in ethanol-fed mice. Am J Physiol- Gastr L. 2012;302(5):G515–23. doi: 10.1152/ajpgi.00455.2011. [DOI] [PMC free article] [PubMed] [Google Scholar]
- Lieber CS. Cytochrome P-4502E1: its physiological and pathological role. Physiol Rev. 1997;77(2):517–44. doi: 10.1152/physrev.1997.77.2.517. [DOI] [PubMed] [Google Scholar]
- Lieber CS. The discovery of the microsomal ethanol oxidizing system and its physiologic and pathologic role. Drug Metab Rev. 2004;36(3–4):511–29. doi: 10.1081/dmr-200033441. [DOI] [PubMed] [Google Scholar]
- Lieber CS, DeCarli LM. Ethanol oxidation by hepatic microsomes: adaptive increase after ethanol feeding. Science. 1968;162(3856):917–8. doi: 10.1126/science.162.3856.917. [DOI] [PubMed] [Google Scholar]
- Lieber CS, DeCarli LM. Hepatic microsomal ethanol-oxidizing system. In vitro characteristics and adaptive properties in vivo. J Biol Chem. 1970;245(10):2505–12. [PubMed] [Google Scholar]
- Lieber CS, DeCarli LM. The role of the hepatic microsomal ethanol oxidizing system (MEOS) for ethanol metabolism in vivo. J Pharmacol Exp Ther. 1972;181(2):279–87. [PubMed] [Google Scholar]
- Lieber CS, DeCarli LM. Liquid diet technique of ethanol administration: 1989 update. Alcohol Alcoholism. 1989;24(3):197–211. [PubMed] [Google Scholar]
- Lumeng L, Li TK. The development of metabolic tolerance in the alcohol-preferring P rats: comparison of forced and free-choice drinking of ethanol. Pharmacol Biochem Be. 1986;25(5):1013–20. doi: 10.1016/0091-3057(86)90079-1. [DOI] [PubMed] [Google Scholar]
- Lumeng L, Waller MB, McBride WJ, Li TK. Different sensitivities to ethanol in alcohol-preferring and -nonpreferring rats. Pharmacol Biochem Be. 1982;16(1):125–30. doi: 10.1016/0091-3057(82)90023-5. [DOI] [PubMed] [Google Scholar]
- Matson L, Grahame N. Pharmacologically relevant intake during chronic, free-choice drinking rhythms in selectively bred high alcohol preferring mice. Addict Biol. 2011 doi: 10.1111/j.1369-1600.2011.00412.x. [DOI] [PMC free article] [PubMed] [Google Scholar]
- McBride WJ, Li TK. Animal models of alcoholism: neurobiology of high alcohol-drinking behavior in rodents. Crit Rev Neurobiol. 1998;12(4):339–69. doi: 10.1615/critrevneurobiol.v12.i4.40. [DOI] [PubMed] [Google Scholar]
- Mello NK, Mendelson JH. Experimentally induced intoxication in alcoholics: a comparison between programed and spontaneous drinking. J Pharmacol Exp Ther. 1970;173(1):101–16. [PubMed] [Google Scholar]
- Morse RM, Flavin DK. The definition of alcoholism. The Joint Committee of the National Council on Alcoholism and Drug Dependence and the American Society of Addiction Medicine to Study the Definition and Criteria for the Diagnosis of Alcoholism. J Amer Med Assoc. 1992;268(8):1012–4. doi: 10.1001/jama.268.8.1012. [DOI] [PubMed] [Google Scholar]
- Murphy JM, Gatto GJ, Waller MB, McBride WJ, Lumeng L, Li TK. Effects of scheduled access on ethanol intake by the alcohol-preferring (P) line of rats. Alcohol. 1986;3(5):331–6. doi: 10.1016/0741-8329(86)90010-8. [DOI] [PubMed] [Google Scholar]
- Oberlin B, Best C, Matson L, Henderson A, Grahame N. Derivation and Characterization of Replicate High- and Low-Alcohol Preferring Lines of Mice and a High-Drinking Crossed HAP Line. Behav Genet. 2010;41(2):288–302. doi: 10.1007/s10519-010-9394-5. [DOI] [PMC free article] [PubMed] [Google Scholar]
- Ohnishi K, Lieber CS. Reconstitution of the microsomal ethanol-oxidizing system. Qualitative and quantitative changes of cytochrome P-450 after chronic ethanol consumption. J Biol Chem. 1977;252(20):7124–31. [PubMed] [Google Scholar]
- Rachamin G, MacDonald JA, Wahid S, Clapp JJ, Khanna JM, Israel Y. Modulation of alcohol dehydrogenase and ethanol metabolism by sex hormones in the spontaneously hypertensive rat. Effect of chronic ethanol administration. Biochem J. 1980;186(2):483–90. doi: 10.1042/bj1860483. [DOI] [PMC free article] [PubMed] [Google Scholar]
- Rodgers DA, McClearn G, Bennett EL, Hebert M. Alcohol preference as a function of its caloric utility in mice. J Comp Physiol. 1963;56:666–72. doi: 10.1037/h0040350. [DOI] [PubMed] [Google Scholar]
- Ronis MJ, Huang J, Crouch J, Mercado C, Irby D, Valentine CR, Lumpkin CK, Ingelman-Sundberg M, Badger TM. Cytochrome P450 CYP 2E1 induction during chronic alcohol exposure occurs by a two-step mechanism associated with blood alcohol concentrations in rats. J Pharmacol Exp Ther. 1993;264(2):944–50. [PubMed] [Google Scholar]
- Takahashi T, Lasker JM, Rosman AS, Lieber CS. Induction of cytochrome P-4502E1 in the human liver by ethanol is caused by a corresponding increase in encoding messenger RNA. Hepatology. 1993;17(2):236–45. [PubMed] [Google Scholar]
- You M, Considine RV, Leone TC, Kelly DP, Crabb DW. Role of adiponectin in the protective action of dietary saturated fat against alcoholic fatty liver in mice. Hepatology. 2005;42(3):568–77. doi: 10.1002/hep.20821. [DOI] [PMC free article] [PubMed] [Google Scholar]