
Figure 1. The frequency of gene mutations in samples obtained pre- and post-chemoradiation.
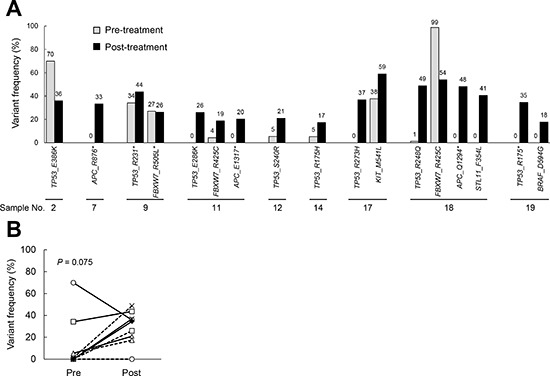
The gene mutation status was evaluated by DNA sequencing, and the frequencies were compared between paired pre- and post-treatment samples from nine non-responders. (A). The mutation frequency in the pre- and post-chemoradiotherapy tumors. (B). The changes in the frequency of TP53 mutations in the pre- and post-chemoradiation samples. Paired t-tests were used for the statistical analysis.