

Abstract
The pellagragenic effect of leucine (Leu) has been proposed to involve modulation of L-tryptophan (Trp) metabolism along the hepatic kynurenine pathway. Here, we discuss some of the mechanisms suggested and report the effects in healthy volunteers of single doses of Leu (4.05–6.75 g) administered in a 16-amino acid mixture on concentrations of plasma Trp and its kynurenine metabolites. Flux of Trp through Trp 2,3-dioxygenase (TDO) is dose-dependently enhanced most probably by Leu and can be attributed to TDO activation. Trp oxidation is better expressed using plasma total kynure-nines, rather than kynurenine, and free, rather than total, Trp. Increased hepatic Trp oxidation may be an additional mechanism of action of branched-chain amino acids in the acute Trp depletion test. Inhibition of intestinal absorption or hepatic uptake of Trp by Leu can be excluded. Potential mechanisms of the aggravation of pellagra symptoms by Leu are discussed.
Keywords: branched-chain amino acids, kynurenine pathway, leucine, pellagra, plasma free tryptophan, tryptophan 2, 3-dioxygenase
Introduction
Pellagra is a disease of many causes, including nutritional deficiencies, conditions of gastrointestinal dysfunction, alcoholism, and many drugs, all of which decrease the availability of nicotinic acid (niacin or vitamin B3).1 Niacin is present in many foods and also synthesized in the liver from the essential amino acid L-tryptophan (Trp) in the kynurenine pathway of Trp degradation (Fig. 1). This pathway accounts for >95% of total body Trp oxidation and is controlled by the first enzyme Trp 2,3-dioxygenase (TDO, formerly Trp pyrrolase).2,3 Assessment of activity of TDO and other enzymes of this pathway in humans has largely been made by measuring urinary kynurenine metabolites, because urinary levels far exceed those in plasma. However, with the advent of more sensitive methods for measuring the generally low plasma levels, more studies are now performed on plasma samples. Previous human studies of the kynurenine pathway in pellagra have recently been reviewed.1
Figure 1.

The hepatic kynurenine pathway of Trp degradation. This figure is an adaptation of Figures 1 and 2 from the review1 titled “Pellagra and alcoholism: a biochemical perspective” by Badawy, AA-B. Alcohol and Alcoholism 2014;49:238–50, published by Oxford University Press.
Existence on diets composed largely of maize or sorghum led to the incidence of pellagra in India, South Africa, Southern Europe during the 18th century, and the Southern USA during the American civil war.1 This is because of the low Trp content of these staples and failure to isolate the niacin bound to polysaccharides in the form of niacytin, which cannot be hydrolyzed by mammalian enzymes.1,2 The symptoms of pellagra (the three Ds: dermatitis, diarrhea, and delirium) are compounded by the presence in these staples of large amounts of the branched-chain amino acid (BCAA) leucine (Leu).1 Various mechanisms have been proposed to explain the pellagragenic effect of Leu4: activation of liver TDO and picolinate carboxylase and inhibition of kynureninase and quinolinate phosphoribosyltransferase.4–9 These effects may explain the decreased formation of quinolinic acid and nicotinamide nucleotides when dietary niacin intake is marginal9 and the increased urinary excretion of kynurenine, 3-hydroxykynurenine (3-HK), kynurenic acid, and xanthurenic acid (XA) in pellagra patients.10 Excess dietary Leu may also inhibit hepatic uptake4 and intestinal absorption11 of Trp.
Studies of these mechanisms have been conducted in vitro, in isolated hepatocytes, and intact animals, or in pellagrins in association with other nutritional deficiencies that exert major effects on this pathway. Investigation of the effects of Leu on plasma Trp and kynurenine metabolites in normal subjects has not been performed and may therefore throw further light on these mechanisms in the absence of dietary deficiencies. An opportunity has arisen for such investigation from our previous study of the specificity of the acute Trp depletion (ATD) test, a powerful diagnostic tool for assessing the role of the cerebral indolylamine serotonin in behavioral and other disorders.12 The ATD test involves administration of an amino acid mixture lacking in Trp, but rich in the three BCAAs Leu, Ile, and Val. BCAAs and also Phe and Tyr compete with one another and with Trp for entry into the brain and so inhibit serotonin synthesis during the ATD test. Stimulation of protein synthesis by the essential amino acids used (especially Leu; see the Discussion) contributes to the Trp depletion. As a control, a similar formulation supplemented with Trp is used. The ATD formulation, however, lacks specificity because of the large content of BCAAs12 (see below). Specificity of the control formulation has been improved by decreasing the content of the three BCAAs by 40%, from the traditional ~30% to 18%.13
In the present study, we have compared aspects of Trp metabolism and disposition and plasma kynurenine metabolites in four groups of normal healthy volunteers receiving the ATD control formulation with varying amounts of BCAAs, and we were able to demonstrate enhanced Trp oxidation along the kynurenine pathway, despite the added effects of the moderate Trp load.
Subjects and Methods
Subjects
Subjects of this study were the 48 USA healthy volunteers who took part in our previous investigation of the specificity of the control formulation for the ATD test.13 Subjects were recruited by DMD during his professorial tenure at Wake Forest University Health Sciences Center, NC, USA. Subjects were divided into four groups (n = 12 each) matched for age, gender, and ethnicity (Caucasians and African Americans). The phase of the menstrual cycle was not considered in this study, but the gender distribution was uniform across groups, and analysis of Trp and other parameters in our previous study13 revealed no gender effects. Recruitment, health screening, inclusion and exclusion criteria, and ethical approval by the institutional review board of Wake Forest University have all been described.13 This research complied with the principles of the Declaration of Helsinki, and participants gave their written, informed consent to participate in the study.
Design
This was a double-blind study. After an overnight fast, subjects were allocated to one of four groups to receive a suitably flavored drink containing 51.25 g of a mixture of 16 amino acids with varying BCAA content. This mixture is based on the original control formulation of Young et al.14 for the ATD test. Briefly, in addition to the three BCAAs, the mixture included the other three brain uptake competitors Trp, Tyr, and Phe, and 10 other (non-competing) amino acids. Table 1 gives the content of each of the six competitors and the sum of the 10 non-competitors. The latter are summed here for brevity, but are listed elsewhere.13 As can be seen from Table 1, the four groups received one of four formulations (a between- rather than a within-group design to reduce participant burden and attrition): the original control formulation of Young et al.14 (F0) or three other formulations containing 20% (F1), 30% (F2), and 40% (F3) less BCAAs, and the resulting differences were compensated for by proportionate increases in the content of each of the other 10 amino acids. Blood samples from all subjects were obtained before and at hourly intervals for 7 hours after oral consumption of the amino acid mixtures. Participants remained fasting throughout the ~7-hour study duration, following which they received a Trp-balanced meal. Other details have been described.13
Table 1.
Composition of the amino acid formulations.
| AMINO ACID (G) FORMULA …. | F0 | F1 | F2 | F3 |
|---|---|---|---|---|
| % DECREASE IN BCAA …. | 0% | −20% | −30% | −40% |
| Trp | 1.15 | 1.15 | 1.15 | 1.15 |
| Phe | 2.85 | 2.85 | 2.85 | 2.85 |
| Tyr | 3.45 | 3.45 | 3.45 | 3.45 |
| Leu | 6.75 | 5.40 | 4.73 | 4.05 |
| Val | 4.55 | 3.64 | 3.19 | 2.72 |
| Ile | 4.00 | 3.20 | 2.80 | 2.40 |
| Other amino acids (n = 10) | 28.50 | 31.55 | 33.09 | 34.62 |
| Total amino acids (g) | 51.25 | 51.25 | 51.25 | 51.25 |
| Leu content (%) | 13.17 | 10.54 | 9.23 | 7.90 |
| Average Leu dose (mg/kg) | 96 | 77 | 68 | 58 |
Laboratory procedures
Fasting plasma samples were isolated in ethylene diamine tetra-acetic acid (EDTA) tubes and frozen at −80 °C until transported in the frozen state to Cardiff, UK, for analysis. Plasma ultrafiltrates for free (non-albumin-bound) Trp determination were prepared15 from fresh plasma before freezing, as frozen storage of plasma decreases free [Trp]. Concentrations of plasma free and total Trp, kynurenine, and five of its metabolites (3-HK, 3-hydroxyanthranilic acid, kynurenic acid, XA, and anthranilic acid) were determined by high-performance liquid chromatography (HPLC) with ultraviolet and fluorimetric detection.16
Expressions of results
Four parameters are expressed in absolute concentrations (μM), namely, plasma free and total Trp, kynurenine, and total kynurenines. Total kynurenines include kynurenine, kynurenic acid, XA, anthranilic acid, and 3-hydroxyanthranilic acid. A number of expressions are then derived from these four parameters. These are: (1) the percentage free Trp (100 × [free Trp]/[total Trp]), which is an established expression of Trp binding to albumin; (2) TDO activity (100 × [kynurenine]/[total Trp]); (3) TDO activity relative to free Trp (TDOF) (100 × [kynurenine]/[free Trp]); (4) total Trp oxidation (TTOX) (100 × [total kynurenines]/[total Trp]); (5) total Trp oxidation relative to free Trp (TTOXF) (100 × [total kynurenines]/[free Trp]).
Statistical analysis
Results were analyzed by one-way randomized block analysis of variance (ANOVA) using SPSS (Version 21, IBM Corporation) or Sigma Plot version 11 (Systat, UK), with which graphics were prepared. For multiple group comparisons, the Holm–Sidak test is recommended as the first line procedure, as it is more powerful than the Tukey or Bonferroni tests and can be used for pairwise comparisons and those versus a control group. When data failed Mauchly’s test of sphericity, Greenhouse–Geisser corrections were used to produce a conservative correction. In addition to within-group comparisons with zero-time values, most of the between-group comparisons presented were between data from the F0 group (with the largest BCAA dose) and those from the F3 group (the lowest BCAA dose) as control.
Results
In the results presented below, the sum of the total kynurenines does not include 3-HK, because values obtained by our procedure16 are generally higher than those reported in the literature. However, the absence of 3-HK from the sum rep-resents a conservative underestimate of the relevant effects observed. Also in the presentation of the results, where there are no clear BCAA dose-dependent differences, only data from the F0 (Leu and BCAA contents: 6.75 g and 15.35 g, respectively) and F3 (4.05 g and 9.17 g, respectively) groups are presented for graphic clarity and illustration of the potential level of changes caused by the highest, versus the lowest, doses of Leu and BCAA.
Baseline parameter means
Table 2 gives the baseline fasting mean values of the various parameters studied for all 48 subjects.
Table 2.
Baseline mean values of various parameters in the 48 subjects.
| PARAMETER | EXPRESSION | MEAN | SEM |
|---|---|---|---|
| Free Trp | μM | 4.78 | 0.22 |
| Total Trp | μM | 43.5 | 2.65 |
| % Free Trp | 100 × [Free Trp]/[Total Trp] | 10.99 | 0.75 |
| Kynurenine | μM | 1.28 | 0.29 |
| TDO | 100 × [Kynurenine]/[total Trp] | 2.94 | 0.26 |
| TDOF | 100 × [Kynurenine]/[Free Trp] | 26.78 | 1.91 |
| Total kynurenines | μM | 4.22 | 0.69 |
| TTOX | 100 × [Total kynurenines]/[Total Trp] | 9.70 | 1.78 |
| TTOXF | 100 × [Total kynurenines]/[Free Trp] | 88.28 | 11.89 |
Abbreviations: TDO, Trp 2,3-dioxygenase relative to total Trp; TDOF, Trp 2,3-dioxygenase relative to free Trp; TTOX, total Trp oxidation relative to total Trp; TTOXF, total Trp oxidation relative to free Trp.
Effects of BCAAs on plasma free and total Trp concentrations and Trp binding
As subjects in all four groups received a similar dose of Trp (1.15 g), both plasma free [F(2.706, 119.084) = 99.769, P < 0.0001] and total [Trp] [F(2.176, 95.738) = 140.087, P < 0.0001] were increased significantly over time (P = 0.030–0.001), reaching a maximum at 2–3 hours and returning to normal values by 6 hours. Multiple group comparisons for free Trp showed an overall significance only at 3 hours (H = 8.458, 3; P = 0.037). The time course of changes in free Trp in groups F0 and F3 is shown in Figure 2A. After the initial 2 hours, the decrease in free Trp was somewhat faster in the F0, than the F3, group, with a significant difference at 3 hours (F = 8.090, 1; P = 0.009). By contrast, total Trp did not differ significantly between groups, with values for the F0 and F3 groups shown in Figure 2B.
Figure 2.
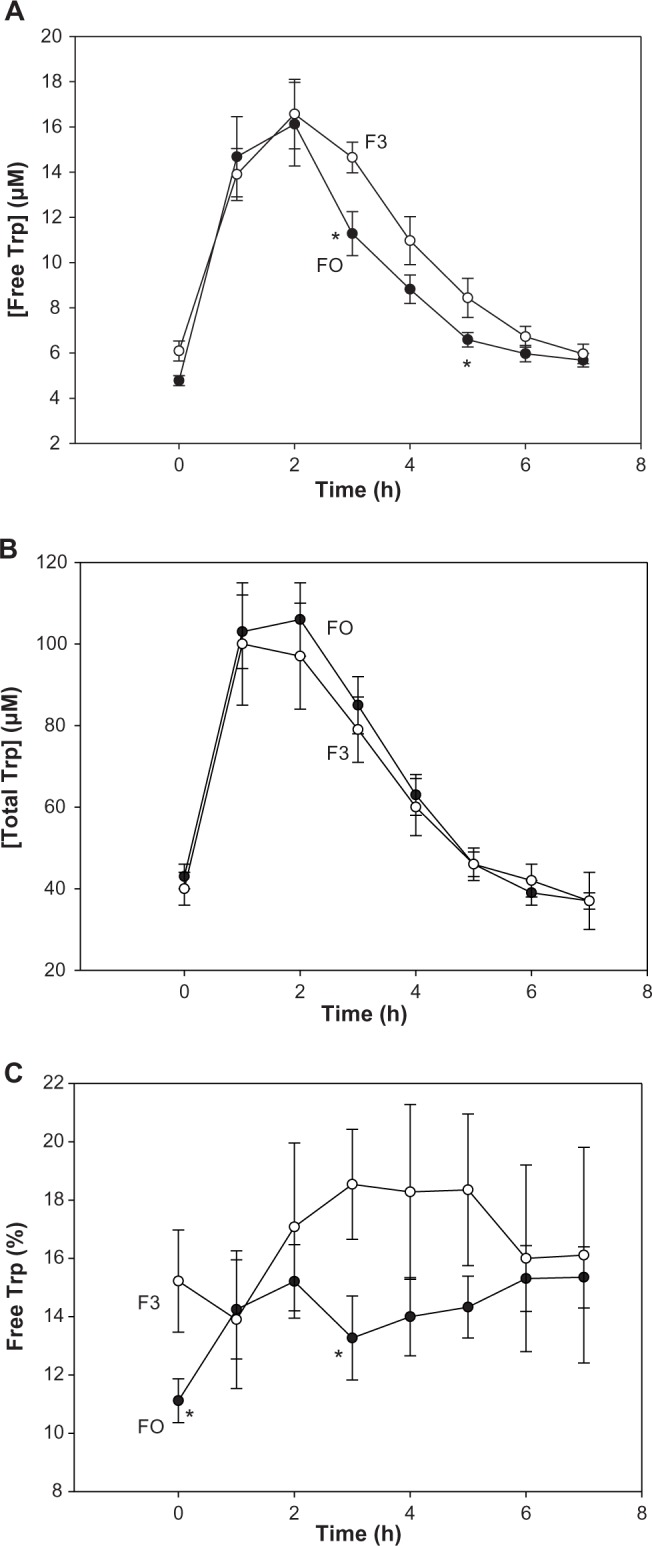
Time-course of the effects of BCAAs on plasma free and total Trp concentrations and Trp binding in normal subjects. Fasting volunteers received a 16-amino acid mixture at two BCAA dose levels: 15.35 g (group F0) and 9.17 g (group F3). These correspond to Leu doses of 6.75 g and 4.05 g, respectively. Plasma samples were analyzed before and at hourly intervals for 7 hours after oral consumption of each mixture for free Trp (A), total Trp (B), and the %free Trp (C). Analytical and other details are described in the Subjects and methods section. Values are means ± SEM (bars) for 12 subjects in each group, and the significance of differences is described at the relevant points in the text. The asterisk denotes significant differences in the F0 group relative to the F3 group (P = 0.043–0.009).
The percentage free Trp, an expression of Trp binding to albumin, was altered as a result of the above changes in [free Trp]. As shown in Figure 2C, the %free Trp was generally lower in the F0, compared with the F3, group, suggesting that albumin-binding sites were saturated with Trp in F3, leading to an overspill of free Trp, presumably because Trp degradation was faster in F0. The fact that enhanced Trp oxidation by TDO normally leads to proportionate decreases in free and total [Trp] without influencing Trp binding to albumin (see the Discussion below) supports this interpretation. As was the case for free Trp, the difference in the %free Trp between F0 and F3 was significant at 3 hours (H = 6.549, 1; P = 0.018). Overall, group comparisons showed a trend toward significance (P = 0.058) also only at 3 hours.
Effects of BCAAs on plasma kynurenine and expressions of liver TDO activity
Plasma [kynurenine] rose significantly with time in all four groups [F(5.030, 221.334) = 22.790, P < 0.0001], as a result of acute Trp load leading to increased flux of Trp through TDO. The kynurenine elevation was significant at all times in the F0 group, but up to 5 hours in the F1 and up to 4 hours in the F2 and F3 groups. However, plasma [kynurenine] did not differ significantly between groups at any time point during the 7-hour experimental duration. This lack of difference is exemplified in Figure 3A comparing the F0 and F3 groups.
Figure 3.
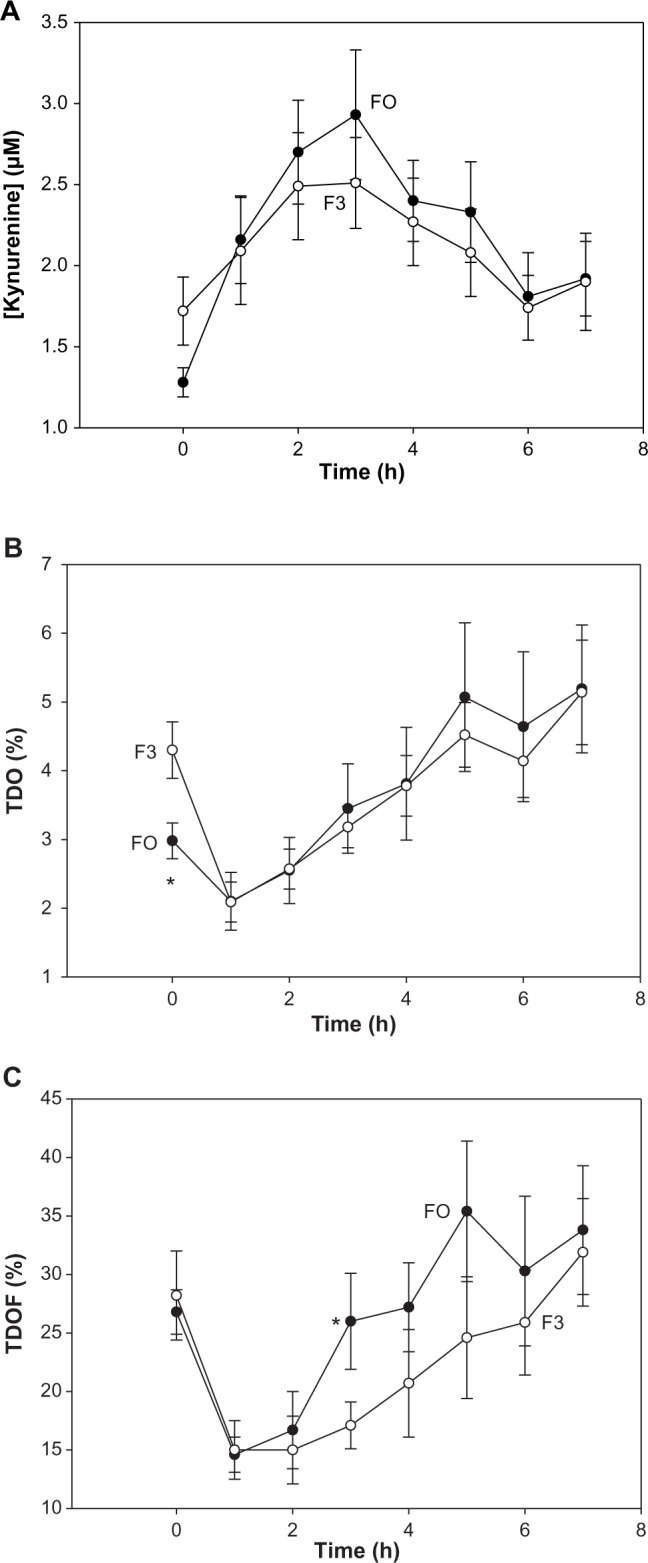
Time-course of the effects of BCAAs on plasma kynurenine concentration and expressions of TDO activity in normal subjects. Details are as described in Figure 2. TDO activity is expressed in two ways, as described in Table 2. Values for kynurenine (A), TDO (B), and TDOF (C) are means ± SEM for 12 subjects in each group. The asterisk denotes significant differences in the F0 group relative to the F3 group (P = 0.007–0.009).
Liver TDO activity is expressed by the plasma [kynurenine]/[total Trp] ratio percentage. A decrease in this expression was observed at 1 hour, but is of no significance, as it is because of the increase in [Trp] following Trp loading. The increase in TDO activity in the F0 group was significant from 4 hours onward, whereas that in the other three groups was transient, occurring only at 3 or 6 hours. As was the case for [kynurenine], no significant group differences in TDO were observed, as illustrated in Figure 3B for the F0 and F3 groups.
A new expression of TDO activity was made relative to [free Trp] (TDOF). Here, there were also no significant differences within or between groups, except that, at 3 hours, the F0 and F3 TDOF means were significantly different (H = 4.675, 1; P = 0.039). There were significant changes in TDOF over time [F(3.912, 172.132) = 14.449, P < 0.0001]. The time-course of changes in TDOF in these two groups is shown in Figure 3C.
Effects of BCAAs on plasma concentrations of kynurenines and expressions of total Trp oxidation (TTOX)
As was the case with [kynurenine], [total kynurenines] were also elevated significantly [F(4.301, 189.232) = 8.698, P < 0.0001] and maximally at 2–3 hours in all groups. However, unlike the former, the elevation of [total kynurenines] was dose dependent for all four doses of the BCAAs, with the elevation order of groups being F0 > F1 > F2 > F3 (Fig. 4A). Multiple group comparisons showed overall significant differences at 2, 3, and 4 hours (P = 0.023–0.0048). Groups F0 and F3 differed significantly at 1, 2, 3, and 4 hours (P = 0.024–0.008). In data not shown, individual kynurenine metabolites were also similarly elevated in line with their sums.
Figure 4.
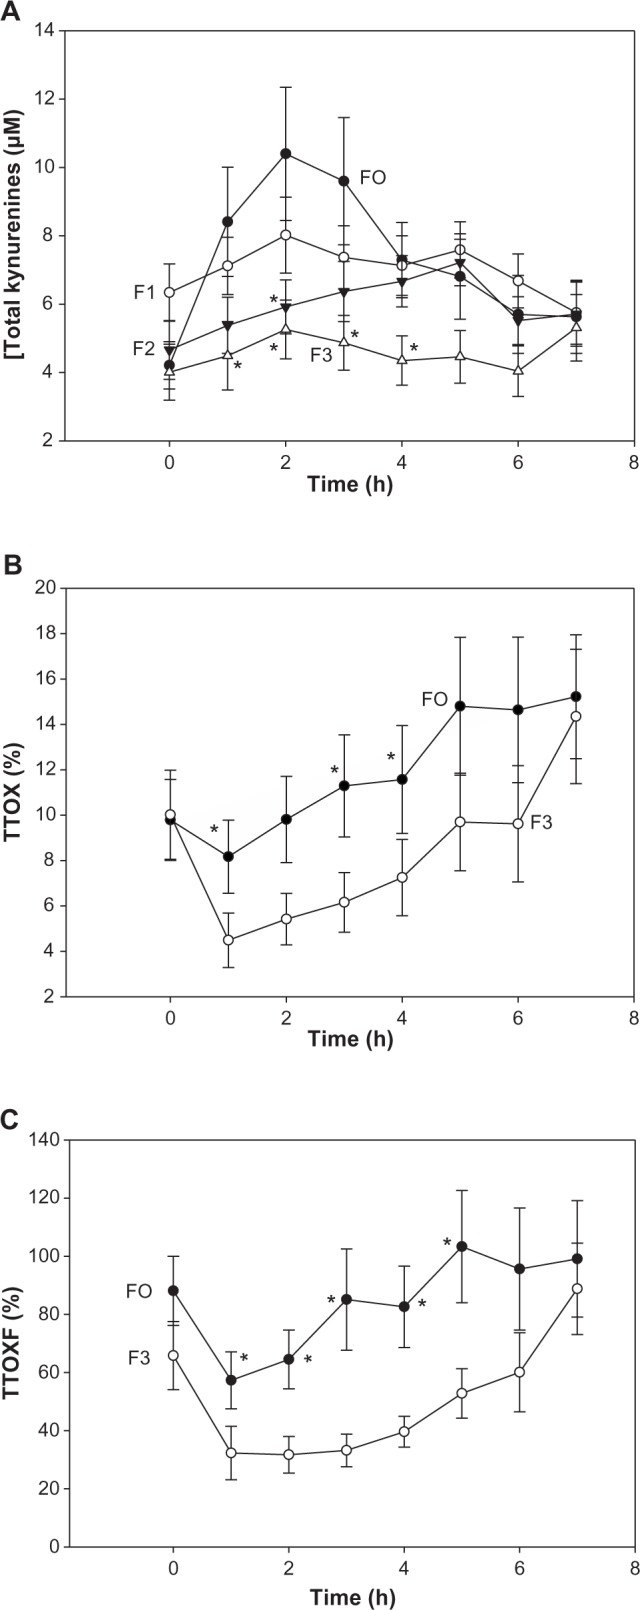
Time-course of the effects of BCAAs on plasma concentrations of total kynurenines and expressions of total Trp oxidation (TTOX) in normal subjects. Details are as described in Figure 2, except that total kynurenines (A) were determined in groups F0 and F3 and additionally in groups F1 and F2 receiving intermediate BCAA doses as in Table 1. TTOX (B and C) is expressed in two ways as described in Table 2. Values are means ± SEM for 12 subjects per group. The asterisk denotes significant differences in the F0 group relative to the F3 group (P = 0.007–0.009) for TTOX and TTOXF, whereas for total kynurenines, the asterisk denotes significant differences relative to the F0 group (P = 0.05–0.002).
Two new expressions of total Trp oxidation (TTOX) were attempted: TTOX relative to [total Trp] and TTOXF relative to [free Trp]. TTOX did not show overall significant group differences, except at 5 hours (H = 8.383, 3: P = 0.039). However, there were significant differences over time [F(2.210, 97.235) = 10.722, P < 0.0001], and comparison of the F0 and F3 groups (Fig. 4B) showed significant differences at 1, 3, and 4 hours (P = 0.050–0.038). More remarkable differences were observed with TTOXF. Here, multiple group comparisons showed significant group differences at 1–5 hours (P = 0.05–0.011), with differences between groups F0 and F3 (Fig. 4C) being significant also at 1–5 hours (P = 0.033–0.005).
Comparison of areas under the curves for parameters with significant group differences
To further assess the significance of differences in parameters between the F0 and F3 groups, analyses of areas under the curves (AUC) were performed on all subjects in these two groups. The results averaged in Table 3 show that for [free Trp], the 17% lower AUC for F0 was not significant, whereas the 22% lower %free Trp in F0 was. The 20% higher TDOF (TDO activity expressed relative to free Trp) in F0 was not significant. Total kynurenines were significantly higher in F0, by 65%. The AUC for total Trp oxidation expressed relative to total Trp (TTOX) or to free Trp (TTOXF) showed two subjects in each group with either very low or very high values, and these were omitted from the analysis. AUC for the remaining 10 subjects in each group showed significantly and similarly higher values in F0 (139% for TTOX and 145% for TTOXF), compared to F3. For other parameters showing no significant group differences, AUC measurements also showed no significant differences.
Table 3.
Comparison of AUC between the F0 and F3 groups for parameters with significant differences.
| GROUP … | FO | F3 | % DIFFERENCE | |||
|---|---|---|---|---|---|---|
| PARAMETER | MEAN | SEM | MEAN | SEM | AGAINST F3 | P |
| Free Trp (μM) | 63.9 | 7.0 | 77.3 | 4.0 | −17% | 0.117 |
| % Free Trp | 104.7 | 6.8 | 133.3 | 12.7 | −22% | 0.038 |
| TDOF (%) | 194 | 22 | 161 | 20 | +20% | 0.291 |
| Kynurenines (μM) | 53.1 | 8.9 | 32.1 | 5.3 | +65% | 0.024 |
| TTOX (%) | 102 | 15 | 43 | 3 | +137% | 0.002 |
| TTOXF (%) | 685 | 34 | 280 | 34 | +145% | 0.001 |
Notes: AUC were determined for each subject using the Sigma Plot statistical program, and group differences were assessed by repeated measures ANOVA. Values are means ± SEM for 12 subjects per group for the first four parameters, but only 10 subjects per group for TTOX and TTOXF.
Discussion
Mechanisms of the pellagragenic effect of Leu
Based on studies in rat liver preparations in vitro, isolated rat hepatocytes, and intact rats in vivo, with very few in pellagrins and normal humans, excessive dietary Leu has been suggested4–11 to induce or aggravate pellagra by six mechanisms: activation of liver (1) TDO and (2) picolinate carboxylase, inhibition of (3) kynureninase and (4) quinolinate phosphoribosyltransferase, and of (5) hepatic Trp uptake, and (6) intestinal Trp absorption. Although we have addressed mainly hepatic Trp oxidation by TDO in normal humans, it is important to discuss first the other mechanisms.
Studies in vitro
The concentrations of Leu (1–10 mM) required for inhibition of intestinal Trp absorption in rats11 and that (7.6 mM) for inhibition of kynureninase activity in rat liver preparations9 are unlikely to be of significance in vivo in humans, because basal fasting plasma [Leu] (in normal USA subjects of both genders: 109 ± 3 μM, mean ± SEM for n = 114)17 is increased maximally by oral Leu doses of 5.0–13.5 g to values of 204–843 μM.13,17–19 In subjects of the present study, we reported13 maximal elevations in plasma [Leu] to 486 ± 76 μM in the F0 group (Leu dose: 6.75 g: ~96 mg/kg body wt) and 355 ± 42 μM in F3 (Leu dose: 4.05 g: ~58 mg/kg body wt). Thus, under our experimental conditions, elevation of plasma [Leu] does not reach 500 μM with Leu doses of up to 13.5 g, or ~193 mg/kg body wt. Plasma [Leu] in normal humans after Leu loading therefore rises to values generally below 500 μM and certainly <1 mM. As discussed below, kynureninase inhibition occurs in vivo in pellagrins and Leu-treated rats by a mechanism other than the competitive one suggested.9
Studies in isolated rat hepatocytes
Trp uptake by isolated rat hepatocytes4 is inhibited by Leu at 0.5 mM and above, with 5 mM causing only a 37% inhibition. This moderate inhibition reflects quantitatively a decreased flux of Trp through TDO. These high [Leu] are also unlikely to be reached in vivo, and in fact, these authors4 demonstrated increased flux of Trp through TDO and subsequent steps of the kynurenine pathway in hepatocytes from rats maintained on a high-Leu (15 g/kg) diet.
Studies in intact rats in vivo and in pellagrins
Average intake of the above diet (15 g of Leu/kg) corresponds to a Leu dose (~1.5 g/kg) that raises rat blood [Leu] to 1 mM.20 With this dosage,7 the flux of Trp through kynureninase (estimated from a tracer dose of methylene-labeled 14C-Trp) is inhibited, whereas that through picolinate carboxylase (estimated using uniformly labeled benzene ring U-14C-Trp) is enhanced, thus suggesting inhibition of the former, but activation of the latter, enzyme. Both effects can adequately explain the previously reported decreased synthesis of nicotinamide dinucleotides. Flux of U-14C-Trp through picolinate carboxylase has also been demonstrated by others in intact rats in vivo5 and hepatocytes isolated from high Leu-fed rat,4 but, as pointed out,4 the major source of flux of Trp through picolinate carboxylase may be the kidney, which is a richer source of this enzyme than the liver. Inhibition of this flux by 2 mM Leu added to hepatocytes from normal rats (not high Leu-fed)4 may not be physiologically significant.
The kynureninase inhibition demonstrated in rats using methylene 14C-Trp7 may also occur in pellagrins, evidenced indirectly from increased urinary excretion of 3-HK and XA.10,18 Levels of this transamination product (XA) and of kynurenic acid (Fig. 1) rise when there is an increased flux of Trp down the kynurenine pathway after acute Trp loading or enhanced TDO activity and also after kynurenine loading or kynureninase inhibition.1–3 Kynureninase inhibition in pellagrins has been suggested10 to involve decreased activity of the pyridoxal 5′-phosphate transamination cofactor secondarily to pyridoxine deficiency. Indeed plasma pyridoxal 5′-phosphate levels are significantly lower in pellagrins than in controls.18 Leu may also inhibit kynureninase by a similar (functional vitamin B6 deficiency) mechanism. Leu is metabolized initially by BCAA aminotransferase (BCAT). Excessive dietary Leu intake could thus result in depletion of pyridoxal phosphate. BCAT activity in rat liver is undetectable or at best <1% of total body enzyme activity,21,22 but is expressed in human liver,23 wherein its activity is 7.7–11% of total body activity.24,25 The absence of BCAT from rat liver explains the absence of inhibition of Trp flux through kynureninase in hepatocytes from Leu-fed rats.4 However, in the whole animal, inhibition of kynureninase flux by high-Leu diets7 is most likely the result of pyridoxal phosphate depletion by the widely distributed BCAT. Depletion of this cofactor can also explain the low Leu tolerance in pellagrins following an acute Leu load and its normalization by single or repeated pyridoxine intake.18 Measurement of plasma and/or tissue pyridoxal phosphate after Leu treatment should be made in future studies. Whereas kynureninase inhibition in pellagrins causes the increased urinary excretion of 3-HK and XA, the associated rise in urinary kynurenic acid may be caused by elevation of kynurenine by TDO activation, the mechanism of which was proposed10 to involve decreased feedback inhibition by NADPH following niacin depletion.
Relevance of the present results
It is important first to emphasize that BCAAs are metabolized differently in rodents and humans, hence the need for cautious extrapolation from rats to humans. For example, rats metabolize BCAAs faster than humans, with BCAT activity in human tissues being only 10% of that in the corresponding rat tissues.24 The similarly higher BCKA dehydrogenase in rat tissues will additionally promote further transamination of BCAAs. However, this does not suggest that the similar changes in Trp metabolism in Leu-treated rats and pellagrins are caused by different mechanisms.
In the present study, the highest dose of Leu in F0 (6.75 g or on average ~96 mg/kg body wt) is considerably smaller than that administered to rats (~1.5 g/kg; see above), and it is therefore unclear if it is capable of depleting pyridoxal 5′-phosphate. Plasma 3-hydroxyanthranilic acid (the product of the kynureninase reaction) was higher, rather than lower, in F0, compared to F3, and other kynurenines were similarly elevated with increasing doses of Leu (data not shown). Although this suggests that the Leu doses used here do not inhibit kynureninase activity, inhibition cannot be ruled out if the flux of exogenously administered Trp could have had a mitigating effect.
Effects of Leu on hepatic tryptophan oxidation
Role of Leu
The present results (Figs. 2–4) are the first to demonstrate that BCAAs enhance Trp oxidation along the hepatic kynurenine pathway in normal subjects. This enhancement is most likely mediated by Leu, as it is the dominant BCAA in the formulations. Neither Val nor Ile influences rat liver TDO activity26 in doses (316–353 mg/kg) far greater than those given here to F0 subjects (~65 and 57 mg/kg respectively). Also, a large (30 g) Val dose does not modulate plasma [Trp] in healthy volunteers,27 thus excluding an effect on Trp clearance (degradation). Of 15 amino acids other than Trp given acutely to rats in the above study,26 only methionine (Met) activated TDO at a dose (400 mg/kg) considerably higher than those used in the present study (21 mg/kg in F0 and 26 mg/kg in F3). Met can also be excluded. Furthermore, Leu administration decreases plasma Val and Ile, whereas neither of these latter two amino acids lowers plasma [Leu].20 Leu also undergoes strong hepatic extraction.28 Taken together, it can be reasonably concluded that the increased production of kynurenines is caused by Leu.
Enhanced tryptophan oxidation
The Leu enhancement of Trp oxidation along the kynurenine pathway (Figs. 3 and 4) could involve a simple increase in the flux of Trp down the pathway or activation of the first enzyme TDO. A 50 mg/kg dose of Trp does not activate liver TDO.29 The Trp dose used in the present work (1.15 g or ~16 mg/kg) is much smaller, but undergoes flux down the pathway in all four groups, as demonstrated in the time-course experiments (Figs. 3 and 4). The dose-dependent increase in plasma kynurenines (Fig. 4A) therefore suggests that the increased flux is because of Leu. Increased flux through TDO has previously been demonstrated4 in hepatocytes isolated from high Leu-fed rats. These authors4 suggested that the increased flux is because of TDO activation, as the ratio of TDO activity to flux was also increased in parallel. TDO activation is therefore likely in the present study, though its mechanism(s) is difficult to ascertain. Thus, the absence of increase in TDO activity by addition of Leu in vitro to cell-free preparations from normal rat hepatocytes4 or after administration to rats of a 350 mg/kg dose26 excludes a direct effect of Leu. Removal of the NADPH-mediated feedback inhibitory control of TDO, proposed in pellagrins,10 is a likely explanation, but cannot be demonstrated, because of a potential reversal of NADPH depletion by the administered Trp. The possible role of the Leu metabolite 4-methyl-2-oxovalerate in the increased flux of Trp through TDO in hepatocytes from high Leu-fed rats by virtue of displacing Trp from plasma albumin-binding sites, thereby increasing its availability to the liver, has been ruled out4 and is also unlikely in the present work, as plasma free [Trp] was lower in the F0 group receiving the largest dose of Leu (Fig. 2A). However, the observed increase in plasma kynurenines cannot be solely because of kynureninase inhibition and together with the longer duration of the kynurenine elevation in the F0 group suggest that TDO activity is enhanced by Leu by an as yet unidentified mechanism(s). One potential remaining mechanism is that of Leu enhancing TDO synthesis. Leu plays a major role in protein synthesis,30 and in fact, the use of Leu (BCAA) in the ATD test is in part to stimulate protein synthesis to promote further the desired depletion of Trp.14 We suggest that an additional mechanism of this depletion during the ATD test involves Leu enhancing hepatic Trp oxidation.
Expressions of tryptophan oxidation and the role of plasma free tryptophan and total kynurenines
TDO activation (leading to increased Trp oxidation) normally results in proportionate decreases in both plasma free and total [Trp], without altering Trp binding (expressed as the %free Trp).31 However, it is not possible to demonstrate this simple relationship in the presence of exogenously administered Trp. Nevertheless, it is possible to conclude that TDO is more activated in F0 than in F3. Thus, whereas total [Trp] was not significantly different between groups, free [Trp] was at 3 hours (Fig. 2). Trp loading saturates the plasma albumin-binding sites and the higher %free Trp in F3 compared to F0 (Fig. 2C), despite the same Trp dose, suggests that the larger Leu dose in the latter group accelerated free Trp clearance.
Changes in TDO activity can also be deduced from an increase in plasma [kynurenine] resulting in elevation of the [kynurenine]/[Trp] ratio. Kynurenine, however, undergoes a large renal clearance,32,33 and only after robust TDO induction (or Trp or kynurenine loading) could its plasma levels exceed its rate of renal clearance. The absence of significant group differences in plasma kynurenine (Fig. 3A) or the [kynurenine]/[total Trp] ratio (Fig. 3B) may be because of the influence of the Trp load and renal clearance, but does not exclude TDO activation, which is suggested by the significant elevation of the [kynurenine]/[total Trp] ratio in F0 at 5–7 hours (Fig. 3B) and by the significant increase at 3 hours in the [kynurenine]/[free Trp] ratio in F0 compared to F3 (Fig. 3C).
Using free Trp and total kynurenines may provide more sensitive expressions of TDO activity and Trp oxidation (flux) than total Trp and kynurenine, at least in certain circumstances, eg, when the Trp flux through TDO is enhanced in the absence of an apparent or robust increase in TDO activity. Thus, a clear dose-dependent elevation of [total kynurenines] was observed (Fig. 4A), with the increase in F0 being significant over the first 5 hours. As a result, the [total kynurenines]/[total Trp] and [total kynurenines]/[free Trp] ratios were significantly higher in F0 compared with F3 over the first 5 hours (Fig. 4B and C). These two expressions also showed the greatest significance in their AUC, followed by [total kynurenines] (Table 3). Changes in free Trp have been shown34 to modulate the Trp flux through TDO in rat hepatocytes. Thus, the use of plasma free Trp and total kynurenines may provide more sensitive indices of Trp oxidation.
Role of Leu in clinical features of pellagra
Pellagra is defined as the disease of the three Ds, namely diarrhea, dermatitis, and dementia (or more appropriately delirium).1 Aggravation of pellagra symptoms by Leu can be attributed to the consequences of its metabolism and its effects on Trp metabolism. Leu transamination by BCAT results in conversion of 2-oxoglutarate to glutamate. Leu is therefore a nitrogen donor for synthesis of this excitatory amino acid and the inhibitory neurotransmitter GABA (γ-aminobutyric acid). As discussed previously,1 activation of the N-methyl-d-aspartate (NMDA) type of glutamate receptors and enhancement of GABAergic neurotransmission may be involved in the neurological features of pellagra, particularly anxiety and psychosis. The decrease in pyridoxal 5′-phosphate resulting from Leu transamination can add further to the vitamin B6 deficiency of pellagra and thereby aggravate the skin features. Enhanced Trp oxidation down the kynurenine pathway by Leu can also contribute to the aggravation of pellagra symptoms. Thus, increased hepatic Trp oxidation, increased Trp utilization for protein synthesis, and competition for cerebral Trp uptake by Leu can all induce a decrease in Trp entry into the brain and a consequent inhibition of serotonin synthesis, which may explain the depressive symptoms. Elevation of plasma kynurenine and the consequent increase in kynurenic acid resulting from the enhanced flux of Trp through TDO by Leu can contribute further to the skin photosensitivity and the anxiety and psychotic features.1
Limitations of the present study
Although this study addresses specifically hepatic Trp metabolism initiated by TDO, we believe that any likely role of the extrahepatic Trp-degrading enzyme indolylamine 2,3-dioxygenase (IDO), though cannot be excluded, can only be marginal under our experimental conditions in normal subjects, because the combined extrahepatic tissue activity of IDO is 5–15%, with the latter upper limit applicable to the richest source, the placenta.35,36 We also recognize that elevation of plasma kynurenine metabolite levels in our study cannot be attributed solely to actions of enzymes of the hepatic kynurenine pathway, but may involve additionally enzymes in kidney and other tissues. Also, while renal handling of kynurenine is an important determinant of plasma kynurenine, production of this Trp metabolite is most likely achieved mainly in the liver. Another limitation is lack of standardization of dosage of the ATD test and control formulations to take account of body weight. This has been the case since the test was used in humans in 1985. However, more recently,37 the use of the test in adults according to body weight has been proposed, as has previously been the case in children. Finally, we did not include values for 3-HK in our calculation of total kynurenines, because our baseline fasting 3-HK values16 (before Leu administration) are far greater than those in the literature (for a comprehensive review, see ref. 38). A discussion of this variance is outside the scope of this paper, but requires critical appraisal of methodology and development of quantitative techniques to measure 3-HK metabolites in addition to the free form. However, the absence of 3-HK from our data could only have minimized the observed group differences in total kynurenines.
Conclusions
In conclusion, we have demonstrated enhanced flux of Trp through TDO by moderate doses of Leu in normal humans that is consistent with the reported4 enhancement in isolated hepatocytes from rats maintained on a high-Leu diet. This increased flux and elevation of kynurenines can be attributed provisionally to TDO activation by the relatively moderate doses of Leu used. Mechanisms such as impaired intestinal absorption or hepatic uptake of Trp can be excluded. Inhibition of kynureninase by excessive dietary Leu intake in the presence of vitamin B6 deficiency is likely to be the major mechanism of the pellagragenic effect of Leu and its metabolism, and its effects of Trp degradation may aggravate the clinical features of pellagra.
Acknowledgments
DMD gratefully acknowledges support from the William and Marguerite Wurzbach Distinguished Professorship. We thank Dawn M. Richard for recruitment of subjects and organization of the study part in the USA and A. Steptoe and S. Khatun for technical assistance in the UK.
Footnotes
FUNDING: This study was funded by grants from the USA National Institutes of Health (NIH) (R01-AA012046, RO1-AA014988, and T32-AA07565) to DMD. SLL was supported by an NIH training grant (T32-DA031115). The Wellcome Trust funded the equipment used in this study through Project grant 069301 to AA-BB. DMD receives funding through the William and Marguerite Wurzbach Distinguished Professorship. The authors confirm that the funder had no influence over the study design, content of the article, or selection of this journal.
Paper subject to independent expert blind peer review by minimum of two reviewers. All editorial decisions made by independent academic editor. Upon submission manuscript was subject to anti-plagiarism scanning. Prior to publication all authors have given signed confirmation of agreement to article publication and compliance with all applicable ethical and legal requirements, including the accuracy of author and contributor information, disclosure of competing interests and funding sources, compliance with ethical requirements relating to human and animal study participants, and compliance with any copyright requirements of third parties. This journal is a member of the Committee on Publication Ethics (COPE).
ACADEMIC EDITOR: Gilles Guillemin, Editor in Chief
COMPETING INTERESTS: Authors disclose no potential conflicts of interest.
Author Contributions
DMD and AA-BB conceived and designed the experiments. AA-BB collected and analyzed the data and wrote the first draft of the manuscript. DMD contributed to the writing of the manuscript and agreed with manuscript results and conclusions. SLL reviewed and revised the statistical tests. AA-BB and DMD jointly developed the structure and arguments for the paper and made critical revisions. All authors approved the final revised manuscript.
REFERENCES
- 1.Badawy AA-B. Pellagra and alcoholism: a biochemical perspective. Alcohol Alcohol. 2013;49:238–50. doi: 10.1093/alcalc/agu010. [DOI] [PubMed] [Google Scholar]
- 2.Bender DA. Biochemistry of tryptophan in health and disease. Mol Aspects Med. 1982;6:1–97. doi: 10.1016/0098-2997(83)90005-5. [DOI] [PubMed] [Google Scholar]
- 3.Badawy AA-B. Tryptophan metabolism in alcoholism. Nutr Res Rev. 2002;15:123–52. doi: 10.1079/NRR200133. [DOI] [PubMed] [Google Scholar]
- 4.Salter M, Bender DA, Pogson CI. Leucine and tryptophan metabolism in rats. Biochem J. 1985;225:277–81. doi: 10.1042/bj2250277. [DOI] [PMC free article] [PubMed] [Google Scholar]
- 5.Ghafoorunissa, Rao BS. Effect of leucine on enzymes of the tryptophan-niacin metabolic pathway in rat liver and kidney. Biochem J. 1973;134:425–30. doi: 10.1042/bj1340425. [DOI] [PMC free article] [PubMed] [Google Scholar]
- 6.Magboul BI, Bender DA. The effect of dietary leucine excess on nicotinamide nucleotides in the rat. Proc Nutr Soc. 1981;40:16A. doi: 10.1079/bjn19830041. [DOI] [PubMed] [Google Scholar]
- 7.Bender DA. Effects of a dietary excess of leucine on the metabolism of tryptophan in the rat: a mechanism for the pellagragenic action of leucine. Br J Nutr. 1983;50:25–32. doi: 10.1079/bjn19830068. [DOI] [PubMed] [Google Scholar]
- 8.Bender DA, Magboul BI. Schlossberger HG, Kochen W, Linzen B, et al. Progress in Tryptophan and Serotonin Research. Berlin: Walter de Gruyter; 1984. The pellagragenic action of a dietary excess of leucine: effects of a high leucine diet on tryptophan metabolism; pp. 603–6. [Google Scholar]
- 9.Magboul BI, Bender DA. The effects of a dietary excess of leucine on the synthesis of nicotinamide nucleotides in the rat. Br J Nutr. 1983;49:321–9. doi: 10.1079/bjn19830041. [DOI] [PubMed] [Google Scholar]
- 10.Hankes LV, Leklem JE, Brown RR, Mekel RCPM. Tryptophan metabolism in patients with pellagra: problems with vitamin B6 enzyme activity and feedback inhibition of tryptophan pyrrolase enzyme. Am J Clin Nutr. 1971;24:730–9. doi: 10.1093/ajcn/24.6.730. [DOI] [PubMed] [Google Scholar]
- 11.Sakakibara S, Fujii K, Nasu S, Imai H, Yamaguchi K, Ueda I. Effect of L-leucine- supplemented diet on the nicotinamide adenine dinucleotide content of rat liver. J Nutr. 1982;112:1688–95. doi: 10.1093/jn/112.9.1688. [DOI] [PubMed] [Google Scholar]
- 12.Badawy AA-B, Dougherty DM, Richard DM. Specificity of the acute tryptophan and tyrosine plus phenylalanine depletion and loading tests. I: review of biochemical aspects and poor specificity of current amino acid formulations. Int J Tryptophan Res. 2010;3:23–34. doi: 10.4137/ijtr.s5134. [DOI] [PMC free article] [PubMed] [Google Scholar]
- 13.Badawy AA-B, Dougherty DM, Richard DM. Specificity of the acute tryptophan and tyrosine plus phenylalanine depletion and loading tests. Part II: normalisation of the tryptophan and tyrosine plus phenylalanine to competing amino acid ratios in a new control formulation. Int J Tryptophan Res. 2010;3:35–47. doi: 10.4137/ijtr.s5169. [DOI] [PMC free article] [PubMed] [Google Scholar]
- 14.Young SN, Smith SE, Pihl RO, Ervin FR. Tryptophan depletion causes a rapid lowering of mood in normal males. Psychopharmacology. 1985;87:173–7. doi: 10.1007/BF00431803. [DOI] [PubMed] [Google Scholar]
- 15.Morgan CJ, Badawy AA-B. Effects of storage on binding and stability of tryptophan in human serum. Ann Clin Biochem. 1994;31:190–2. doi: 10.1177/000456329403100215. [DOI] [PubMed] [Google Scholar]
- 16.Badawy AA-B, Morgan CJ. Rapid isocratic liquid chromatographic separation and quantification of tryptophan and six kynurenine metabolites in biological samples with ultraviolet and fluorimetric detection. Int J Tryptophan Res. 2010;3:175–86. doi: 10.4137/IJTR.S6225. [DOI] [PMC free article] [PubMed] [Google Scholar]
- 17.Dougherty DM, Marsh-Richard DM, Mathias CW, et al. Comparison of 50- and 100-g L-tryptophan depletion and loading formulations for altering 5-HT synthesis: pharmacokinetics, side effects, and mood states. Psychopharmacology. 2008;198:431–45. doi: 10.1007/s00213-008-1163-2. [DOI] [PMC free article] [PubMed] [Google Scholar]
- 18.Bapurao S, Krishnaswamy K. Vitamin B6 status of pellagrins and their leucine tolerance. Am J Clin Nutr. 1978;31:819–24. doi: 10.1093/ajcn/31.5.819. [DOI] [PubMed] [Google Scholar]
- 19.Swendseid ME, Villalobos J, Figueroa WS, Drenick EJ. The effects of test doses of leucine, isoleucine or valine on plasma amino acid levels. Am J Clin Nutr. 1965;17:317–21. doi: 10.1093/ajcn/17.5.317. [DOI] [PubMed] [Google Scholar]
- 20.Tannous RI, Rogers QR, Harper AE. Effect of leucine-isoleucine antagonism on the amino acid pattern of plasma and tissues of the rat. Arch Biochem Biophys. 1966;113:356–61. doi: 10.1016/0003-9861(66)90197-4. [DOI] [PubMed] [Google Scholar]
- 21.Hutson SM. Subcellular distribution of branched-chain aminotransferase activity in rat tissues. J Nutr. 1988;118:1475–81. doi: 10.1093/jn/118.12.1475. [DOI] [PubMed] [Google Scholar]
- 22.Hutson SM, Wallin R, Hall TR. Identification of mitochondrial branched chain aminotransferase and its isoforms in rat tissues. J Biol Chem. 1992;267:15681–6. [PubMed] [Google Scholar]
- 23.Taniguchi K, Nonami T, Nakao A, et al. The valine catabolic pathway in human liver: effect of cirrhosis on enzyme activities. Hepatology. 1996;24:1395–8. doi: 10.1002/hep.510240614. [DOI] [PubMed] [Google Scholar]
- 24.Suryawan A, Harris JW, Shimomura S, Hawes JW, Jenkins AE, Hutson SM. A molecular model of branched-chain amino acid metabolism. Am J Clin Nutr. 1998;6:72–81. doi: 10.1093/ajcn/68.1.72. [DOI] [PubMed] [Google Scholar]
- 25.Brosnan JT, Brosnan EM. Branched-chain amino acids: enzyme and substrate regulation. J Nutr. 2006;136:207S–211S. doi: 10.1093/jn/136.1.207S. [DOI] [PubMed] [Google Scholar]
- 26.Nakano K, Kishi T, Kurita N, Ashida K. Effect of dietary amino acids on amino acid-catabolising enzymes in rat liver. J Nutr. 1970;100:827–36. doi: 10.1093/jn/100.7.827. [DOI] [PubMed] [Google Scholar]
- 27.Cowen PJ, Williamson DJ, McTavish SFB. Effect of valine on 5-HT neurotransmission and mood. Adv Exp Med Biol. 1996;398:67–71. doi: 10.1007/978-1-4613-0381-7_8. [DOI] [PubMed] [Google Scholar]
- 28.Salter M, Knowles RG, Pogson CI. Transport of the aromatic amino acids into isolated rat liver cells: properties of uptake by two distinct mechanisms. Biochem J. 1986;233:499–506. doi: 10.1042/bj2330499. [DOI] [PMC free article] [PubMed] [Google Scholar]
- 29.Badawy AA-B, Evans M. The regulation of rat liver tryptophan pyrrolase by its cofactor haem – experiments with haematin and 5-aminolaevulinate and comparison with the substrate and hormonal mechanisms. Biochem J. 1975;150:511–20. doi: 10.1042/bj1500511. [DOI] [PMC free article] [PubMed] [Google Scholar]
- 30.Hutson SM. Commentary: the case for regulating indispensable amino acid metabolism: the branched-chain α-keto acid dehydrogenase kinase-knockout mouse. Biochem J. 2006;400:e1–3. doi: 10.1042/BJ20061506. [DOI] [PMC free article] [PubMed] [Google Scholar]
- 31.Badawy AA-B. Plasma free tryptophan revisited: what you need to know and do before measuring it. J Psychopharmacol. 2010;24:809–15. doi: 10.1177/0269881108098965. [DOI] [PubMed] [Google Scholar]
- 32.Takikawa O, Yoshida R, Kido R, Hayaishi O. Tryptophan degradation in mice initiated by Indoleamine 2,3-dioxygenase. J Biol Chem. 1986;261:3648–53. [PubMed] [Google Scholar]
- 33.Kolodziei LR, Paleolog EM, Williams RO. Kynurenine metabolism in health and isease. Amino Acids. 2011;41:1173–83. doi: 10.1007/s00726-010-0787-9. [DOI] [PubMed] [Google Scholar]
- 34.Smith SA, Pogson CI. The metabolism of L-tryptophan by isolated rat liver cells: effect of albumin binding and amino acid competition on oxidation of tryptophan by tryptophan 2,3-dioxygenase. Biochem J. 1980;186:977–86. doi: 10.1042/bj1860977. [DOI] [PMC free article] [PubMed] [Google Scholar]
- 35.Badawy AA-B. Tryptophan: the key to boosting brain serotonin synthesis in depressive illness. J Psychopharmacol. 2013;27:878–93. doi: 10.1177/0269881113499209. [DOI] [PubMed] [Google Scholar]
- 36.Badawy AA-B. Review: the tryptophan utilisation concept in pregnancy. Obstet Gynecol Sci. 2014;57:249–59. doi: 10.5468/ogs.2014.57.4.249. [DOI] [PMC free article] [PubMed] [Google Scholar]
- 37.Zepf FD, Wöckel L, Poustka F, Holtmann M. Dietary tryptophan depletion according to body weight – A new treatment option in acute mania? Med Hypotheses. 2009;72:47–8. doi: 10.1016/j.mehy.2008.06.046. [DOI] [PubMed] [Google Scholar]
- 38.Chen Y, Guillemin GL. Kynurenine pathway metabolites in humans: disease and health state. Int J Tryptophan Res. 2009;2:1–19. doi: 10.4137/ijtr.s2097. [DOI] [PMC free article] [PubMed] [Google Scholar]