

Abstract
Postsynaptic AMPA- and NMDA-type glutamate receptors (AMPARs, NMDARs) are commonly expressed at the same synapses. AMPARs are thought to mediate the majority of fast excitatory neurotransmission whereas NMDARs, with their relatively slower kinetics and higher Ca2+ permeability, are thought to mediate synaptic plasticity, especially in neural circuits devoted to learning and memory. In sensory neurons, however, the roles of AMPARs and NMDARs are less well understood. Here, we tested in the in vitro guinea pig retina whether AMPARs and NMDARs differentially support temporal contrast encoding by two ganglion cell types. In both OFF Alpha and Delta ganglion cells, contrast stimulation evoked an NMDAR-mediated response with a characteristic J-shaped I–V relationship. In OFF Delta cells, AMPAR- and NMDAR-mediated responses could be modulated at low frequencies but were suppressed during 10 Hz stimulation, when responses were instead shaped by synaptic inhibition. With inhibition blocked, both AMPAR- and NMDAR-mediated responses could be modulated at 10 Hz, indicating that NMDAR kinetics do not limit temporal encoding. In OFF Alpha cells, NMDAR-mediated responses followed stimuli at frequencies up to ∼18 Hz. In both cell types, NMDAR-mediated responses to contrast modulation at 9–18 Hz showed delays of <10 ms relative to AMPAR-mediated responses. Thus, NMDARs combine with AMPARs to encode rapidly modulated glutamate release, and NMDAR kinetics do not limit temporal coding by OFF Alpha and Delta ganglion cells substantially. Furthermore, glutamatergic transmission is differentially regulated across bipolar cell pathways: in some, release is suppressed at high temporal frequencies by presynaptic inhibition.
Introduction
Vision depends on the outputs of more than a dozen distinct types of retinal ganglion cells (Masland, 2012). Each type possesses characteristic response properties defined by its receptive field (RF); each RF depends, in turn, on the properties of the presynaptic bipolar and amacrine cells that provide the synaptic inputs to the cell's dendritic tree. For example, direction selectivity in certain ganglion cell types depends on asymmetric GABA release by presynaptic starburst amacrine cells (Euler et al. 2002; Fried et al. 2002; Vaney et al. 2012; Yonehara et al. 2013; Park et al. 2014). Presynaptic mechanisms also contribute to orientation selectivity (Venkataramani & Taylor, 2010), non-linear spatial summation (Demb et al. 2001; Schwartz et al. 2012; Borghuis et al. 2013) and surround inhibition (Flores-Herr et al. 2001; Zaghloul et al. 2005; van Wyk et al. 2009; Russell & Werblin, 2010; Crook et al. 2014; Venkataramani et al. 2014).
It is less clear how a ganglion cell's postsynaptic mechanisms, including its collection of ligand-gated channels, influence the RF. For example, temporal tuning of visual responses could depend on the kinetics of the postsynaptic glutamate receptors mediating transmission from bipolar cells. NMDA-type receptors (NMDARs) typically possess slower kinetics than AMPA-type receptors (AMPARs) (Traynelis et al. 2010). Accordingly, electrically evoked NMDAR-mediated postsynaptic currents recorded from ganglion-cell-layer cells in slices of mammalian retina were relatively slow, with responses lasting hundreds of milliseconds: up to 10-times longer than AMPAR-mediated currents (Chen & Diamond 2002; Sagdullaev et al. 2006). Outside-out somatic patches from ganglion-cell-layer cells also showed slow NMDAR-mediated currents in response to glutamate application; these currents lasted up to hundreds of milliseconds (Chen & Diamond, 2002). Thus, under certain conditions, and in some retinal cell types, NMDAR kinetics apparently are substantially slower than those of AMPARs. These findings complemented earlier studies of light responses recorded in salamander ganglion cells, whose NMDAR-mediated, light-evoked currents were slow, suggesting that NMDAR kinetics could enhance responses to low frequency stimuli (Mittman et al. 1990; Diamond & Copenhagen, 1993). Temporal tuning of ganglion cell responses, however, was not evaluated explicitly in these studies.
Thus, it remains unresolved whether slow NMDAR kinetics influence the temporal tuning of light-evoked synaptic responses in most ganglion cell types. For instance, the channels studied in the aforementioned patch recordings must have been extrasynaptic, because excitatory synapses on ganglion cells are found exclusively on their dendrites (Stevens et al. 1980; Freed & Sterling, 1988; Kolb & Nelson, 1993). Furthermore, electrically evoked glutamate release is not necessarily a good proxy for light-evoked synaptic transmission (Grimes et al. 2011; Sethuramanujam & Slaughter, 2014). Indeed, NMDAR-mediated spontaneous EPSCs in ganglion cells, which reflect synaptic release, were only slightly delayed (∼10 ms) compared to AMPAR-mediated EPSCs (Sagdullaev et al. 2006; Zhang & Diamond, 2009). Furthermore, light-evoked NMDAR-mediated currents in some types of primate ganglion cells were relatively fast (Crook et al. 2014).
Here, we used light stimulation and a conductance analysis (Manookin et al. 2010; Venkataramani & Taylor, 2010) to evaluate the roles that AMPARs and NMDARs play in the temporal tuning of two types of wide-field ganglion cell (OFF Alpha and OFF Delta) in the in vitro guinea pig retina. Our results indicate that synaptic NMDAR-mediated currents are fast and delayed only slightly relative to AMPAR-mediated currents recorded in the same cells. Although OFF Alpha and Delta cells showed similarly fast NMDAR-mediated currents, their presynaptic circuits were modulated differentially by presynaptic inhibition; at high temporal frequencies inhibition suppressed glutamatergic input to OFF Delta, but not OFF Alpha cells. Hence, the distinct temporal properties of parallel bipolar cell pathways depend, in part, on the inhibitory control of presynaptic release (Mazade & Eggers, 2013; Borghuis et al. 2014).
Methods
Ethical approval
All procedures conformed to National Institutes of Health guidelines for use and care of animals in research and were approved by the University of Michigan Committee on the Use and Care of Animals.
Tissue preparation and electrophysiology
Hartley guinea pigs (Elms Hill, Chelsmford, MA, USA) were housed in a 12:12 h light–dark cycle. The animal was dark-adapted for 1 h before further procedures were carried out. Under dim red light, the animal was anaesthetized with an intramuscular injection of ketamine (100 mg kg−1) and xylazine (10 mg kg−1). Under anaesthesia, the animal was killed by decapitation and then both eyes were removed. The retina was prepared as described previously (Manookin et al. 2008, 2010). For whole-cell recording, the retina was positioned in a chamber on the fixed stage of a microscope (Olympus BX51WI) and superfused (6 ml min−1) with carbogenated (95% O2, 5% CO2) Ames medium heated to 33–35ºC with an in-line heater (Warner Instruments, LLC, Hamden, CT, USA). Membrane current was amplified, sampled at 10 kHz and stored on a computer using a MultiClamp 700A amplifier, Digidata 1322A A/D board and pClamp 9 software (Axon Instruments, Union City, CA, USA). Patch electrodes (3–5 MΩ) were filled with intracellular solution (in mm): 120 caesium methanesulphonate, 5 TEA-Cl, 10 Hepes, 3 NaCl, 10 BAPTA, 2 QX-314-Cl, 2 ATP-Mg and 0.3 GTP-Na with 0.10% Lucifer Yellow, titrated to pH 7.3. The chloride reversal potential (ECl) was calculated to be −67 mV. All chemicals were purchased from Sigma-Aldrich (St Louis, MO, USA) except for BAPTA (Invitrogen, Carlsbad, CA, USA), QX-314, strychnine, gabazine and l-2-amino-4-phosphonobutyric acid (l-AP4) (Tocris Bioscience, Ellisville, MO, USA).
Light responses were recorded under voltage clamp (n = 144 cells). Junction potential (−9 mV) and an error in the holding potential introduced by uncompensated series resistance (16 ± 3 MΩ; 48 ± 7% compensation; mean ± SEM) was corrected as described (Manookin et al. 2010); we excluded cells with series resistance >20 MΩ. OFF Alpha and Delta cell input resistance was 31 ± 4 MΩ (n = 113) and 38 ± 8 MΩ (n = 31), respectively. In voltage-step protocols, Vhold started near −75 mV and stepped positive in 10–15 mV increments followed by a return to −75 mV. The cell was held for ∼5–12 s at each potential while presenting the light stimulus.
Visual stimuli and recording
The stimulus was displayed, after gamma correction, using the green gun on a miniature monochrome monitor (Lucivid MR1–103; MicroBrightField, Inc., Williston, VT, USA) or the green channel of an organic LED display (eMagin; SVGA Rev 2; Bellevue, WA, USA). Mean luminance of the background evoked an estimated photoisomerization (P*) rate in the rod (R), M cone (M) and S cone (S) of ∼2 × 10³ PR* s−1, ∼103 PM* s−1 and ∼102 PS* s−1. RF centre location was mapped by recording excitatory currents to square-wave modulation of a 150 μm diameter spot at eight positions (1 Hz; Vhold = ECl). In subsequent experiments, spot stimuli were presented either as a contrast pulse (200 ms) or as contrast modulation with sine-wave (1–10 Hz, using a 60 Hz frame rate) or square-wave temporal profiles (1–18.7 Hz, using a 75 Hz frame rate). The sine-wave modulation was limited to lower temporal frequencies so that each cycle could be generated by a minimum of six frames. The pulsed spots were presented as −100% decrements from the background (−100% Weber contrast). The sine-wave or square-wave modulation was presented at 100% Michelson contrast, defined by the maximum (Lmax) and minimum luminance (Lmin) of the stimulus over time: (Lmax − Lmin)/(Lmax + Lmin).
Analysis
All analyses were performed on baseline-subtracted currents. Baseline currents were calculated at each Vhold by fitting 500 ms windows before and after the stimulus with a second-order polynomial function and subtracting the fit; this fit accounted for slow decays in the baseline current, especially at more depolarized holding potentials. For temporal tuning experiments, stimuli were presented for 3 s. The response at the beginning of this period sometimes showed instability, presumably due to stimulus adaptation (e.g. Fig.3B). Therefore, the first second of data were discarded and the response cycles within the final 2 s were averaged for analysis. I–V plots were generated for a ∼30 ms time window, which was chosen near the peak excitatory response while avoiding periods with strong inhibitory conductance that could generate large errors in the holding potential.
Figure 3. NMDARs contribute to rapid temporal modulation in OFF Alpha cells.

A, synaptic currents recorded from an OFF Alpha cell in response to 1 Hz temporal contrast modulation at two of eight Vholds (top). The response to one cycle was averaged over the last 2 s (bottom, left). For an excitatory response window (grey box), an I–V relationship is shown (bottom, right) with a basis-function fit (continuous line). The response depends strongly on an NMDAR-mediated conductance, as indicated by the J-shaped I–V relationship. B, as for A for 10 Hz modulation. Data from the last 2 s were averaged to generate the I–V plot. As in A, the response depended strongly on an NMDAR-mediated conductance, as indicated by the J-shaped I–V relationship. C, fitted conductances are shown for responses at five temporal frequencies. Both AMPAR- and NMDAR-mediated conductances were present at all frequencies. Error bars indicate ±SEM across cells (with number of cells in parentheses above the data points). The NMDAR- mediated conductances here and below (F) were scaled to their value at VM = −62 mV (i.e. near the resting potential) and reflect 8.1% of the maximal conductance (Manookin et al. 2010). D, average cycles and I–V plots for responses to 1 Hz temporal stimulation with inhibition and ON pathway input suppressed (l-AP4, gabazine, strychnine). The I–V relationship remained J-shaped (compare to A). E, as in D, for 10 Hz modulation. The I–V relationship remained J-shaped (compare to B). F, as in C, but with inhibition suppressed. NMDAR-mediated conductance is present at both 1 and 10 Hz.
I–V relationships were modelled as the weighted sum of three ligand-gated currents mediated by AMPA, NMDA and GABA/glycine receptors (least squares fit):
The equations for the basis functions and weights for the fitting procedure have been described in detail previously (Manookin et al. 2010). Briefly, the AMPAR basis function was assumed to be linear with Erev = 0 mV. The NMDAR basis function represented the response to NMDAR applied in the presence of blockers of fast synaptic transmission and has Erev = 0 mV. The equation for the NMDAR conductance (gNMDA) includes a parameter that describes the effective Kd for Mg2+ binding (β) and a voltage-dependence parameter (α):
where [Mg2+]o is the extracelluler Mg2+ concentration (1.2 mm).
The GABA/glycine receptor basis function was derived from the inhibitory response to light onset (or dark offset) measured in the presence of an NMDAR antagonist, and after subtracting any AMPAR component; this basis function necessarily reverses at ECl. The three weights estimated the conductances that combined to generate the measured I–V relationship of currents evoked by an arbitrary light stimulus. Reported NMDAR-mediated conductance weights, which are strongly voltage dependent, represent the conductance at −62 mV (i.e. near the resting potential; Manookin et al. 2010) and reflect 8.1% (OFF Alpha) or 5.0% (OFF Delta) of the maximal conductance. The two cell types used individually fitted NMDAR basis functions (OFF Alpha, α: −0.083 mV−1; β: 18.2 mm; OFF Delta, α: −0.097 mV−1; β: 26.0 mm; see Manookin et al. 2010), which explains the slight difference in the percentage of maximal conductance at VM = −62 mV. The significance of fitted conductance values was assessed using Student's t tests. All values are reported as mean ± SEM.
Temporal conductance analysis
We performed the conductance analysis as a function of time to estimate the dynamics of AMPAR- and NMDAR-mediated responses to stimulus modulation at 9 Hz and higher frequencies (see Fig.5). Analysis was performed primarily under conditions in which inhibition was blocked to minimize the influence of errors in voltage clamp imposed by large inhibitory conductances. The overall time course of these conductances reflects a combination of the time course of glutamate release and the kinetics of each receptor's response to individual synaptic release events. There is no practical way to separate these individual influences, so we focused on a robust measure of response kinetics that combines the two influences: the relative timing of the peak conductance for each receptor. Synaptic currents evoked by one cycle of the stimulus were averaged and fit, as a function of time, to generate time courses of the underlying ligand-gated conductances. In some cases conductances from multiple cells were averaged to generate population estimates (see Fig.5A–B, D–E). In other cases, we fit the AMPAR and NMDAR conductance time courses for individual cells based on the sum of the first three Fourier harmonics of the stimulus frequency and measured the delay between the peaks of these fits (see Fig.5C and G). These fits provided an accurate description of the response: the r2 between the fit (i.e. explained variance) and response was 0.97 ± 0.01 and 0.98 ± 0.005 for AMPAR and NMDAR components, respectively.
Figure 5. Modulation of ganglion cell conductances suggests fast NMDAR kinetics in the retina.
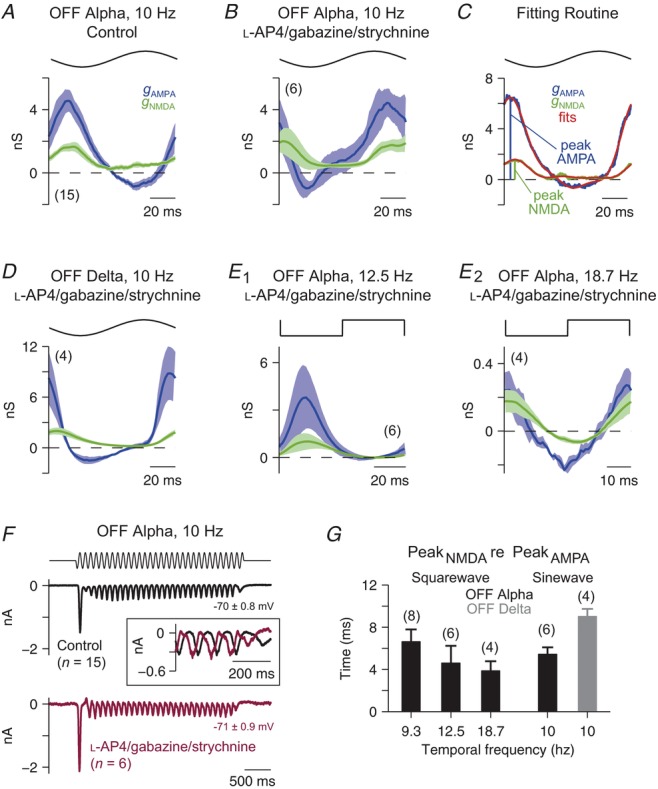
A, fitted AMPAR- and NMDAR-mediated conductances as a function of time for OFF Alpha cells in response to 10 Hz sinusoidal temporal modulation. For each cell, the response to one stimulus cycle was averaged over the final 2 s (as in Fig.3) before applying the fitting procedure. The NMDAR-mediated conductance modulates with the stimulus. Throughout this figure, the NMDAR-mediated conductance is shown scaled to its value at VM = −62 mV, which represents 8.1% (OFF Alpha cells) or 5.0% (OFF Delta cells) of the maximal conductance (see Methods). Throughout this figure, the number of cells in a given condition is indicated in parentheses. B, as in A, for OFF Alpha cells with inhibition and the ON-pathway suppressed (l-AP4, gabazine, strychnine). The drugs caused a phase advance of the response (illustrated in F), but the relative amplitudes of the AMPAR and NMDAR components remain relatively constant (compare to A). C, an individual cell's AMPAR- and NMDAR-mediated conductances were fit (red lines; see Methods) and the delay between the fitted peaks was calculated. D, as in B, for OFF Delta cells. E1, as in B, for OFF Alpha cells responding to 12.5 Hz square-wave modulation. E2, as in E1 for OFF Alpha cells responding to 18.7 Hz modulation. F, averaged whole-cell currents recorded near ECl (average Vhold is indicated below trace) from a population of OFF Alpha cells in response to 10 Hz temporal modulation under control conditions (top) and with inhibition and ON pathway input blocked (bottom). Inset traces show the last 200 ms of the averaged responses. Application of the drugs sped the response timing relative to control conditions. G, the delay of the peak NMDAR-mediated conductance relative to the peak AMPAR-mediated conductance for responses to contrast modulation at a range of temporal frequencies in OFF Alpha and Delta cells with inhibition and ON pathway input blocked. Error bars indicate ±SEM across cells (with number of cells in parentheses above the data points).
Results
Stimulation of the RF centre produces robust NMDAR-mediated responses in OFF Alpha and Delta cells
We showed previously that in the intact guinea pig retina, both OFF Alpha and OFF Delta cells responded to contrast stimuli with synaptic currents mediated by both AMPARs and NMDARs (Manookin et al. 2010). However, the nature of the NMDAR contribution differed between cell types. For example, NMDARs contributed to the firing response primarily in OFF Alpha cells; and the NMDARs showed GluN2B subunit involvement (i.e. ifenprodil sensitivity) primarily in OFF Delta cells (Manookin et al. 2010). Here, we examined the same cell types and tested the role of NMDARs in temporal tuning, as described below. To perform these experiments, we first determined an optimal spatial stimulus for generating a strong NMDAR-mediated contribution to the light-evoked current. A pulse of −100% contrast (i.e. full decrement to darkness from the background luminance) was delivered within a spot with variable diameter (100–1000 μm).
High signal to noise responses were achieved routinely using 200–300 μm diameter spots, and we observed non-linear, J-shaped I–V relationships in both cell types (Fig.1). In OFF Alpha cells, a larger spot size resulted in a more linear I–V relationship (Fig.1A, B). In OFF Delta cells, a larger spot size suppressed the excitatory input almost entirely and instead drove an inhibitory conductance. At stimulus onset (i.e. relative dimming), the negative I–V relationship coupled with a reversal potential near ECl implied a prominent ‘disinhibition’, i.e. a net closing of Cl channels open at rest (Fig.1C, D; Manookin et al. 2008, 2010). In both cell types and for all stimuli tested, the response at stimulus offset (i.e. relative brightening) was mediated by a direct inhibitory input (i.e. positive conductance with reversal potential near ECl), as described previously (Manookin et al. 2008; 2010). In the experiments below, we used a 200 or 300 μm diameter spot and modulated contrast with a sine-wave or square-wave profile (100% Michelson contrast) over a range of temporal frequencies.
Figure 1. Small central stimuli generate robust NMDAR-mediated light responses.

A, OFF Alpha cell responses to a 200 ms −100% contrast pulse (i.e. full decrement from the background luminance) presented within a spot of 200 or 1000 μm diameter centred over the RF centre. Synaptic currents are shown at two indicated Vholds (of eight in total, top) and averaged responses (within grey and white boxes) at stimulus onset (grey) and offset (black) are shown in the I–V plots (bottom). B1, averaged I–V relationship at stimulus onset for OFF Alpha cells generated by the stimuli in A. The number of cells is indicated in parentheses. Error bars indicate ±SEM across cells. B2, as for B1 for the response at stimulus offset. C and D, as in A and B for OFF Delta cells.
NMDARs do not limit temporal encoding in OFF Delta cells
To understand how an OFF Delta cell's NMDARs shape the temporal properties of its light-evoked responses, the contributions of different receptors (i.e. AMPA, NMDA, GABA/glycine) were estimated by decomposing light-evoked currents into their underlying conductances. Light responses were recorded at multiple holding potentials (Vhold), and the I–V relationship within a response window was fit with the weighted sum of receptor basis functions, as described previously (Fig.2D) (Manookin et al. 2010).
Figure 2. NMDARs can respond to rapid temporal modulation in OFF Delta cells but are normally unstimulated due to presynaptic inhibition.

A, synaptic currents recorded from an OFF Delta cell in response to 1 Hz temporal contrast modulation at two of eight Vholds (top). The response to one cycle was averaged over the last 2 s (bottom, left). For an excitatory response window (grey box), an I–V relationship is shown (bottom, right) with a basis-function fit (continuous line; see Methods). The response depends strongly on an NMDAR-mediated conductance, as indicated by the J-shaped I–V relationship. B, as for A, for 10 Hz modulation. Data from the last 2 s were averaged to generate the I–V plot. The response is driven primarily by disinhibition as indicated by the negative slope of the I–V plot. C, fitted conductances are shown for responses at three temporal frequencies. Both AMPAR- and NMDAR-mediated conductances are suppressed at 10 Hz. Error bars indicate ±SEM across cells (with the number of cells in parentheses above the data points). The NMDAR-mediated conductances here and below (G) were scaled to their value at VM = −62 mV (i.e. near the resting potential) and reflect 5.0% of the maximal conductance (Manookin et al. 2010). D, the basis function fitting procedure. Responses (dots) were fit (line) by the weighted sum of the three basis functions: AMPAR, NMDAR and inhibitory (GABA and glycine) receptors. E, average cycles and I–V plots for responses to 1 Hz temporal stimulation with inhibition and ON pathway input blocked (l-AP4, gabazine, strychnine). Similar to control conditions (A), the I–V plot is J-shaped, indicating an NMDAR-mediated contribution. F, as in E, for 10 Hz modulation. NMDAR-mediated conductance is now strong (compared to B), as indicated by the J-shaped I–V relationship. G, as in C, with inhibition suppressed. NMDAR-mediated conductance is present at all temporal frequencies, including the 10 Hz condition.
OFF Delta cells responded to contrast modulated sinusoidally at frequencies between 1 and 10 Hz. For each frequency, we fit the conductances in a time window centred near the peak of the excitatory response (Fig.2A, B), which occurred during the negative phase of the sine wave. Delta cells showed significant AMPAR- and NMDAR-mediated conductances at stimulus frequencies of 1 and 7.5 Hz (P < 0.01 for all; unpaired t test; Fig.2C). The NMDAR-mediated conductance was strongly voltage dependent, and the values in Fig.2 show the conductance at VM = −62 mV, which is 5.0% of the maximum value (Manookin et al. 2010). The amplitudes of both AMPAR- and NMDAR-mediated conductances dropped significantly at stimulus frequencies between 7.5 and 10 Hz (AMPA: reduced 4.71 ± 1.56 nS, P = 0.05; NMDA: reduced 0.82 ± 0.24 nS, P = 0.02; paired t tests; Fig.2C). Responses at lower frequencies did not exhibit significant inhibitory conductances (P > 0.4 for both; unpaired t test; Fig.2C); this partly reflects the variable level of inhibition across cells in the chosen time window (Fig.2A, C). The response at 10 Hz was mediated primarily by the suppression of a tonic inhibitory input (i.e. a negative conductance: −3.65 ± 0.57 nS, P = 0.003; unpaired t test; Fig.2B, C).
The lack of a prominent excitatory conductance in response to 10 Hz modulation suggested that an OFF Delta cell's glutamate receptors were not stimulated, either because of some intrinsic properties of the receptors or because glutamatergic transmission to the OFF Delta cell was suppressed by high-frequency stimulation. To determine the limiting factor, excitatory inputs were isolated by blocking multiple sources of inhibition. The ‘cross-over’ inhibitory pathways, mediated by ON bipolar cells acting through amacrine cells (Manookin et al. 2008; Demb and Singer, 2012), were blocked with l-AP4 (50 μm), which hyperpolarizes ON bipolar cells (Slaughter and Miller, 1981); GABA-A and glycine receptors were blocked by gabazine (20 μm) and strychnine (2 μm), respectively. Under this condition, the I–V relationships assessed at both 1 and 10 Hz stimulation became J-shaped and demonstrated significant NMDAR components (P < 0.05 for all temporal frequencies; unpaired t tests; Fig.2E–G).
The inhibitory conductance was not completely suppressed (P < 0.001 at 1 Hz; P < 0.05 at 7.5 and 10 Hz), suggesting either that some inhibition was resistant to the blockers or that there is an inaccuracy in the fitting procedure. For example, the fitting procedure necessarily assigns an inhibitory conductance if the reversal potential is less than 0 mV. Furthermore, the AMPAR and NMDAR components were also suppressed relative to control conditions in the 1 Hz condition (Fig.2C); this probably reflects the effect of the blockers within the retinal circuitry, which can alter synaptic release in unpredictable ways. Nevertheless, the prominent J-shaped I–V relationship, along with a reversal potential close to 0 mV, indicates that a Delta cell's NMDARs can encode a 10 Hz stimulus and does not substantially limit temporal encoding (Fig.2F, G). Rather, at high frequencies, excitatory input from bipolar cells is actively suppressed by presynaptic inhibition, and consequently direct, postsynaptic inhibition generates the OFF Delta cell's light response in relative isolation (Fig.2B, C).
AMPARs and NMDARs in OFF Alpha cells mediate signalling at similar temporal frequencies
We next examined OFF Alpha cell responses to sinusoidal contrast modulation (Fig.3A, B). Alpha cells showed robust AMPAR-mediated conductances evoked by all stimulus frequencies; AMPAR-mediated responses were maximal in response to stimulation at 5 Hz (P < 0.0005 in each case; unpaired t tests; Fig.3C). NMDAR-mediated conductances evoked by 1–10 Hz stimuli were relatively constant in amplitude (P < 0.005 in each case; unpaired t tests; Fig.3C, top). Here, as above, the plotted NMDAR-mediated conductances near Vrest (−62 mV) represented only a small fraction (8.1%) of the maximal conductance of the channels (Manookin et al. 2010). Thus, both AMPARs and NMDARs contributed to visual stimulus coding across the full range of temporal frequencies tested.
The inhibitory component of the postsynaptic response arises from at least two sources: OFF-pathway mediated feedforward inhibition and ON-pathway mediated crossover inhibition (Manookin et al. 2008; Venkataramani and Taylor, 2010). The crossover inhibition includes a tonic component that is actively suppressed during the dark phase. Accordingly, we observed a weak, positive inhibitory conductance evoked at low temporal frequencies; the inhibitory conductance became negative at frequencies >5 Hz, presumably owing to a dominant disinhibition component from the ON pathway (P < 0.05 only for 2.5 Hz; unpaired t tests; Fig.3C).
To confirm the presence of an NMDAR-mediated response to stimulation at high temporal frequencies, we recorded responses after isolating excitatory synapses by applying the blockers used above (l-AP4, gabazine and strychnine). In this condition, high frequency stimulation produced J-shaped I–V relationships (Fig.3D, E) with significant NMDAR-mediated conductance at 1 Hz (2.04 ± 0.41 pS, P = 0.001; unpaired t test) and 10 Hz (2.12 ± 0.32 pS, P < 0.001; unpaired t test; Fig.3F). At each frequency, NMDAR-mediated responses were not reduced significantly in the presence of the blockers (P > 0.1 for both; unpaired t test).
To determine whether NMDARs limited temporal coding within the physiological range, a broader range of frequencies was tested using square-wave contrast modulation (1–18.7 Hz). Light-evoked spikes, measured in loose patch recordings with inhibition intact, demonstrated that these frequencies covered the full physiological response range with peak responsiveness near ∼9 Hz (Fig.4A). Whole-cell recordings in the presence of blockers of the ON pathway and inhibitory receptors (l-AP4, gabazine, strychnine) showed that square-wave stimuli up to 12.5 Hz produced significant AMPAR- and NMDAR-mediated conductances (P < 0.05; unpaired t test; Fig.4B, C). Responses at 1 Hz were larger than those recorded with sine-wave modulation (Fig.4C vs. Fig.3F); this phenomenon is probably explained by the sharp transition of the square-wave stimulus, which includes higher harmonics of the fundamental frequency. Responses to 18.7 Hz stimuli were more variable than responses to lower frequencies, but on average NMDAR-mediated conductances were greater than zero (P < 0.05; unpaired t test; Fig.4C). For half of the cells (4/8) tested, there were apparent AMPAR- and NMDAR-mediated contributions to responses at 18.7 Hz; the relative timing of these conductances was analysed further (see below). Across cells, inhibitory responses were eliminated by the blockers (Fig.4C). These results suggest that an OFF Alpha cell's NMDARs can follow contrast modulated at frequencies up to ∼18 Hz.
Figure 4. NMDARs do not limit temporal encoding within the physiological range.

A, OFF Alpha cell spike responses, measured using loose-patch recording, to square-wave temporal contrast modulation from 1 to 18.7 Hz. These frequencies covered the physiological response range, with peak responsiveness near ∼9 Hz. In these recordings, synaptic inhibition was intact. Error bars indicate ±SEM across cells (with number of cells in parentheses above the data points). B, synaptic currents recorded from an OFF Alpha cell in response to 12.5 Hz square-wave modulation at two of eight Vholds (left); recordings were made with inhibition and the ON pathway suppressed (l-AP4, gabazine, strychnine), to isolate the excitatory input, and the response to one cycle was averaged over the final 2 s of the stimulus (as in Fig.3). For a response window near the peak of excitation (grey box), an I–V relationship is shown (right) with a basis-function fit (continuous line). The response depends strongly on an NMDAR-mediated conductance, as indicated by the J-shaped I–V relationship. C, fitted conductances for responses to 1–18.7 Hz contrast modulation. Error bars indicate ±SEM across cells (with number of cells in parentheses above the data points). NMDAR-mediated conductances were scaled to their value at VM = −62 mV, reflecting 8.1% of the maximal conductance (Manookin et al. 2010). The shape of the temporal tuning function does not match the function for spikes, in A, probably due to the effect of inhibition shaping the response under control conditions (A).
Ganglion cell AMPARs and NMDARs encode glutamate release similarly
We compared the relative timing of AMPAR- and NMDAR-mediated conductances by fitting the averaged responses to sine-wave and square-wave stimuli (for frequencies ≥9 Hz) as a function of time for individual cells (Fig.5A, B, D, E; blue and green traces). We then averaged across the population to generate smoothed, population conductance time courses (Fig.5A–B, D–E; blue and green traces; see Methods). For square-wave stimuli up to 18.7 Hz (Fig.5E1 and E2) and for sinusoidal stimuli at 10 Hz (Fig.5A, B), NMDAR-mediated conductances recorded in OFF Alpha cells were delayed only slightly relative to AMPAR-mediated conductances. Similar results were obtained for stimulation of OFF Delta cells (10 Hz sinusoid; Fig.5D). To quantify the relative timing of the conductances, we fit the conductance traces of individual cells and measured the timing of the peak of the NMDAR-mediated conductance relative to the AMPAR conductance (Fig.5C, red lines; see Methods). The delay in the peak of the NMDAR-mediated conductance, relative to the AMPAR-mediated conductance, was ∼4–9 ms for both cell types across all temporal frequencies tested (Fig.5G). Furthermore, the blockers changed the OFF Alpha cell excitatory input (Fig.5A, B) by advancing the responses in time (Fig.5F). Hence, the blockers clearly affected the presynaptic circuitry, but once glutamate release occurred, the AMPARs and NMDARs encoded it similarly.
Discussion
Here we investigated whether differing kinetics of AMPARs and NMDARs can provide a postsynaptic mechanism for RF tuning in two OFF ganglion cell types in guinea pig retina. The main findings are: (1) small, central stimulation of the RF produces robust NMDAR-mediated responses (Fig.1); (2) AMPAR and NMDAR kinetics do not limit temporal coding by OFF Alpha and Delta cells at relatively high stimulation frequencies within the physiological range (9–18 Hz; Figs2–4); (3) NMDAR- and AMPAR-mediated responses possess similar time courses (Fig.5); and (4) OFF Delta cell NMDARs (and AMPARs) are normally un-stimulated at 10 Hz, but this is explained by inhibition of the presynaptic bipolar cell rather than by postsynaptic receptor properties (Fig.2). Thus, temporal tuning can be shaped by presynaptic inhibition of bipolar terminals (Mazade and Eggers, 2013; Borghuis et al. 2014; Venkataramani et al. 2014), and spatial processing likewise reflected inputs from multiple synaptic pathways depending on stimulus parameters (Fig.1C, D). The similar kinetics of AMPARs and NMDARs in ganglion cells may reflect a more general specialization in sensory systems that use glutamate synapses for rapid temporal processing.
Broad temporal tuning of ganglion cells suggests that NMDARs and AMPARs possess similar kinetics
Our relatively fast NMDAR-mediated responses are consistent with recordings from three types of rabbit ganglion cells: postsynaptic responses to low temporal frequency stimuli exhibited NMDAR components that turned on and off rapidly and resembled the AMPAR components in time course (Venkataramani et al. 2010; Buldyrev et al. 2012). Furthermore, our results are consistent with recent findings from primate ganglion cells in which NMDAR-mediated conductances were recorded in response to stimulation at high temporal frequencies (Crook et al. 2014). In addition, the short, ∼4–9 ms delay between the peak of the AMPAR and NMDAR components of the 9–18 Hz responses that we observed (Fig.4) resembles the ∼10 ms delay between AMPAR and NMDAR components of spontaneous EPSCs recorded in rat and mouse cells (Sagdullaev et al. 2006; Zhang et al. 2009). The data from our study and the primate study (Crook et al. 2014) extend previous results by showing that synaptic NMDAR-mediated conductances can be modulated by high temporal frequencies within the physiological range (∼10–20 Hz). The NMDAR-mediated conductances in mammalian ganglion cells apparently are far faster than those measured in salamander ganglion cells (Mittman et al. 1990; Diamond and Copenhagen, 1993). However, it is notable that these early studies of NMDAR-mediated conductances in salamander ganglion cells were performed with synaptic inhibition blocked; a recent study of such neurons, performed with synaptic inhibition intact, demonstrated a faster NMDAR component to a ganglion cell's excitatory input that was similar to its AMPAR component (Sethuramanujam and Slaughter, 2014).
The fast modulation of NMDAR-mediated conductances that we measured is probably attributable to fast channel kinetics rather than to some property of the bipolar cell terminal. Indeed, we are not aware of parameters of synaptic transmission that would permit intrinsically slow NMDARs to generate fast conductance changes. For example, application of a non-competitive NMDAR antagonist, which occupies a fraction of NMDARs and lowers the effective synaptic glutamate concentration, reduces the amplitude of patch or whole-cell currents without accelerating the time courses of the responses (Chen and Diamond, 2002).
Our results are not consistent with previous measurements of slow NMDAR-mediated currents recorded in outside-out patches of membrane excised from mammalian ganglion cell layer somata and from electrically evoked EPSCs recorded in ganglion cells (Chen and Diamond, 2002; Sagdullaev et al. 2011). Possibly, synaptic receptor channels interact with auxiliary proteins that speed their responses (Ng et al. 2009; Yan and Tomita, 2012), and NMDAR co-agonists (d-serine or glycine) influence channel kinetics at synapses (Gustafson et al. 2007; Kalbaugh et al. 2009). Moreover, electrical stimulation, particularly with synaptic inhibition blocked, may generate a large asynchronous release of glutamate leading to AMPAR inactivation, and subsequent truncation of the AMPAR response; NMDARs, with their slower inactivation kinetics, more faithfully report the prolonged glutamate time course. Notably, in both salamander ON–OFF cells and mouse VGlut3+ amacrine cells, electrical stimulation evoked a strong and prolonged NMDAR-mediated current, whereas light stimulation of the same cells showed very little NMDAR-mediated current (Grimes et al. 2011; Sethuramanujam and Slaughter, 2014). Hence, release evoked by electrical stimulation is unlikely to reflect the dynamics of physiological synaptic transmission evoked by light stimuli.
In many cases, we measured the temporal properties of AMPAR- and NMDAR-mediated conductances with inhibition blocked (Figs5). This condition avoided the large conductance changes associated with synaptic inhibition onto the recorded cell, which can lead to voltage clamp errors. This condition, however, appears to alter the pattern of synaptic release; this is expected because several inhibitory mechanisms at bipolar cell terminals are suppressed. For example, the temporal tuning function for the excitatory conductances evoked by square-wave stimuli (Fig.4C) showed a low-pass tuning, which did not match the band-pass tuning of the spikes measured with inhibition intact (Fig.4A). Possibly, excitatory currents were enhanced at low temporal frequencies with inhibition blocked because amacrine cell feedback normally suppresses responses at these frequencies. Furthermore, the tuning function for the spike response presumably includes influences of disinhibition, which could enhance the response at high temporal frequencies (Fig.3C). The process of spike generation can also enhance high temporal frequencies (Lankheet et al. 1989; Zaghloul et al. 2005). Our strongest conclusion from the recordings with inhibition suppressed relates to the temporal properties of the two excitatory conductances, which clearly show a similar ability to follow high temporal frequencies (∼9–18 Hz) with minimal relative delays (Fig.5).
Limits of NMDAR kinetics in sensory neurons
Analysis of recombinant NMDAR channels sets the temporal limit of the fastest channels – those composed of GluN2A subunits – as ∼5 Hz at room temperature (Erreger et al. 2005). This limitation is largely explained by the fast component of deactivation (tau = 32 ms; Erreger et al. 2005). Assuming a Q10 of ∼2–3, inactivation is probably accelerated significantly at the elevated temperatures used here, explaining the fast NMDAR-mediated currents we recorded in ganglion cells. Furthermore, the recombinant channels studied were composed of the NR1a splice variant (Erreger et al. 2005) whereas ganglion cells might express the faster NR1b variant (Rumbaugh et al. 2000). The OFF Delta cell appeared to express GluN2B subunits, because NMDAR-mediated currents showed ifenprodil sensitivity (Manookin et al. 2010). It now seems likely that these cells express triheteromeric GluN1/GluN2A/GluN2B receptors, which would explain both their ifenprodil sensitivity and their relatively fast responses to contrast modulation (Tovar et al. 2013; Hansen et al. 2014).
Auditory neurons also seem to express NMDAR channels with fast kinetics, although the ability of NMDAR-mediated conductances to be modulated at 10 Hz specifically has not been tested (Sanchez et al. 2010). Furthermore, there is in vivo evidence from goldfish Mauthner cells of NMDAR-mediated responses with fast deactivation kinetics (tau ∼ 1 ms) at room temperature (Wolszon et al. 1997).
Fast kinetics of NMDARs in OFF ganglion cells could impair the receptor's ability to generate long-lasting changes in synaptic strength or maintenance; such a role for NMDARs in the retina, however, may be less important for OFF cells than for ON cells (Barria and Malinow, 2005; Jones et al. 2012). The primary role for NMDARs in the OFF ganglion cells studied here is working with AMPARs to generate the basic excitatory synaptic responses to bipolar cell outputs across a wide range of frequencies. These dual mechanisms for excitatory synaptic transmission are supplemented further by inhibitory pathways, which, through disinhibitory mechanisms, reinforce the depolarizing drive at light decrements (Figs2 and 3; Manookin et al. 2008; van Wyk et al. 2009). During depolarization, the reduced driving force of AMPARs would be offset by the increased conductance or driving force associated with NMDARs and disinhibition, respectively.
Glossary
- AMPAR
AMPA receptor
- I–V
current-voltage
- NMDAR
NMDA receptor
- RF
receptive field
Key points
In most areas of the brain, NMDA-type glutamate receptors (NMDARs) exhibit slower kinetics than do AMPA-type receptors (AMPARs).
Most retinal ganglion cells express a combination of AMPARs and NMDARs, but whether NMDAR kinetics limit temporal encoding of light stimulation is not well understood.
In this study, we measured AMPAR- and NMDAR-mediated conductances evoked by visual stimulation in two types of guinea pig retinal ganglion cell.
In both cell types, AMPAR- and NMDAR-mediated responses encoded rapidly varying contrast modulation within the physiological range (up to 18 temporal cycles s–1).
In retinal ganglion cells, NMDARs and AMPARs act together to encode a wide range of temporal frequencies, suggesting that NMDARs in some sensory neurons have relatively fast kinetics.
Additional information
Competing interests
The authors declare no competing interests.
Author contributions
Experiments were conceived and designed by B.K.S. and J.B.D. with input from M.B.M. and J.H.S. Data were collected and analysed by B.K.S. The article was written by B.K.S. and J.B.D. with additional input from M.B.M. and J.H.S.
Funding
This study was supported by NIH grants EY014454, EY017836 and F32-EY021063; Core Grant EY07003 to the University of Michigan; and unrestricted grants from Research to Prevent Blindness to University of Michigan and Yale University
References
- Barria A, Malinow R. NMDA receptor subunit composition controls synaptic plasticity by regulating binding to CaMKII. Neuron. 2005;48:289–301. doi: 10.1016/j.neuron.2005.08.034. &. [DOI] [PubMed] [Google Scholar]
- Borghuis BG, Marvin JS, Looger LL, Demb JB. Two-photon imaging of nonlinear glutamate release dynamics at bipolar cell synapses in the mouse retina. J Neurosci. 2013;33:10972–10985. doi: 10.1523/JNEUROSCI.1241-13.2013. &. [DOI] [PMC free article] [PubMed] [Google Scholar]
- Borghuis BG, Looger LL, Tomita S, Demb JB. Kainate receptors mediate signaling in both transient and sustained OFF bipolar cell pathways in mouse retina. J Neurosci. 2014;34:6128–6139. doi: 10.1523/JNEUROSCI.4941-13.2014. &. [DOI] [PMC free article] [PubMed] [Google Scholar]
- Buldyrev I, Puthussery T, Taylor WR. Synaptic pathways that shape the excitatory drive in an OFF retinal ganglion cell. J Neurophysiol. 2012;107:1795–1807. doi: 10.1152/jn.00924.2011. &. [DOI] [PMC free article] [PubMed] [Google Scholar]
- Chen S, Diamond JS. Synaptically released glutamate activates extrasynaptic NMDA receptors on cells in the ganglion cell layer of rat retina. J Neurosci. 2002;22:2165–2173. doi: 10.1523/JNEUROSCI.22-06-02165.2002. &. [DOI] [PMC free article] [PubMed] [Google Scholar]
- Crook JD, Packer OS, Dacey DM. A synaptic signature for ON-and OFF-center parasol ganglion cells of the primate retina. Vis Neurosci. 2014;31:57–84. doi: 10.1017/S0952523813000461. &. [DOI] [PMC free article] [PubMed] [Google Scholar]
- Demb JB, Singer JS. Intrinsic properties and functional circuitry of the AII amacrine cell. Vis Neurosci. 2012;29:51–60. doi: 10.1017/S0952523811000368. &. [DOI] [PMC free article] [PubMed] [Google Scholar]
- Demb JB, Zaghloul K, Haarsma L, Sterling P. Bipolar cells contribute to nonlinear spatial summation in the brisk-transient (Y) ganglion cell in mammalian retina. J Neurosci. 2001;21:7447–7454. doi: 10.1523/JNEUROSCI.21-19-07447.2001. &. [DOI] [PMC free article] [PubMed] [Google Scholar]
- Diamond JS, Copenhagen DR. The contribution of NMDA and non-NMDA receptors to the light-evoked input–output characteristics of retinal ganglion cells. Neuron. 1993;11:725–738. doi: 10.1016/0896-6273(93)90082-3. &. [DOI] [PubMed] [Google Scholar]
- Erreger K, Dravid SM, Banke TG, Wyllie DJA, Traynelis SF. Subunit-specific gating controls rat NR1/NR2A and NR1/NR2B NMDA channel kinetics and synaptic signalling profiles. J Physiol. 2005;563:345–358. doi: 10.1113/jphysiol.2004.080028. &. [DOI] [PMC free article] [PubMed] [Google Scholar]
- Euler T, Detwiler PB, Denk W. Directionally selective calcium signals in dendrites of starburst amacrine cells. Nature. 2002;418:845–852. doi: 10.1038/nature00931. &. [DOI] [PubMed] [Google Scholar]
- Flores-Herr N, Protti DA, Wässle H. Synaptic currents generating the inhibitory surround of ganglion cells in the mammalian retina. J Neurosci. 2001;21:4852–4863. doi: 10.1523/JNEUROSCI.21-13-04852.2001. &. [DOI] [PMC free article] [PubMed] [Google Scholar]
- Freed M, Sterling P. The ON-alpha ganglion cell of the cat retina and its presynaptic cell types. J Neurosci. 1988;8:2303–2303. doi: 10.1523/JNEUROSCI.08-07-02303.1988. &. [DOI] [PMC free article] [PubMed] [Google Scholar]
- Fried SI, Münch TA, Werblin FS. Mechanisms and circuitry underlying directional selectivity in the retina. Nature. 2002;420:411–414. doi: 10.1038/nature01179. &. [DOI] [PubMed] [Google Scholar]
- Grimes WN, Seal RP, Oesch N, Edwards RH, Diamond JS. Genetic targeting and physiological features of VGLUT3+ amacrine cells. Vis Neurosci. 2011;28:381–392. doi: 10.1017/S0952523811000290. &. [DOI] [PMC free article] [PubMed] [Google Scholar]
- Gustafson EC, Stevens ER, Wolosker H, Miller RF. Endogenous d-serine contributes to NMDA-receptor-mediated light-evoked responses in the vertebrate retina. J Neurophysiol. 2007;98:122–130. doi: 10.1152/jn.00057.2006. &. [DOI] [PubMed] [Google Scholar]
- Hansen KB, Ogden KK, Yuan H, Traynelis SF. Distinct functional and pharmacological properties of Triheteromeric GluN1/GluN2A/GluN2B NMDA receptors. Neuron. 2014;81:1084–1096. doi: 10.1016/j.neuron.2014.01.035. &. [DOI] [PMC free article] [PubMed] [Google Scholar]
- Jones RS, Carroll RC, Nawy S. Light-induced plasticity of synaptic AMPA receptor composition in retinal ganglion cells. Neuron. 2012;75:467–478. doi: 10.1016/j.neuron.2012.05.030. &. [DOI] [PMC free article] [PubMed] [Google Scholar]
- Kalbaugh TL, Zhang J, Diamond JS. Coagonist release modulates NMDA receptor subtype contributions at synaptic inputs to retinal ganglion cells. J Neurosci. 2009;29:1469–1479. doi: 10.1523/JNEUROSCI.4240-08.2009. &. [DOI] [PMC free article] [PubMed] [Google Scholar]
- Kolb H, Nelson R. OFF-alpha and OFF-beta ganglion cells in cat retina: II. Neural circuitry as revealed by electron microscopy of HRP stains. J Comp Neurol. 1993;329:85–110. doi: 10.1002/cne.903290107. &. [DOI] [PubMed] [Google Scholar]
- Lankheet MJ, Molenaar J, van de Grind WA. Frequency transfer properties of the spike generating mechanism of cat retinal ganglion cells. Vision Res. 1989;29:1649–1661. doi: 10.1016/0042-6989(89)90147-8. &. [DOI] [PubMed] [Google Scholar]
- Manookin MB, Beaudoin DL, Ernst ZR, Flagel LJ, Demb JB. Disinhibition combines with excitation to extend the operating range of the OFF visual pathway in daylight. J Neurosci. 2008;28:4136–4150. doi: 10.1523/JNEUROSCI.4274-07.2008. &. [DOI] [PMC free article] [PubMed] [Google Scholar]
- Manookin MB, Weick M, Stafford BK, Demb JB. NMDA receptor contributions to visual contrast coding. Neuron. 2010;67:280–293. doi: 10.1016/j.neuron.2010.06.020. &. [DOI] [PMC free article] [PubMed] [Google Scholar]
- Masland RH. The neuronal organization of the retina. Neuron. 2012;76:266–280. doi: 10.1016/j.neuron.2012.10.002. [DOI] [PMC free article] [PubMed] [Google Scholar]
- Mazade RE, Eggers ED. Light adaptation alters the source of inhibition to the mouse retinal OFF pathway. J Neurophysiol. 2013;110:2113–2128. doi: 10.1152/jn.00384.2013. &. [DOI] [PMC free article] [PubMed] [Google Scholar]
- Mittman S, Taylor WR, Copenhagen DR. Concomitant activation of two types of glutamate receptor mediates excitation of salamander retinal ganglion cells. J Physiol. 1990;428:175–197. doi: 10.1113/jphysiol.1990.sp018206. &. [DOI] [PMC free article] [PubMed] [Google Scholar]
- Ng D, Pitcher GM, Szilard RK, Sertié A, Kanisek M, Clapcote SJ, Lipina T, Kalia LV, Joo D, McKerlie C, Cortez M, Roder JC, Salter MW, McInnes RR. Neto1 is a novel CUB-domain NMDA receptor-interacting protein required for synaptic plasticity and learning. PLoS Biol. 2009;7:e41. doi: 10.1371/journal.pbio.1000041. &. [DOI] [PMC free article] [PubMed] [Google Scholar]
- Park SJ, Kim IJ, Looger LL, Demb JB, Borghuis BG. Excitatory synaptic inputs to mouse on-off direction-selective retinal ganglion cells lack direction tuning. J Neurosci. 2014;34:3976–3981. doi: 10.1523/JNEUROSCI.5017-13.2014. &. [DOI] [PMC free article] [PubMed] [Google Scholar]
- Poleg-Polsky A, Diamond JS. Imperfect space clamp permits electrotonic interactions between inhibitory and excitatory synaptic conductances, distorting voltage clamp recordings. PLoS ONE. 2011;6:e19463. doi: 10.1371/journal.pone.0019463. &. [DOI] [PMC free article] [PubMed] [Google Scholar]
- Rumbaugh G, Prybylowski K, Wang JF, Vicini S. Exon 5 and spermine regulate deactivation of NMDA receptor subtypes. J Neurophysiol. 2000;83:1300–1306. doi: 10.1152/jn.2000.83.3.1300. &. [DOI] [PubMed] [Google Scholar]
- Russell TL, Werblin FS. Retinal synaptic pathways underlying the response of the rabbit local edge detector. J Neurophysiol. 2010;103:2757–2769. doi: 10.1152/jn.00987.2009. &. [DOI] [PMC free article] [PubMed] [Google Scholar]
- Sagdullaev BT, McCall MA, Lukasiewicz PD. Presynaptic inhibition modulates spillover, creating distinct dynamic response ranges of sensory output. Neuron. 2006;50:923–935. doi: 10.1016/j.neuron.2006.05.015. &. [DOI] [PubMed] [Google Scholar]
- Sagdullaev BT, Eggers ED, Purgert R, Lukasiewicz PD. Nonlinear interactions between excitatory and inhibitory retinal synapses control visual output. J Neurosci. 2011;31:15102–15112. doi: 10.1523/JNEUROSCI.1801-11.2011. &. [DOI] [PMC free article] [PubMed] [Google Scholar]
- Sanchez JT, Wang Y, Rubel EW, Barria A. Development of glutamatergic synaptic transmission in binaural auditory neurons. J Neurophysiol. 2010;104:1774–1789. doi: 10.1152/jn.00468.2010. &. [DOI] [PMC free article] [PubMed] [Google Scholar]
- Schwartz GW, Okawa H, Dunn FA, Morgan JL, Kerschensteiner D, Wong RO, Rieke F. The spatial structure of a nonlinear receptive field. Nat Neurosci. 2012;15:1572–1580. doi: 10.1038/nn.3225. &. [DOI] [PMC free article] [PubMed] [Google Scholar]
- Sethuramanujam S, Slaughter MM. Disinhibitory rectruitment of NMDA receptor pathways in retina. J Neurophysiol. 2014;112:193–203. doi: 10.1152/jn.00817.2013. &. [DOI] [PMC free article] [PubMed] [Google Scholar]
- Slaughter MM, Miller RF. 2-amino-4-phosphonobutyric acid: a new pharmacological tool for retina research. Science. 1981;211:182–185. doi: 10.1126/science.6255566. &. [DOI] [PubMed] [Google Scholar]
- Steinert JR, Postlethwaite M, Jordan MD, Chernova T, Robinson SW, Forsythe ID. NMDAR-mediated EPSCs are maintained and accelerate in time course during maturation of mouse and rat auditory brainstem in vitro. J Physiol. 2010;588:447–463. doi: 10.1113/jphysiol.2009.184317. &. [DOI] [PMC free article] [PubMed] [Google Scholar]
- Stevens JK, McGuire BA, Sterling P. Toward a functional architecture of the retina: serial reconstruction of adjacent ganglion cells. Science. 1980;207:317–319. doi: 10.1126/science.7350663. &. [DOI] [PubMed] [Google Scholar]
- Tovar KR, McGinley MJ, Westbrook GL. Triheteromeric NMDA receptors at hippocampal synapses. J Neurosci. 2013;33:9150–9160. doi: 10.1523/JNEUROSCI.0829-13.2013. &. [DOI] [PMC free article] [PubMed] [Google Scholar]
- Traynelis SF, Wollmuth LP, McBain CJ, Menniti FS, Vance KM, Ogden KK, Hansen KB, Yuan H, Myers SJ, Dingledine R. Glutamate receptor ion channels: structure, regulation, and function. Pharmacol Rev. 2010;62:405–496. doi: 10.1124/pr.109.002451. &. [DOI] [PMC free article] [PubMed] [Google Scholar]
- van Wyk M, Wässle H, Taylor WR. Receptive field properties of ON- and OFF-ganglion cells in the mouse retina. Vis Neurosci. 2009;26:297–308. doi: 10.1017/S0952523809990137. &. [DOI] [PMC free article] [PubMed] [Google Scholar]
- Vaney DI, Sivyer B, Taylor WR. Direction selectivity in the retina: symmetry and asymmetry in structure and function. Nat Rev Neurosci. 2012;13:194–208. doi: 10.1038/nrn3165. &. [DOI] [PubMed] [Google Scholar]
- Venkataramani S, Taylor WR. Orientation selectivity in rabbit retinal ganglion cells is mediated by presynaptic inhibition. J Neurosci. 2010;30:15664–15676. doi: 10.1523/JNEUROSCI.2081-10.2010. &. [DOI] [PMC free article] [PubMed] [Google Scholar]
- Venkataramani S, van Wyk M, Buldyrev I, Sivyer B, Vaney DI, Taylor WR. Distinct roles for inhibition in spatial and temporal tuning of local edge detectors in rabbit retina. PLoS ONE. 2014;9:e88560. doi: 10.1371/journal.pone.0088560. &. [DOI] [PMC free article] [PubMed] [Google Scholar]
- Williams SR, Mitchell SJ. Direct measurement of somatic voltage clamp errors in central neurons. Nat Neurosci. 2008;11:790–798. doi: 10.1038/nn.2137. &. [DOI] [PubMed] [Google Scholar]
- Wolszon LR, Pereda AE, Faber DS. A fast synaptic potential mediated by NMDA and non-NMDA receptors. J Neurophysiol. 1997;78:2693–2706. doi: 10.1152/jn.1997.78.5.2693. &. [DOI] [PubMed] [Google Scholar]
- Yan D, Tomita S. Defined criteria for auxiliary subunits of glutamate receptors. J Physiol. 2012;590:21–31. doi: 10.1113/jphysiol.2011.213868. &. [DOI] [PMC free article] [PubMed] [Google Scholar]
- Yonehara K, Farrow K, Ghanem A, Hillier D, Balint K, Teixeira M, Jüttner J, Noda M, Neve RL, Conzelmann KK, Roska B. The first stage of cardinal direction selectivity is localized to the dendrites of retinal ganglion cells. Neuron. 2013;79:1078–1085. doi: 10.1016/j.neuron.2013.08.005. &. [DOI] [PubMed] [Google Scholar]
- Zaghloul KA, Boahen K, Demb JB. Contrast adaptation in subthreshold and spiking responses of mammalian Y-type retinal ganglion cells. J Neurosci. 2005;25:860–868. doi: 10.1523/JNEUROSCI.2782-04.2005. &. [DOI] [PMC free article] [PubMed] [Google Scholar]
- Zhang J, Diamond JS. Subunit- and pathway-specific localization of NMDA receptors and scaffolding proteins at ganglion cell synapses in rat retina. J Neurosci. 2009;29:4274–428. doi: 10.1523/JNEUROSCI.5602-08.2009. &. [DOI] [PMC free article] [PubMed] [Google Scholar]