

Abstract
GABA is the major inhibitory transmitter in the brain and is released not only from a subset of neurons but also from glia. Although neuronal GABA is well known to be synthesized by glutamic acid decarboxylase (GAD), the source of glial GABA is unknown. After estimating the concentration of GABA in Bergmann glia to be around 5–10 mm by immunogold electron microscopy, we demonstrate that GABA production in glia requires MAOB, a key enzyme in the putrescine degradation pathway. In cultured cerebellar glia, both Ca2+-induced and tonic GABA release are significantly reduced by both gene silencing of MAOB and the MAOB inhibitor selegiline. In the cerebellum and striatum of adult mice, general gene silencing, knock out of MAOB or selegiline treatment resulted in elimination of tonic GABA currents recorded from granule neurons and medium spiny neurons. Glial-specific rescue of MAOB resulted in complete rescue of tonic GABA currents. Our results identify MAOB as a key synthesizing enzyme of glial GABA, which is released via bestrophin 1 (Best1) channel to mediate tonic inhibition in the brain.
Introduction
Recent studies suggest that glia cooperate closely with neurons and actively participate in the regulation of synaptic transmission. Among the various types of glia, astrocytes make direct contact with neurons and form tripartite synapses, where astrocytic processes are in close association with the presynapse and postsynapse at the synaptic junction (Araque et al. 1999; Grosche et al. 1999). In addition, astrocytes express diverse receptors for corresponding neurotransmitters and release various gliotransmitters and neuroactive molecules (Volterra & Meldolesi, 2005; Fiacco & McCarthy, 2006; Rousse & Robitaille, 2006). Several gliotransmitters such as glutamate, ATP and d-serine have recently been extensively characterized (Haydon & Carmignoto, 2006; Oliet & Mothet, 2006). However, the precise role of the gliotransmitter GABA has not yet been well established.
GABA is considered to be the major inhibitory neurotransmitter that is synthesized and released from GABAergic neurons in the brain. The primary source of GABA in the brain is known to be glutamate which undergoes enzymatic conversion to GABA by GAD. GAD is exclusively expressed in a distinct population of neurons but rarely in glia, which has led to the notion that glial cells do not synthesize GABA. However, it was recently reported that GABA is enriched in hippocampal astrocytes (Le Meur et al. 2012), Bergmann glia and lamellar astrocytes of the cerebellum, where they are released via Best1 channels to cause tonic inhibition (Lee et al. 2010; Yoon et al. 2011). What is more remarkable is that the amount of glial GABA is variable depending on the brain region and is highly correlated with the degree of tonic inhibition in the hippocampal CA1 and cerebellum (Yoon et al. 2011). Furthermore, cultured human astrocytes have been shown to release GABA (Lee et al. 2011). These observations raise the next set of questions: how much GABA do glia contain and how do they acquire GABA in the first place?
Tonic inhibition was first identified in the cerebellum, where it is particularly prominent (Brickley et al. 1996). More recent studies have described the existence of tonic inhibition in various brain regions including the hippocampus and thalamus (Nusser & Mody, 2002; Stell & Mody, 2002; Semyanov et al. 2004; Jia et al. 2005). So far, tonic inhibition has been identified in diverse brain regions such as dentate gyrus granule cells (Nusser & Mody, 2002; Stell & Mody, 2002), thalamocortical neurons in the thalamus (Cope et al. 2005), pyramidal neurons in the neocortex (Yamada et al. 2007), D1- and D2-expressing MSNs in the striatum (Ade et al. 2008) and neurons of the motor cortex (Clarkson et al. 2010). Moreover, tonic inhibition plays important physiological and pathological roles in neuronal information processing (Chadderton et al. 2004) and has been implicated in epilepsy, motor impairment, sleep, memory and cognition (Caraiscos et al. 2004; Hanchar et al. 2005; Jia et al. 2005; Cope et al. 2009; Egawa et al. 2012). Recently, tonic inhibition in the striatum has been proposed to play potential pathophysiological roles in MSN excitability and in Huntington's disease (Cepeda et al. 2013). Despite the pathophysiological importance of tonic inhibition, it has been difficult to manipulate tonic GABA release, mainly due to the lack of information regarding the source of tonic GABA release.
In this study, we employed multidisciplinary approaches including immunohistochemistry, Western blot analysis, immunogold electron microscopy, the sniffer patch technique, colorimetric enzyme assay, pharmacological and cell-type-specific gene-silencing tools and slice patch clamping to demonstrate that striatal and cerebellar glia utilize the putrescine degradation pathway via MAOB to synthesize GABA, which is then released to elicit tonic currents in granule cells and MSNs.
Methods
Animals
Adult (aged 8–10 weeks) male or female wild-type, GFAP-GFP and hGFAP-CreERT2 genotypes of C57BL/6 mice were used. Best1-deficient (BalbC strain), MAOB-deficient (129/SvImJ strain) and their wild-type littermate mice were used. Both male and female of all mice were used. All experimental procedures described below were performed in accordance with the Institutional guidelines for experimental animal care and use of the Korea Institute of Science and Technology (KIST; Seoul, Korea).
MAOB-shRNA and lentivirus production
The MAOB shRNA sequence (antisense) is AATCGTAAGATACGATTCTGG. For lentivirus-based shRNA expression, a lentiviral vector containing the MAOB-shRNA gene was constructed into the HpaI–XhoI restriction enzyme sites of the pSicoR lentiviral vector.
Electron microscopic immunohistochemistry
GFAP-GFP transgenic mice weighing 20–25 g were used for this study. For tissue fixation, mice were deeply anaesthetized with sodium pentobarbital (80 mg kg−1, i.p.) and perfused transcardially with 10 ml of heparinized normal saline, followed by 50 ml of a freshly prepared mixture of 4% paraformaldehyde and 0.01% or 0.5% glutaraldehyde in 0.1 m phosphate buffer (PB), at pH 7.4. The cerebellum was removed and postfixed in the same fixative for 2 h at 4°C. Sections of 60 μm were cut sagittally on a Vibratome and cryoprotected overnight in 30% sucrose in PB at 4°C. Sections were frozen on dry ice for 20 min and thawed in phosphate-buffered saline (PBS; 0.01 m, pH 7.2) to enhance penetration. They were pretreated with 1% sodium borohydride for 30 min to quench glutaraldehyde, were then blocked with 3% H2O2 for 10 min to suppress endogenous peroxidases and then perfused/treated with 10% normal donkey serum (NDS, Jackson ImmunoResearch, West Grove, PA, USA) for 30 min to mask secondary antibody binding sites.
Analysis for electron microscopic immunohistochemistry
For quantitative analysis, electron micrographs were taken at x30,000 magnification in the area (μm2) of Bergmann glial cells showing GFP immunoreactivity from thin sections incubated with GABA antiserum for each of the three GFAP-GFP mice. To assess immunoreactivity for GABA, gold particle density (number of gold particles per unit area) of each axon terminal adjacent to Bergmann glial cells was compared with that of Bergmann glial cells. Axon terminals were considered immunopositive if gold particle density over the vesicle-containing areas was at least five times higher than that in the control axon terminals, which were defined as axon terminals containing spherical vesicles and showing an asymmetric type of synaptic contact with a prominent postsynaptic density. Immunogold labelling over mitochondrial profiles was excluded from the analysis. Measurements were performed on micrographs using a digitizing tablet and ImageJ software (NIH, Bethesda, MD, USA). Statistical analysis was performed by analysis of variance (ANOVA) and mean values were compared via Scheffe's F test. Significance was set at P < 0.05.
Immunohistochemistry
Adult mice were deeply anaesthetized with 2% avertin (20 μl g–1) and perfused with 0.1 m phosphate-buffered saline (PBS) followed by ice-cold 4% paraformaldehyde (PFA). Excised brains were postfixed overnight in 4% PFA at 4°C and immersed in 30% sucrose for 48 h for cryoprotection. Parasagittal cerebellar sections (30 μm) were cut with a cryostat, rinsed three times in PBS, and incubated for 1 h with blocking solution (0.3% Triton-X, 2% normal serum in 0.1 m PBS). Sections were incubated overnight in a mixture of the following primary antibodies for GFAP-GFP mice with blocking solution at 4°C on a shaker: rabbit anti-MAOB antibody (1:50; Levitt et al. 1982), mouse monoclonal anti-putrescine antibody (1:50; Fujiwara et al. 2001), chicken anti-GFP antibody (1:1000) and guinea-pig anti-GABA antibody (1:1000) (Lee et al. 2010). After washing three times in PBS, sections were incubated with the corresponding secondary antibodies: conjugated Alexa 555 goat anti-rabbit IgG (1:200), Alexa 488 conjugated goat anti-chicken IgG (1:200) and conjugated Alexa 647 goat anti-guinea-pig (1:200), for 1.5 h. Following this, sections were rinsed three times in PBS and then mounted with fluorescent mounting medium. A series of fluorescence images was obtained with a Nikon (A1R) confocal microscope and images were processed for later analysis using NIS-Elements imaging software.
For analysis of immunohistochemical data in GFAP-GFP mouse, the GFAP-positive regions or pixels were defined by thresholding and converting the GFAP-GFP image into a binary mask: a pixel with sufficient GFAP-GFP fluorescence was assigned a value of 1 and other pixels with subthreshold intensity were assigned a value of 0. Then the GFAP-GFP-positive pixels were analysed for GABA or MAOB staining intensity by multiplying the GABA image times the binary mask image. Average pixel value was used to define glial expression of GABA. A similar procedure was used to analyse GFAP-GFP-negative pixels to define non-glial (or neuronal) expression of GABA.
Western blot analysis
Gene silencing efficiency of MAOB-shRNA was tested by Western blotting. To observe shRNA-mediated inhibition of MAOB expression, cultured cerebellar astrocytes were infected with lentivirus carrying pSicoR-scrambled-shRNA or pSicoR-MAOB-shRNA. After 48–72 h of incubation, cells were lysed with RIPA buffer. Then 30 μg of proteins were separated by SDS–PAGE using 10% gels and blotted onto PVDF membranes. The blots were incubated overnight at 4°C with anti-MAOB antibody (1:4000; Santa Cruz Biotechnology, Dallas, TX, USA). Blots were then washed and incubated with horseradish peroxidase-conjugated goat anti-mouse or anti-rabbit IgG, followed by washing and detection of immunoreactivity with enhanced chemiluminescence (Amersham Biosciences, Piscataway, NJ, USA). The band intensity was acquired and analysed by ImageQuant LAS 4000 (General Electric Company, Fairfield, CT, USA).
Sniffer patch
The sniffer patch consisted of Fura-2 Ca2+ imaging of cultured cerebellar astrocytes and current recording from HEK293T cells expressing GABACR. To release GABA from astrocytes, protease activated receptor 1 (PAR-1) was activated by pressure application of TFLLR peptide. On the day of experiment, cultured mouse astrocytes (HEK293T cells added) were incubated with 5 mm Fura-2 AM (mixed with 5 ml of 20% pluronic acid; Invitrogen, Grand Island, NY, USA) for 40 min, washed at room temperature and subsequently transferred to the microscope stage for imaging. External solution contained (in mm): 150 NaCl, 10 Hepes, 3 KCl, 2 CaCl2, 2 MgCl2, and 5.5 glucose (pH adjusted to pH 7.3 and osmolality adjusted to 325 mosmol kg−1). Intensity images of 510 nm wavelength were taken at 340 nm and 380 nm excitation wavelengths by using iXon EMCCD (ANDOR, Belfast, NIR, UK). The two resulting images were used for ratio calculations in Imaging Workbench version 6.2 (Indec Systems, Santa Clara, CA, USA). GABACR-mediated currents were recorded from HEK293T cells under voltage clamp (Vh = –70 mV) using Multiclamp 700B amplifier acquired with pClamp 9.2 (Molecular Devices, Sunnyvale, CA, USA). Recording electrodes (4–7MU) were filled with (mm): 110 caseium gluconate, 30 CsCl, 0.5 CaCl2, 10 Hepes, 4 Mg-ATP, 0.3 Na3-GTP, and 10 BAPTA (pH adjusted to 7.3 with CsOH and osmolality adjusted to 290–310 mosmol kg−1 with sucrose). For simultaneous recording, Imaging Workbench was synchronized with pClamp 9.2.
Slice recording
Animals were deeply anaesthetized with halothane. After decapitation, the brain was quickly excised from the skull and submerged in ice-cold cutting solution that contained (in mm): 250 sucrose, 26 NaHCO3, 10 d(+)-glucose, 4 MgCl2, 3 myo-inositol, 2.5 KCl, 2 sodium pyruvate, 1.25 NaH2PO4, 0.5 ascorbic acid, 0.1 CaCl2, and 1 kynurenic acid, pH 7.4. Whole solution was gassed with 95% O2–5% CO2. After trimming the cerebellar and striatal brain, 250 μm parasagittal slices were cut using a microtome and transferred to extracellular ACSF solution (in mm): 126 NaCl, 24 NaHCO3, 1 NaH2PO4, 2.5 KCl, 2.5 CaCl2, 2 MgCl2, and 10 d(+)-glucose, pH 7.4.
Slices were incubated at room temperature for at least one hour prior to recording. Slices were transferred to a recording chamber that was continuously perfused with ASCF solution (flow rate = 2 ml min−1). The slice chamber was mounted on the stage of an upright Olympus microscope and viewed with a ×60 water immersion objective lens (NA = 0.90) with infrared differential interference contrast optics. Cellular morphology was visualized by CCD camera and Axon Imaging Workbench software. Whole-cell recordings were made from granule cell somata located in lobules 2–5. The holding potential was –70 mV. Pipette resistance was typically 8–10 MΩ for granule cells and the pipette was filled with an internal solution (in mm): 135 CsCl, 4 NaCl, 0.5 CaCl2, 10 Hepes, 5 EGTA, 2 Mg-ATP, 0.5 Na2-GTP, 10 QX-314, pH adjusted to 7.2 with CsOH (278–285 mosmol). Electrical signals were digitized and sampled at 50 μs intervals with Digidata 1440A and Multiclamp 700B amplifier (Molecular Devices) using pCLAMP 10.2 software. Data were filtered at 2 kHz.
Virus injection and Cre activation for glia-specific gene rescue
Mice (6–7 weeks old) were anaesthetized by intraperitoneal injection of 2% avertin (20 μl g−1) and placed into stereotaxic frames. pSicoR-MAOB-shRNA-mCherry lentivirus was loaded into a microdispenser and injected into the cerebellar cortex and striatum at a rate of 0.2 μl min–1 (total 2 μl) using a syringe pump with a 25 μl syringe. The stereotaxic coordinates of the injection site for cerebellum were 1.7 mm away from the lambda and the depth was 1.5–1.7 mm beneath the skull and the site for striatum were 2 mm away from the bregma and the depth was 3 mm beneath the skull. Our glia-specific gene rescue strategy was based on flanking the MAOB-shRNA cassette with a pair of loxP sites, so that Cre-loxP recombination would cause excision of this cassette and inactivate MAOB-shRNA. By injecting this virus into a mouse cell line (hGFAP-CreERT2) that conditionally expresses Cre in glial cells only, we could selectively retain MAOB expression in glial cells. Glial-specific activation of CreERT2 was initiated by intraperitoneal injection of tamoxifen. For Cre activation, 1 mg of tamoxifen (dissolved in sunflower oil), or sunflower oil solvent as a control, was intraperitoneally injected for 5 days prior to MAOB-shRNA injection. All experiments were carried out under blind conditions: individuals performing the experiments were not told which types of shRNA had been injected until the experiments were finalized.
HPLC analysis for GABA release
The cerebellar primary astrocytes were cultured in 60 mm dishes for HPLC analysis. Prior to HPLC assay, astrocytes were washed with PBS three times. For the gene-silencing experiment, lentivirus containing Scrambled or MAOB-shRNA was introduced to the cells and incubated for 72 h. The amino acid content was derivatized with o-phthaldialdehyde (OPA) and detected using UV (DAD) detection. The OPA-derivatized samples obtained with an programmed autosampler were injected on Zorbax Eclipse Plus C18 column with detection at 338 nm (reference = 390 nm). Mobile phase A was 40 mm Na2HPO4 (pH 7.8) and phase B was acetonitrile–methanol–water (45:45:10, v/v/v). The flow rate was 2 ml min–1 with a gradient condition that allowed for 1.9 min at 0% B and a rise to 26% B over a 12.5 min step. Subsequent washing at 100% B and equilibration at 0% B was performed within a total retention time of 15 min. Reagents for OPA derivatization and all equipment for HPLC analysis were obtained from Agilent Technologies (Santa Clara, CA, USA).
Monoamine oxidase enzymatic activity assay
Mice were anaesthetized and then the brain was quickly excised from the skull and submerged in ice-cold cutting solution, which was the same as the cutting solution for tonic GABA recording. After cooling, the cerebellum was isolated. The fresh tissues from each mouse were homogenized, and large debris was removed by weak centrifugation. Next, the supernatant was collected and centrifuged at 13000 rpm for 20 min to obtain a mitochondrial fraction. The pellet was resuspended in phosphate buffer, and 20 μg were used in each well to determine the activity of the monoamine oxidase. Enzymatic activity of MAOA or MAOB was measured using an Amplex Red Monoamine oxidase Assay Kit (Molecular Probes, Eugene, OR, USA) according to the manufacturer's instructions. The kit includes 5× reaction buffer, Amplex Red reagent, horseradish peroxidase, DMSO, H2O2, ρ-tyramine (substrate of MAOA and B), benzylamine (substrate of MAOB), clogyline (inhibitor of MAOA), and pargyline (inhibitor of MAOB). After 2 h of enzyme reaction, absorbance at 570 nm was measured.
Data analysis and statistical analysis
Off-line analysis was carried out using Clampfit, SigmaPlot and Excel software. Numerical data are presented as means ± SEM. The significance of data for comparison was assessed using a Student's two-tailed unpaired t test and significance levels were displayed as: *P < 0.05, **P < 0.01, ***P < 0.001. Pearson's coefficient values provided measures of how the variations in both channels correlate, linked for whatever reason. The higher this figure, the more co-dependent both channels are. When the signal in one channel varies, the other one varies accordingly, increasing or decreasing proportionally. In other words, this coefficient measures any linear dependencies between the two colour channels. Negative values close to −1 account for exclusion, i.e. co-variation in opposite ways – when one signal increases, the other one decreases accordingly.
Results
Estimation of GABA concentration in Bergmann glia
To estimate the cytosolic concentration of GABA, we examined GABA levels in glial cells of GFAP-GFP transgenic mice that contain green fluorescent protein (GFP)-expressing astrocytes (Nolte et al. 2001). We did this with electron microscopy, using a gold-labelled antibody against GABA as previously described (Ottersen, 1989a, 1989b) (Fig.1A). In these mice, GFP was labelled with an antibody against GFP and staining with the 3,3′-diaminobenzidine colour reaction marked GFP-positive Bergmann glial cells. We found that Bergmann glial cells contained a significant amount of GABA (Fig.1A). For comparative quantification, we measured the gold particle density in GABAergic axon terminals, Bergmann glial cells and non-GABAergic axon terminals. Using GABAergic axon terminals as a reference, we found that the gold particle density of Bergmann glial cells was about one-tenth of that of GABAergic axon terminals (Fig.1B). Based on this ratio and the known concentration of GABA in GABAergic axon terminals of Purkinje cells (Fonnum and Walberg, 1973), we estimated the GABA concentration in Bergmann glial cells to be around 5–10 mm (Fig.1B).
Figure 1. Presence of GABA, independent of GAT activity, in Bergmann glial cells.
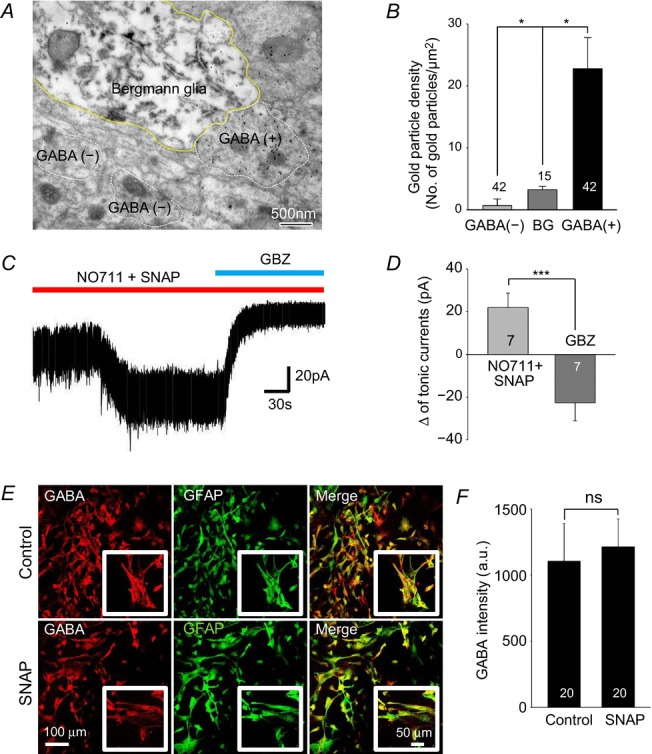
A, representative electron microscopy image using anti-GABA and anti-GFP antibodies in GFAP-GFP mouse: GABA is labelled with 15 nm gold particles and GFP is labelled with immunoperoxidase. GABA (+) represents GABAergic axon terminal. Bergmann glial cells are visualized by electron dense reaction product of immunoperoxidase. B, bar graph of gold particle density from electron microscopy images such as in A. C, tonic inhibition current recorded from granule cells in cerebellar slices from wild-type mouse after treating with GAT inhibitors, NO711 (10 μm, GAT1 inhibitor) and SNAP (25 μm, GAT3 inhibitor). D, magnitude of tonic current by gabazine (GBZ) and GAT inhibitors recorded in granule cells. E, immunocytochemistry for GABA (red), GFAP (green) and merged images from non-treated or SNAP (25 μm, 3 days)-treated cultured astrocytes. Inset shows magnified image. F, quantification of GABA intensity (a.u., arbitrary units). Asterisks indicate significant difference determined by paired two-tailed t test (*P < 0.05; ***P < 0.001). ns: non-significant difference.
GABA is synthesized by MAOB in glia
To determine the source of GABA in these glial cells, we considered several possibilities: (1) GABA may be taken up by GABA transporters (GATs; Henn & Hamberger, 1971) and retained if the catabolizing enzyme GABA-transaminase (GABA-T; Bardakdjian et al. 1979) is absent, (2) GABA may be synthesized by GAD in astrocytes (Martin & Rimvall, 1993) or (3) GABA synthesis via the less well-known putrescine degradation pathway may be occurring, which requires MAOB activity in the mammalian brain (Seiler & Al-Therib, 1974; Barres et al. 1990). Putrescine can also be converted to GABA by diamine oxidase (DAO), but we have only considered the MAO pathway here, as DAO expression in the brain is low (Caron et al. 1987).
GATs are widely expressed in astrocytes throughout the brain. GAT-1 and GAT-3 are known to be highly expressed in cerebellar glial cells (Itouji et al. 1996). Several studies proposed that Bergmann glial cells can release GABA by reverse mode transport of GABA by GAT (Barakat & Bordey, 2002; Heja et al. 2012). To investigate whether GABA transporters are involved in GABA uptake and subsequent tonic release of GABA in the cerebellum, we recorded tonic GABAA receptor-mediated currents from cerebellar granule cells. If GAT is directly mediating the release of GABA by the reverse mode transport, inhibiting GAT should block the tonic current. However, we found that GAT inhibitors NO711 and SNAP 5114 increased the tonic current (Fig.1C and D), indicating that GAT is not directly mediating the release of GABA in cerebellar glial cells. These observations are consistent with previous reports (Wall & Usowicz, 1997; Rossi et al. 2003). We next examined GABA content, using immunocytochemistry with an antibody against GABA in cultured cerebellar glial cells after treatment with the GAT inhibitor SNAP 5114 (Fig.1E). We found that treatment with the GAT inhibitor did not affect GABA immunoreactivity (Fig.1F), thus making GATs an unlikely source of GABA in cerebellar glial cells.
Cellular GABA content is regulated by the GABA catabolizing enzyme GABA-T, also known as 4-aminobutyrate aminotransferase (ABAT), which is present in most neurons and glial cells (Haynes, 1983). It is a mitochondrial enzyme that catalyses GABA into succinic semialdehyde and glutamate by transferring an amino group to GABA (Balazs et al. 1970). To assess the possibility that a lack of GABA catabolism may contribute to the source of GABA in cerebellar glial cells, we examined GABA-T expression levels in the cerebellum of GFAP-GFP mice. We found that GABA-T immunoreactivity in Bergmann glial cells was much less than that in neighbouring Purkinje cells (Fig.2A), suggesting that cerebellar glial cells lack this GABA catabolizing enzyme, which might contribute to better cellular retention of GABA.
Figure 2. Presence of MAOB and putrescine, but not GABA-T and GAD in Bergmann glial cells.
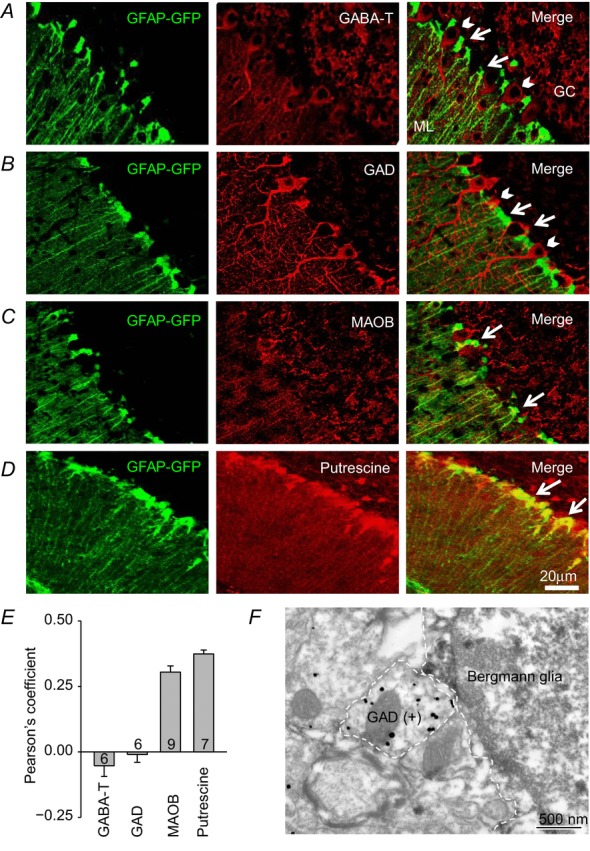
A–D, immunostaining for GABA-T (A), GAD (B), MAOB (C), and putrescine (D) in sections from GFAP-GFP transgenic mice (arrows: Bergmann glial cells, arrow heads: Purkinje cells, GC: granule cell layer, ML: molecular layer). E, Pearson's coefficient for GABA-T, GAD, MAOB and putrescine. F, representative electron microscopy image using anti-GAD (silver-gold labelling) and anti-GFP (electron dense, peroxidase labelling) antibodies in GFAP-GFP mice.
We then went on to investigate GABA synthesizing enzymes. Using immunohistochemistry and a pan antibody against both subtypes of GAD, GAD65 and GAD67, in GFAP-GFP mice, we first checked to see whether GAD is expressed in Bergmann glial cells. No trace of GAD expression was detected in GFP-positive glial cells, whereas GAD was strongly expressed in neighbouring neurons (Fig.2B). The lack of co-expression of GFP and GABA-T or GAD was clearly evident as a low or negative Pearson's coefficient, an indicator of the degree of co-localization between two fluorophores (Adler & Parmryd, 2010; Fig.2E). Consistent with these observations, immunogold labelling also revealed that Bergmann glial cells exhibited minimal expression of GAD while Purkinje neurons showed high GAD expression (Fig.2F). It is of interest that we found robust expression of MAOB and putrescine in GFP-positive Bergmann glial cells, as indicated by higher Pearson's coefficients (Fig.2C–E). These results are consistent with an earlier report that MAOB is selectively expressed in Bergmann glial cells and other glial cells but not in neurons (Levitt et al. 1982). Thus, GAD is not expressed, but both the enzyme and the substrate that is required for the breakdown of putrescine leading to the production of GABA are present in cerebellar glial cells. From these results, we hypothesized that MAOB is required for the production of GABA from putrescine in glial cells and that the synthesized GABA mediates tonic inhibition in cerebellum.
MAOB-shRNA effectively attenuates MAOB expression
To validate the proposed involvement of MAOB in GABA production in cerebellar glial cells, we generated a lentivirus carrying a short hairpin-forming interference RNA (shRNA) targeted against mouse MAOB. The knockdown efficiency of MAOB-shRNA was confirmed to be about 60% by Western blot analysis with cultured cerebellar glial cells (Fig.3A and B).
Figure 3. Inhibition and gene silencing of MAOB decrease Ca2+-dependent and basal GABA release in cultured astrocytes.
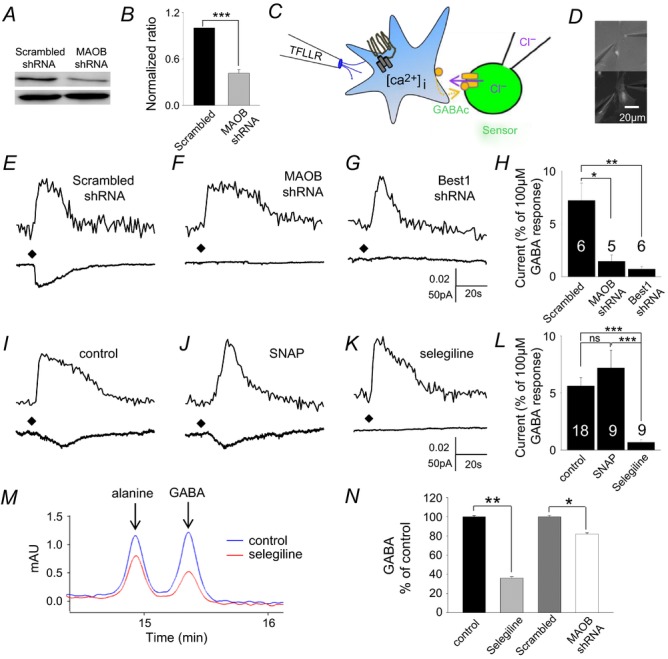
A, Western blot analysis of MAOB gene-silencing in cultured cerebellar astrocytes by infection with lentivirus carrying MAOB-shRNA or scrambled-shRNA. Upper band: MAOB; lower band: β actin. The rabbit antibody against MAOB was used at 1:4000 dilution for Western blot. B, MAOB-shRNA showed knockdown efficiency of 60% compared to the scrambled-shRNA. C, schematic illustration for sniffer-patch assay. Left pipette, pressure application of TFLLR, a selective agonist of PAR1 receptor. Right pipette, recording pipette for HEK293T cell expressing GABAc receptors (green). GABA released from cultured astrocyte (blue) upon TFLLR application. At the end of these experiments, GABAC receptors of the sensor cell were fully activated by bath application of GABA (100 μm) so that the response to released GABA could be normalized according to the number of GABA receptors expressed in the sensor cell. Time-dependent reductions in sensor cell currents are due to desensitization of GABAC receptors. D, picture of sniffer-patch assay. GABAc receptor expressed HEK293T cell (top) and shRNA transfected astrocyte (bottom). E–G and I–K, representative traces recorded from sniffer-patch assay from each condition. Upper trace, Ca2+ transient recorded from astrocyte. Lower trace, whole-cell current recorded from sensor cell (Vh = −70 mV) upon TFLLR pressure application. Diamond, TFLLR application (10 lbf in–2, 100 ms, 500 μm). E, scrambled shRNA; F, MAOB-shRNA; G, Best1-shRNA transfected astrocytes; I, control; J, SNAP (25 μm); K, selegiline (100 nm) for 1 day; H and L, summary bar graphs of GABA release measured in the indicated conditions, with values normalized as described above. Significance was determined by one-way ANOVA. M, merged raw traces of HPLC detection of tonic GABA release from treated cultured astrocytes incubated in PBS for 20 min after wash of selegiline (100 nm)-containing media or media alone for 3 days. The first non-GABA peak is OPA-derived alanine peak and it was not significantly affected by selegiline (Student's t test, P = 0.38). N, bar graphs show the averaged HPLC-detected GABA peak level. Compared to the control, selegiline and MAOB-shRNA treated cells showed decreased GABA release. This result would suggest that MAOB determines GABA content for tonic GABA release in glia. *P < 0.05; **P < 0.01; ***P < 0.001.
MAOB-synthesized and Best1-mediated glial GABA in the cerebellum
Using the MAOB shRNA we examined the effect of MAOB gene silencing on glial GABA content. We assessed GABA content from an individual cultured cerebellar glial cell by detecting Ca2+-dependent GABA release using a sniffer patch assay (Fig.3C and D). We found that gene silencing of MAOB effectively reduced Ca2+-dependent release of GABA from individual cerebellar astrocytes, compared with control scrambled-shRNA (Fig.3E, F and H). Previously we reported channel-mediated tonic GABA release via Best1 (Lee et al. 2010). Consistently, over-expression of Best1-shRNA also eliminated Ca2+-dependent release of GABA (Fig.3G and H). The basal GABA release in unstimulated cultured cerebellar astrocytes was also significantly decreased by over-expression of MAOB-shRNA in these cells (Fig.3F and H). MAOB activity can be selectively and irreversibly inhibited by a well-known inhibitor, selegiline. We treated cultured cerebellar astrocytes with 100 nm selegiline for 1 day and found that both Ca2+-dependent and basal GABA release were significantly decreased by selegiline treatment (Fig.3K–N). In addition, there was no effect by a GAT inhibitor on Ca2+-dependent release of GABA (Fig.3J and L), consistent with the lack of effect we observed from tonic current recordings (Fig.1C) and by immunocytochemistry (Fig.1E).
Next, we investigated whether oral administration of selegiline affected GABA content in cerebellar glial cells. We found that administration of drinking water containing selegiline (10 mg kg–1 day–1), over a 3 day period, completely inhibited MAOB enzyme activity (Fig.4A and B) without having any effect on monoamine oxidase A (MAOA) enzyme activity (Fig.4C).
Figure 4. Inhibition and gene silencing of MAOB abolish tonic current while glia-specific rescue of MAOB restores tonic inhibition in cerebellum.

A, experimental procedure for testing dose dependency of selegiline B and C, enzyme activity assay results from cerebellum after oral administration of selegiline (10 mg kg–1 day–1) for 3 days. D, effect of selegiline on MAOB activity in wild littermates and MAOB KO mice was measured from mitochondria-rich fraction which was prepared from mouse cerebellar homogenate. 20 mg of mitochondria-rich fraction was pre-incubated with various concentrations of selegiline for 1 h. Generation of H2O2 by MAOB activity was detected by colour change of the Amplex Red reagent. IC50 of selegiline was 1.68 nm with Hill coefficient of 1.43. E and F, enzyme activity assay results from cerebellum in wild littermates and MAOB KO mice. G and H, the tonic GABAA receptor-mediated currents of granule cells measured in control cerebellar slices and in slices from naïve mice treated for 1 h with selegiline (100 nm). GBZ: 10 μm GABAzine. I, magnitude of GABAzine sensitive tonic current recorded in granule cells treated as indicated. J and K, the tonic GABAA receptor-mediated currents of granule cells measured in cerebellar slices from naïve mice with scrambled shRNA or MAOB-shRNA virus injected. L, magnitude of GABAzine sensitive tonic current recorded granule cells treated as indicated. M and N, the tonic GABAA receptor-mediated currents of granule cells measured in cerebellar slices from wild littermates and MAOB KO mice. O, magnitude of GABAzine sensitive tonic current recorded granule cells treated as indicated. *P < 0.05; **P < 0.01; ***P < 0.001. ns: non-significant difference.
We further examined MAOB enzyme activity in MAOB knockout (KO) mice compared to wild-type (WT) littermates. We performed MAOB enzyme activity assays from cerebellar homogenates after treatment with various concentrations of selegiline for 1 h. MAOB KO mice showed a complete absence of MAOB enzyme activity at all concentrations of selegiline (Fig.4D and E). However, in WT littermates, we obtained a half-maximal inhibitory selegiline concentration (IC50) of 1.68 nm (Fig.4D). We also found that 100 nm selegiline was sufficient to fully inhibit MAOB activity in WT mice (Fig.4D). Compared to the absence of MAOB enzyme activity in MAOB KO (Fig.4E), MAOA enzyme activity was not changed in MAOB KO compared to WT (Fig.4F).
We then investigated the contribution of MAOB to tonic GABAA receptor-mediated currents in cerebellar granule neurons. The tonic current was measured as a current shift during treatment with the GABAA receptor antagonist, GABAzine (SR-95531; 10 μm). The GABAzine-sensitive tonic current recorded from cerebellar granule neurons was abolished in cerebellar slices treated with 100 nm selegiline for 1 h (Fig.4H and I) but not in control slices without selegiline (Fig.4G). This inhibitory effect of selegiline was similarly observed when mice were allowed to drink selegiline for 3 days (Fig.4I).
Furthermore, the tonic current was significantly decreased in mice injected with MAOB-shRNA lentivirus (Fig.4J–L), compared to mice injected with scrambled-shRNA virus (Fig.4J). This decreased tonic current was limited to virus-infected regions and was not seen in uninfected regions, indicating the specificity of shRNA virus (Fig.4L). The gene silencing effect of MAOB-shRNA was consistent with MAOB KO mice, which showed significantly reduced tonic currents (Fig.4N and O) compared to WT (Fig.4M). To rule out the possibility of neuronal involvement, we utilized a Cre-loxP-dependent cell-type-specific gene-silencing strategy (Ventura et al. 2004; Lee et al. 2010). In hGFAP-CreERT2 mice treated with MAOB-shRNA, GABAzine-sensitive tonic currents were significantly reduced, in a manner similar to that seen in MAOB-shRNA-injected wild-type mice. However, the GABAzine-sensitive tonic current was fully restored after treating mice with tamoxifen to induce glial rescue of MAOB (Fig.4O).
The recordings of tonic current were done entirely with 8- to 10-week-old adult mice. It has been already reported that the frequency of spontaneous inhibitory postsynaptic currents (sIPSCs) decreases with age and by the time of adulthood (starting from postnatal day 40) most of sIPSCs disappear in cerebellar granule neurons (Wall & Usowicz, 1997). Consistent with that report and our previous study (Lee et al. 2010) there was minimal occurrence of sIPSCs in cerebellar granule neurons. Thus, we did not analyse the sIPSCs.
We confirmed the contribution of MAOB to glial GABA in cerebellar glial cells by immunohistochemistry. In selegiline-drinking mice, we found significantly reduced GABA immunoreactivity in GFP-positive cells in GFAP-GFP mouse, but not in GFP-negative cells (Fig.5A–C). We also confirmed this finding in MAOB KO mice, which had very weak MAOB immunoreactivity in GFAP-positive cells (Fig.5D and E). In MAOB KO mice, GABA immunoreactivity in GFAP-positive cells was significantly reduced compared to WT littermate mice (Fig.5D and F). These results are in line with the reduced tonic currents in selegiline-treated and MAOB KO mice (Fig.4). Taken together, these findings reveal that glial MAOB-derived GABA is the main mediator of tonic inhibition in cerebellar granule cells.
Figure 5. Decrease of GABA content by inhibition and knockout of MAOB in Bergmann glial cells.
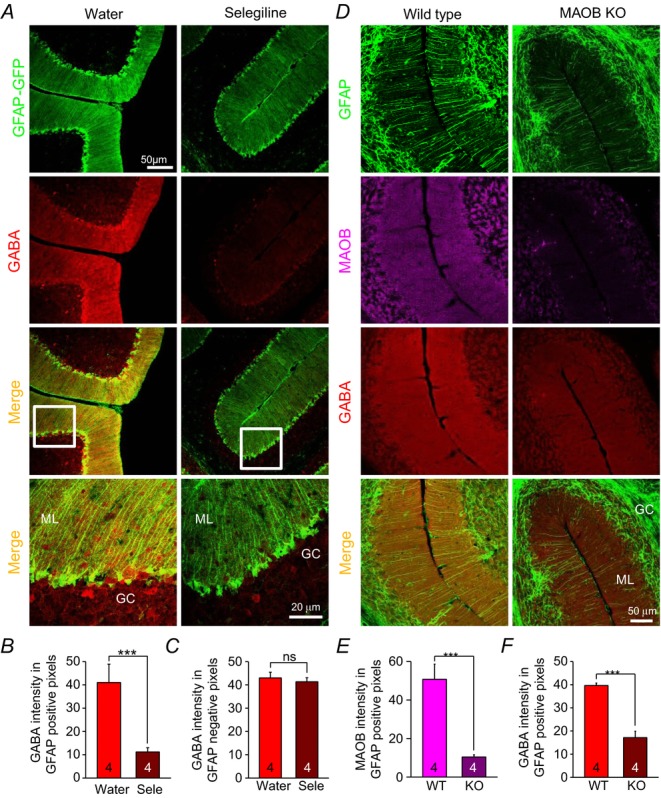
A, immunostaining after oral administration of selegiline (10 mg kg–1 day–1) for 3 days. Green: GFAP-GFP; red: GABA. White boxes; magnified regions. ML: molecular layer. GC: granule cell layer. B and C, quantification of GABA immunoreactivity in GFAP-GFP positive (B) and negative (C) pixels in controls (Water) and with water containing selegiline (Sele). D, immunostaining from cerebellar slices with wild littermates and MAOB KO mice. (green: GFAP; purple: MAOB). E and F, quantification of MAOB (E) and GABA (F) immunoreactivity in GFAP positive pixels. Asterisks indicate significant difference determined by paired two-tailed t test (***P < 0.001). ns: non-significant difference.
MAOB-synthesized and Best1-mediated glial GABA in the striatum
Tonic GABAA receptor-mediated currents are observed not only in the cerebellum, but also in the striatum. Striatal medium spiny neurons (MSNs) show prominent tonic inhibitory conductance. In addition, unlike cerebellar granule neurons, which are glutamatergic, 95% of striatal neurons are GABAergic projection neurons (Ade et al. 2008). More importantly, a recent study implicated the striatal tonic inhibitory actions of GABA in Huntington's disease (Cepeda et al. 2013). It is possible that the same mechanism could govern synthesis and release of GABA in the striatum. To test the possibility, we first measured MAOB enzyme activity in the striatum. In homogenates of cerebrum containing striatum, cortex, thalamus, hippocampus, and other brain regions, we found that MAOB enzyme activity was completely inhibited by selegiline at 100 nm in WT littermates. However, the activity was completely abolished in MAOB KO mice, across all concentrations of selegiline (Fig.6A and B). MAOA enzyme activity was unchanged in MAOB KO mice (Fig.6C).
Figure 6. Inhibition and gene silencing of MAOB abolish tonic inhibition while glia-specific rescue of MAOB restores tonic inhibition in striatum.

A, effect of selegiline on MAOB activity in wild littermates and MAOB KO mice was measured from mitochondria-rich fraction which was prepared from mouse cerebral homogenate. B and C, enzyme activity assay results from cerebrum in wild littermates and MAOB KO mice. D and E, the tonic GABAA receptor-mediated currents of medium spiny neuron (MSN) measured in control striatum slices and in slices from naïve mice treated for 1 h with selegiline (100 nm). BIC: 20 μm bicuculline. F, magnitude of bicuculline sensitive tonic current recorded MSN cells treated as indicated. G, sIPSC amplitude and frequency in MSN cells treated as indicated. H and I, the tonic GABAA receptor-mediated currents of MSN cells measured in striatum slices from hGFAP-CreERT2 mice treated with tamoxifen and MAOB-shRNA virus injected (I) or control mice (treated with sunflower oil, H). J, magnitude of bicuculline sensitive tonic current recorded MSN cells treated as indicated. K, sIPSC amplitude and frequency in MSN cells as indicated. L and M, the tonic GABAA receptor-mediated currents of MSN measured in striatum slices from wild littermates and MAOB KO mice. N, magnitude of bicuculline sensitive tonic current recorded MSN cells treated as indicated. O, sIPSC amplitude and frequency in MSN cells as indicated. P and Q, the tonic GABAA receptor-mediated currents of MSN measured in striatum slices from wild littermates and MAOB KO mice at 33ºC. R, magnitude of bicuculline sensitive tonic current recorded in MSN cells treated as indicated. S, sIPSC amplitude and frequency in MSN cells as indicated. *P < 0.05; **P < 0.01.
Next, we investigated the contribution of MAOB to tonic GABAA receptor-mediated currents in the striatum using the GABAA receptor antagonist bicuculline (20 μm). Similar to the cerebellum, bicuculline-sensitive tonic currents recorded from striatal MSNs were abolished in striatal slices treated with 100 nm selegiline for 1 h (Fig.6E and F) compared to control slices without selegiline (Fig.6D). The effect of selegiline was similar when mice were allowed to drink selegiline for 3 days (Fig.6F). In hGFAP-CreERT2 mice injected with lentiviral MAOB-shRNA, bicuculline-sensitive tonic currents were significantly reduced (Fig.6H–I). However, in MAOB-shRNA-infected hGFAP-CreERT2 mice treated with tamoxifen, which causes glial rescue of MAOB, tonic currents were fully restored to the level observed in naïve mice (Fig.6I and J). We then confirmed the role of MAOB in GABA synthesis and tonic inhibition using MAOB KO mice. The tonic current was significantly reduced in MAOB KO compared to WT littermates (Fig.6L–N). Synaptic activity was not changed by the drug or genetic manipulations (Fig.6G, K and O).
We performed most of electrophysiological experiments at room temperature (25°C). To test whether there is any temperature dependence of GABA release, we measured the tonic current at a more physiological temperature (33°C). Compared to the recordings at room temperature (Fig.6L–O), the tonic inhibition current was not different at 33°C in both wild-type and MAOB KO mice (Fig.6P–R). However, the average frequency of synaptic GABA responses was increased from 0.5 Hz to 1.2 Hz (Fig.6O and S). These results indicate that synaptic GABA release is sensitive to temperature, whereas tonic GABA release is not. These results further imply that tonic GABA release is independent of synaptic GABA release.
To test whether the reduction of tonic current by the intervention of MAOB is caused by reduction of GABAA receptor expression rather than reduction of GABA content in glial cells, we measured the response of extrasynaptic GABAA receptors upon puffing application of THIP, an agonist for extrasynaptic GABAA receptor containing the δ-subunit, onto striatal MSNs (Fig.7A). We found that there was no change of THIP-induced currents between WT and MAOB KO mice (Fig.7B and C). These results indicate that changes in tonic inhibition current are caused by changes of GABA content in glial cell via MAOB, but not by changes of GABAA receptor expression. Taken together, these findings indicate that, just as in the cerebellum, glial MAOB is required for the production of GABA and mediates tonic inhibition in the striatum.
Figure 7. GABA synthesis by MAOB in glia.

A, schematic illustration for measurement of extrasynaptic GABAA receptor response by THIP application (10 lbf in–2, 100 ms, 100 μm). B, THIP-induced currents of MSN measured in striatum slices from wild littermates and MAOB KO mice. C, magnitude of THIP-induced current recorded in MSN cells. D, the model of sources and regulation of GABA in neurons and astrocytes. Neurons produce GABA from glutamate by GAD. Meanwhile, astrocytes synthesize GABA from putrescine via monoamine oxidation. This glial GABA is released via Best1 and this channel-mediated release of GABA contributes to tonic inhibition. E, pathway of GABA synthesis from putrescine. PAT: putrescine acetyltransferase; MAOB: monoamine oxidase B; ALDH2: aldehyde dehydrogenase 2.
Discussion
To date, the major source of GABA in the brain has been attributed to neuronal GAD. Our study demonstrates that at least in the cerebellum and striatum there is an alternative source of GABA, utilizing the putrescine degradation pathway via glial MAOB. Our new model of GABA synthesis in neurons and glia includes the presence of GAD in neurons and putrescine and MAOB in cerebellar glia, with a lack of GABA-T degradation of GABA (Fig.7D and E). We anticipate that this mechanism could be a general mechanism that governs tonic GABA-mediated inhibition in many other parts of the brain. More importantly, considering the fact that tonic GABA contributes to over 70% of inhibition in cerebellar granule neurons (Farrant & Nusser, 2005), GABA produced by the glia should have a major inhibitory effect on neuronal networks in certain parts of the brain.
We have extensively utilized the sniffer patch technique to delineate the biosynthetic pathway of GABA production and the molecular mechanism of release (Fig.3). The sniffer patch experiment with cultured cerebellar astrocytes was designed to detect changes of GABA content induced by MAOB inhibitor, GAT inhibitor and gene silencing of MAOB or Best1. We did not intend to detect tonic GABA release from a single astrocyte because culture conditions provide an open environment where tonically released GABA can freely diffuse away from a cell. In addition, the amount of tonic GABA release from a single astrocyte would be small and difficult to detect from the sensor cell by sniffer patch. In contrast, tonic GABA release in brain slices is under a totally different environment. In slices astrocytes are packed into a 3D space and released GABA is confined to the compartmentalized extracellular matrix. In addition the EC50 of Ca2+ for Best1 channel opening is around 150 nm (Lee et al. 2010), which is near the resting intracellular Ca2+ level in a cell (100 nm). This implies that there is a basal level opening of Best1 channels at resting Ca2+ level, which contributes to tonic release of GABA. Therefore, tonically released GABA in brain slices can be easily detected by the neighbouring neurons that express high affinity, extrasynaptic GABAA receptors, even without any external stimulation. Nevertheless, the sniffer patch experiment in cultured astrocytes provides more accurate information about the effect of various inhibitors on cytosolic GABA content in isolated single astrocytes. TFLLR, a PAR1 receptor agonist, was used as a tool to induce a Ca2+ rise, required for coordinated release of GABA through Best1 channels (Lee et al. 2010) in cultured astrocytes. This technique was used strictly to monitor the intracellular content of GABA.
Fonnum & Walberg (1973) reported that the concentration of GABA in GABAergic cells is 50–100 mm. A number of studies demonstrated that there is a linear relationship between the gold particle density in immunogold electron microscopy and antigen concentration (Ottersen, 1989a, 1989b). The author clarified this relationship using an assembled sandwich that contained a series of amino acid conjugates, prepared from different concentrations of amino acids, including GABA. The concentration of fixed amino acids with different conjugates was determined by liquid scintillation counting following an addition of radiolabelled amino acid in cerebellum. After immunogold electron microscopy labelling of the amino acids, the gold particle density and concentration of amino acid were compared. The author concluded that gold particle density showed a linear relationship with amino acid concentration and could be used to estimate the concentration of amino acids such as glutamate, taurine and GABA. Based on these previous findings, we estimated the relative concentration of GABA using the immunogold labelled antibody against GABA. We observed that the gold particle density of GABAergic axon terminals was about 10 times higher than that of Bergmann glia. Thus we reasoned that the GABA concentration in Bergmann glia should be around 5–10 mm.
Our study is the first to demonstrate that astrocytes synthesize GABA by MAOB, although the idea of GABA synthesis by MAOB is not new. In the past, Seiler and Al-Therib suggested the pathway from putrescine to GABA by adding acetyl-CoA to rat brain cortex homogenate (Seiler & Al-Therib, 1974). However, this study did not test the involvement of MAOB. On the other hand, Caron et al. reported that this putrescine pathway contributes to only a minority of total brain GABA, implying that the pathway could not be linked to the tonic inhibition of the brain (Caron et al. 1987). However, they only used the telencephalon for their experiments and excluded the brain stem and cerebellum. In addition, there was no demonstration of MAOB in this study. Laschet et al. specifically suggested that astrocytes make GABA from putrescine (Laschet et al. 1992). Although the authors detected radioactive GABA by HPLC after incubation of cultured astrocytes in [14C]putrescine, there was no mention of MAOB. Finally, a recent paper by Héja et al. reported that GABA, which was assumed to be synthesized from putrescine, is released from astrocytes by the reverse action of glial GAT (Heja et al. 2012). However, they only assumed that GABA was derived from putrescine, rather than directly demonstrating this. The study did not explicitly show that inhibiting MAOB blocks the tonic GABA current in neurons. More importantly, the experiments were performed in the hippocampus where we previously reported there are minimal tonic GABAA receptor-mediated currents (Yoon et al. 2011). In addition, tonic inhibition was measured not by the conventional method of recording bicuculline- or GABAzine-sensitive whole-cell currents, but instead by measuring the change of inhibition induced by GAT block, which is not a conventional method. Finally, the measurement was done under less physiological conditions of low external Mg2+ concentration. In summary, therefore, the idea that glia make GABA and generate tonic inhibition via the putrescine–MAOB pathway has not been very well documented to date, whereas our study provides unprecedented molecular and cellular evidence for this idea.
Because MAOB is classically known as an enzyme that degrades dopamine, there is a possibility that altered dopamine could contribute to changes in tonic inhibition current when MAOB is inhibited pharmacologically or genetically. It has been demonstrated on numerous occasions that inhibition of MAOB does not increase dopamine levels. Lamensdorf et al. (1996) found no change of dopamine concentration in striatum acutely treated with selegiline and a small increase of dopamine on chronic treatment. Another study reported that chronic administration of selegiline caused an increase in the extracellular dopamine concentration in the striatum of primates, but not in rodents (Kaseda et al. 1999). Furthermore, Chen et al. (1999) have reported that the synthesis, storage, uptake and release of dopamine were not altered in the same MAOB KO mice that we used in this study. Based on these previous reports, we predict that the contribution of dopamine in tonic inhibition current by inhibition of MAOB is minimal.
Glial GAT has been thought to be a potential source of GABA by GABA uptake or release of GABA by reverse transport in glia (Barakat & Bordey, 2002). Thus we extensively tested these possibilities. We performed GABA immunolabelling in cultured cerebellar glial cells with or without GAT blockers and found no effect (Fig.1E). In addition, we designed a sniffer patch experiment showing Ca2+-induced GABA release from cerebellar glial cells with or without GAT blockers and found no effect (Fig.3J and L). These results strongly suggest that GAT may not directly mediate the release of GABA in cerebellar glial cells. However, there is still a possibility that GAT can modulate glial GABA content. Consistent with this possibility, we found that GAT inhibitors increased the tonic GABA current in granule neurons (Fig.1C). Our observations are consistent with previous reports (Rossi et al. 2003; Clarkson et al. 2010) which support this possibility.
The idea of a non-neuronal source of tonic GABA release via an unconventional mechanism that is independent of action potentials and vesicular exocytosis has been well established by numerous studies (Wall & Usowicz, 1997; Rossi et al. 2003; Lee et al. 2010). It has been reported that tonic GABA released from glial cells activates high affinity extrasynaptic GABAA receptors by volume transmission in cerebellum and striatum (Rossi et al. 2003; Ade et al. 2008; Lee et al. 2010), whereas phasic GABA released from presynaptic neurons activates low affinity synaptic GABAA receptors. The concentration of extracellular tonic GABA is estimated to be around 160 nm (Santhakumar et al. 2006; Lee et al. 2010), whereas that of phasic GABA at the synaptic junctions is around 3 mm (Mozrzymas et al. 2003). The synaptically released GABA is constantly taken up by the high performance GABA transporters that are ready to take up GABA near the synapses. These GABA transporters serve as a barrier that separates the extrasynaptic space and synaptic junctions. The high affinity extrasynaptic GABAA receptors are non-desensitizing and have an EC50 for GABA in the range of 0.3–0.7 μm, whereas synaptic GABAA receptors are strongly desensitizing and have and EC50 for GABA in the range of 6–14 μm (Farrant & Nusser, 2005). Therefore, there is a forty-fold difference in the affinity of GABAA receptors for GABA. Different locations (extrasynaptic vs. synaptic) and different extracellular concentrations of GABA, and different degrees of desensitization and sensitivity of GABAA receptors to GABA make these two distinct GABA modes (tonic and phasic) function differentially and independently. Tonic GABA serves to inhibit target neurons on a slow time scale in the order of seconds and minutes, whereas phasic GABA serves to inhibit target neurons on a fast time scale in the order of milliseconds. Therefore, even though cytosolic glial GABA is only 10% of that in the axon terminals of neurons, the difference of affinity of GABAA receptors ensures the proper activation of GABAA receptors at the right location.
In conclusion, we have identified MAOB as a key GABA synthesizing enzyme that is responsible for the source of GABA in cerebellar and striatal glial cells. GABA is subsequently released via Best1 channels to mediate tonic inhibition in cerebellar granule cells. Our study is consistent with the idea that glial cells possess a specialized synthesizing pathway and distinct release machinery for GABA to modulate neuronal excitability via tonic inhibition. The new knowledge and tools that were developed in this study should be useful for future studies of tonic inhibition in relation to numerous cognitive functions and diseases such as sleep, memory, epilepsy, motor impairment and stroke.
Acknowledgments
We thank Dr. Larry Cohen and Dr. Mikyung Park for careful editing of the manuscript. Our very special thanks go to Dr. Fujiwara for generous gift of the putrescine antibody.
Glossary
- ALDH2
aldehyde dehydrogenase 2
- Best1
bestrophin 1
- BIC
bicuculline
- GABA
γ-aminobutyric acid
- GAD
glutamic acid decarboxylase
- GAT
GABA transporter
- GBZ
gabazine
- GFP
green fluorescent protein
- MAOA
monoamine oxidase A
- MAOB
monoamine oxidase B
- MSN
medium spiny neuron
- OPA
o-phthaldialdehyde
- PAT
putrescine acetyltransferase
Additional information
Competing interests
None declared.
Author contributions
B.E.Y., J.W. and C.J.L. were involved in conception and design of the experiments, collection, analysis and interpretation of data and writing of the manuscript. Y.E.C. and H.C. participated in collection, analysis and interpretation of electrophysiological data. S.J. was involved in collection, analysis and interpretation of enzyme activity experiments. J.Y.B. and Y.C.B. were involved in collection, analysis and interpretation of electron microscopy data. H.A. was involved in collection, analysis and interpretation of immunohistochemical data. J.O.M. participated in collection, analysis and interpretation of western blot data. S.J.O. and K.S.H. participated in collection, analysis of electrophysiological data. H.Y.K. and Y.S.K. participated in collection, analysis and interpretation of HPLC data. T.K. participated in collection and analysis of immunohistochemical data.
Funding
This work was supported by the World Class Institute (WCI 2009-003), KIST's Institutional Grant (2E24480) and Flagship Grant (2E25020), the MRC (2012-0000305), and Basic Science Research (2010-0029460) Programs of the NRF funded by the Ministry of Education, Science and Technology (MEST) of Korea and a under the framework of international cooperation program managed by the National Research Foundation of Korea (2013K2A2A4003724) and grant from the National Research Foundation of Korea (NRF) funded by MEST (to Y.C.B., 2012-0009328).
Key points
Here we show that glial gamma aminobutyric acid (GABA) is produced by monoamine oxidase B (MAOB), utilizing a polyamine, putrescine.
The concentration of GABA in Bergmann glial cells is estimated to be around 5–10 mM.
General gene silencing of MAOB resulted in elimination of tonic GABA currents recorded from granule cells in the cerebellum and medium spiny neurons (MSN) in the striatum.
Glial-specific rescue of MAOB resulted in complete restoration of tonic GABA currents.
Our results identify MAOB as a synthesizing enzyme of glial GABA, which is released to mediate tonic inhibition in the cerebellum and striatum.
References
- Ade KK, Janssen MJ, Ortinski PI. Vicini S. Differential tonic GABA conductances in striatal medium spiny neurons. J Neurosci. 2008;28:1185–1197. doi: 10.1523/JNEUROSCI.3908-07.2008. [DOI] [PMC free article] [PubMed] [Google Scholar]
- Adler J. Parmryd I. Quantifying colocalization by correlation: the Pearson correlation coefficient is superior to the Mander's overlap coefficient. Cytometry A. 2010;77:733–742. doi: 10.1002/cyto.a.20896. [DOI] [PubMed] [Google Scholar]
- Araque A, Parpura V, Sanzgiri RP. Haydon PG. Tripartite synapses: glia, the unacknowledged partner. Trends Neurosci. 1999;22:208–215. doi: 10.1016/s0166-2236(98)01349-6. [DOI] [PubMed] [Google Scholar]
- Balazs R, Machiyama Y, Hammond BJ, Julian T. Richter D. The operation of the γ-aminobutyrate bypath of the tricarboxylic acid cycle in brain tissue in vitro. Biochem J. 1970;116:445–461. doi: 10.1042/bj1160445. [DOI] [PMC free article] [PubMed] [Google Scholar]
- Barakat L. Bordey A. GAT-1 and reversible GABA transport in Bergmann glia in slices. J Neurophysiol. 2002;88:1407–1419. doi: 10.1152/jn.2002.88.3.1407. [DOI] [PubMed] [Google Scholar]
- Bardakdjian J, Tardy M, Pimoule C. Gonnard P. GABA metabolism in cultured glial cells. Neurochem Res. 1979;4:517–527. doi: 10.1007/BF00964645. [DOI] [PubMed] [Google Scholar]
- Barres BA, Koroshetz WJ, Chun LL. Corey DP. Ion channel expression by white matter glia: the type-1 astrocyte. Neuron. 1990;5:527–544. doi: 10.1016/0896-6273(90)90091-s. [DOI] [PubMed] [Google Scholar]
- Brickley SG, Cull-Candy SG. Farrant M. Development of a tonic form of synaptic inhibition in rat cerebellar granule cells resulting from persistent activation of GABAA receptors. J Physiol. 1996;497:753–759. doi: 10.1113/jphysiol.1996.sp021806. [DOI] [PMC free article] [PubMed] [Google Scholar]
- Caraiscos VB, Elliott EM, You-Ten KE, Cheng VY, Belelli D, Newell JG, Jackson MF, Lambert JJ, Rosahl TW, Wafford KA, et al. Tonic inhibition in mouse hippocampal CA1 pyramidal neurons is mediated by α5 subunit-containing γ-aminobutyric acid type A receptors. Proc Natl Acad Sci USA. 2004;101:3662–3667. doi: 10.1073/pnas.0307231101. [DOI] [PMC free article] [PubMed] [Google Scholar]
- Caron PC, Kremzner LT. Cote LJ. GABA and its relationship to putrescine metabolism in the rat brain and pancreas. Neurochem Int. 1987;10:219–229. doi: 10.1016/0197-0186(87)90131-8. [DOI] [PubMed] [Google Scholar]
- Cepeda C, Galvan L, Holley SM, Rao SP, Andre VM, Botelho EP, Chen JY, Watson JB, Deisseroth K. Levine MS. Multiple sources of striatal inhibition are differentially affected in Huntington's disease mouse models. J Neurosci. 2013;33:7393–7406. doi: 10.1523/JNEUROSCI.2137-12.2013. [DOI] [PMC free article] [PubMed] [Google Scholar]
- Chadderton P, Margrie TW. Hausser M. Integration of quanta in cerebellar granule cells during sensory processing. Nature. 2004;428:856–860. doi: 10.1038/nature02442. [DOI] [PubMed] [Google Scholar]
- Chen L, He M, Sibille E, Thompson A, Sarnyai Z, Baker H, Shippenberg T. Toth M. Adaptive changes in postsynaptic dopamine receptors despite unaltered dopamine dynamics in mice lacking monoamine oxidase B. J Neurochem. 1999;73:647–655. doi: 10.1046/j.1471-4159.1999.0730647.x. [DOI] [PubMed] [Google Scholar]
- Clarkson AN, Huang BS, Macisaac SE, Mody I. Carmichael ST. Reducing excessive GABA-mediated tonic inhibition promotes functional recovery after stroke. Nature. 2010;468:305–309. doi: 10.1038/nature09511. [DOI] [PMC free article] [PubMed] [Google Scholar]
- Cope DW, Di Giovanni G, Fyson SJ, Orban G, Errington AC, Lorincz ML, Gould TM, Carter DA. Crunelli V. Enhanced tonic GABAA inhibition in typical absence epilepsy. Nat Med. 2009;15:1392–1398. doi: 10.1038/nm.2058. [DOI] [PMC free article] [PubMed] [Google Scholar]
- Cope DW, Hughes SW. Crunelli V. GABAA receptor-mediated tonic inhibition in thalamic neurons. J Neurosci. 2005;25:11553–11563. doi: 10.1523/JNEUROSCI.3362-05.2005. [DOI] [PMC free article] [PubMed] [Google Scholar]
- Egawa K, Kitagawa K, Inoue K, Takayama M, Takayama C, Saitoh S, Kishino T, Kitagawa M. Fukuda A. Decreased tonic inhibition in cerebellar granule cells causes motor dysfunction in a mouse model of Angelman syndrome. Sci Transl Med. 2012;4:163ra157. doi: 10.1126/scitranslmed.3004655. [DOI] [PubMed] [Google Scholar]
- Farrant M. Nusser Z. Variations on an inhibitory theme: phasic and tonic activation of GABAA receptors. Nat Rev Neurosci. 2005;6:215–229. doi: 10.1038/nrn1625. [DOI] [PubMed] [Google Scholar]
- Fiacco TA. McCarthy KD. Astrocyte calcium elevations: properties, propagation, and effects on brain signaling. Glia. 2006;54:676–690. doi: 10.1002/glia.20396. [DOI] [PubMed] [Google Scholar]
- Fonnum F. Walberg F. An estimation of the concentration of γ-aminobutyric acid and glutamate decarboxylase in the inhibitory Purkinje axon terminals in the cat. Brain Res. 1973;54:115–127. doi: 10.1016/0006-8993(73)90038-3. [DOI] [PubMed] [Google Scholar]
- Fujiwara K, Tanabe T, Yabuuchi M, Ueoka R. Tsuru D. A monoclonal antibody against the glutaraldehyde-conjugated polyamine, putrescine: application to immunocytochemistry. Histochem Cell Biol. 2001;115:471–477. doi: 10.1007/s004180100280. [DOI] [PubMed] [Google Scholar]
- Grosche J, Matyash V, Moller T, Verkhratsky A, Reichenbach A. Kettenmann H. Microdomains for neuron-glia interaction: parallel fiber signaling to Bergmann glial cells. Nat Neurosci. 1999;2:139–143. doi: 10.1038/5692. [DOI] [PubMed] [Google Scholar]
- Hanchar HJ, Dodson PD, Olsen RW, Otis TS. Wallner M. Alcohol-induced motor impairment caused by increased extrasynaptic GABAA receptor activity. Nat Neurosci. 2005;8:339–345. doi: 10.1038/nn1398. [DOI] [PMC free article] [PubMed] [Google Scholar]
- Haydon PG. Carmignoto G. Astrocyte control of synaptic transmission and neurovascular coupling. Physiol Rev. 2006;86:1009–1031. doi: 10.1152/physrev.00049.2005. [DOI] [PubMed] [Google Scholar]
- Haynes LW. Neuronal and glial localization of acetylcholinesterase and GABA transaminase in organized cultures of developing rat spinal cord. Experientia. 1983;39:223–225. doi: 10.1007/BF01958913. [DOI] [PubMed] [Google Scholar]
- Heja L, Nyitrai G, Kekesi O, Dobolyi A, Szabo P, Fiath R, Ulbert I, Pal-Szenthe B, Palkovits M. Kardos J. Astrocytes convert network excitation to tonic inhibition of neurons. BMC biology. 2012;10:26. doi: 10.1186/1741-7007-10-26. [DOI] [PMC free article] [PubMed] [Google Scholar]
- Henn FA. Hamberger A. Glial cell function: uptake of transmitter substances. Proc Natl Acad Sci USA. 1971;68:2686–2690. doi: 10.1073/pnas.68.11.2686. [DOI] [PMC free article] [PubMed] [Google Scholar]
- Itouji A, Sakai N, Tanaka C. Saito N. Neuronal and glial localization of two GABA transporters (GAT1 and GAT3) in the rat cerebellum. Brain Res Mol Brain Res. 1996;37:309–316. doi: 10.1016/0169-328x(95)00342-p. [DOI] [PubMed] [Google Scholar]
- Jia F, Pignataro L, Schofield CM, Yue M, Harrison NL. Goldstein PA. An extrasynaptic GABAA receptor mediates tonic inhibition in thalamic VB neurons. J Neurophysiol. 2005;94:4491–4501. doi: 10.1152/jn.00421.2005. [DOI] [PubMed] [Google Scholar]
- Kaseda S, Nomoto M. Iwata S. Effect of selegiline on dopamine concentration in the striatum of a primate. Brain Res. 1999;815:44–50. doi: 10.1016/s0006-8993(98)01089-0. [DOI] [PubMed] [Google Scholar]
- Lamensdorf I, Youdim MB. Finberg JP. Effect of long-term treatment with selective monoamine oxidase A and B inhibitors on dopamine release from rat striatum in vivo. J Neurochem. 1996;67:1532–1539. doi: 10.1046/j.1471-4159.1996.67041532.x. [DOI] [PubMed] [Google Scholar]
- Laschet J, Grisar T, Bureau M. Guillaume D. Characteristics of putrescine uptake and subsequent GABA formation in primary cultured astrocytes from normal C57BL/6J and epileptic DBA/2J mouse brain cortices. Neuroscience. 1992;48:151–157. doi: 10.1016/0306-4522(92)90345-3. [DOI] [PubMed] [Google Scholar]
- Le Meur K, Mendizabal-Zubiaga J, Grandes P. Audinat E. GABA release by hippocampal astrocytes. Front Comput Neurosci. 2012;6:59. doi: 10.3389/fncom.2012.00059. [DOI] [PMC free article] [PubMed] [Google Scholar]
- Lee M, McGeer EG. McGeer PL. Mechanisms of GABA release from human astrocytes. Glia. 2011;59:1600–1611. doi: 10.1002/glia.21202. [DOI] [PubMed] [Google Scholar]
- Lee S, Yoon BE, Berglund K, Oh SJ, Park H, Shin HS, Augustine GJ. Lee CJ. Channel-mediated tonic GABA release from glia. Science. 2010;330:790–796. doi: 10.1126/science.1184334. [DOI] [PubMed] [Google Scholar]
- Levitt P, Pintar JE. Breakefield XO. Immunocytochemical demonstration of monoamine oxidase B in brain astrocytes and serotonergic neurons. Proc Natl Acad Sci USA. 1982;79:6385–6389. doi: 10.1073/pnas.79.20.6385. [DOI] [PMC free article] [PubMed] [Google Scholar]
- Martin DL. Rimvall K. Regulation of γ-aminobutyric acid synthesis in the brain. J Neurochem. 1993;60:395–407. doi: 10.1111/j.1471-4159.1993.tb03165.x. [DOI] [PubMed] [Google Scholar]
- Mozrzymas JW, Zarnowska ED, Pytel M. Mercik K. Modulation of GABAA receptors by hydrogen ions reveals synaptic GABA transient and a crucial role of the desensitization process. J Neurosci. 2003;23:7981–7992. doi: 10.1523/JNEUROSCI.23-22-07981.2003. [DOI] [PMC free article] [PubMed] [Google Scholar]
- Nolte C, Matyash M, Pivneva T, Schipke CG, Ohlemeyer C, Hanisch UK, Kirchhoff F. Kettenmann H. GFAP promoter-controlled EGFP-expressing transgenic mice: a tool to visualize astrocytes and astrogliosis in living brain tissue. Glia. 2001;33:72–86. [PubMed] [Google Scholar]
- Nusser Z. Mody I. Selective modulation of tonic and phasic inhibitions in dentate gyrus granule cells. J Neurophysiol. 2002;87:2624–2628. doi: 10.1152/jn.2002.87.5.2624. [DOI] [PubMed] [Google Scholar]
- Oliet SH. Mothet JP. Molecular determinants of D-serine-mediated gliotransmission: from release to function. Glia. 2006;54:726–737. doi: 10.1002/glia.20356. [DOI] [PubMed] [Google Scholar]
- Ottersen OP. Postembedding immunogold labelling of fixed glutamate: an electron microscopic analysis of the relationship between gold particle density and antigen concentration. J Chem Neuroanat. 1989a;2:57–66. [PubMed] [Google Scholar]
- Ottersen OP. Quantitative electron microscopic immunocytochemistry of neuroactive amino acids. Anat Embryo (Berl)l. 1989b;180:1–15. doi: 10.1007/BF00321895. [DOI] [PubMed] [Google Scholar]
- Rossi DJ, Hamann M. Attwell D. Multiple modes of GABAergic inhibition of rat cerebellar granule cells. J Physiol. 2003;548:97–110. doi: 10.1113/jphysiol.2002.036459. [DOI] [PMC free article] [PubMed] [Google Scholar]
- Rousse I. Robitaille R. Calcium signaling in Schwann cells at synaptic and extra-synaptic sites: active glial modulation of neuronal activity. Glia. 2006;54:691–699. doi: 10.1002/glia.20388. [DOI] [PubMed] [Google Scholar]
- Santhakumar V, Hanchar HJ, Wallner M, Olsen RW. Otis TS. Contributions of the GABAA receptor α6 subunit to phasic and tonic inhibition revealed by a naturally occurring polymorphism in the α6 gene. J Neurosci. 2006;26:3357–3364. doi: 10.1523/JNEUROSCI.4799-05.2006. [DOI] [PMC free article] [PubMed] [Google Scholar]
- Seiler N. Al-Therib MJ. Putrescine catabolism in mammalian brain. Biochem J. 1974;144:29–35. doi: 10.1042/bj1440029. [DOI] [PMC free article] [PubMed] [Google Scholar]
- Semyanov A, Walker MC, Kullmann DM. Silver RA. Tonically active GABAA receptors: modulating gain and maintaining the tone. Trends Neurosci. 2004;27:262–269. doi: 10.1016/j.tins.2004.03.005. [DOI] [PubMed] [Google Scholar]
- Stell BM. Mody I. Receptors with different affinities mediate phasic and tonic GABAA conductances in hippocampal neurons. J Neurosci. 2002;22:RC223. doi: 10.1523/JNEUROSCI.22-10-j0003.2002. [DOI] [PMC free article] [PubMed] [Google Scholar]
- Ventura A, Meissner A, Dillon CP, McManus M, Sharp PA, Van Parijs L, Jaenisch R. Jacks T. Cre-lox-regulated conditional RNA interference from transgenes. Proc Natl Acad Sci USA. 2004;101:10380–10385. doi: 10.1073/pnas.0403954101. [DOI] [PMC free article] [PubMed] [Google Scholar]
- Volterra A. Meldolesi J. Astrocytes, from brain glue to communication elements: the revolution continues. Nat Rev Neurosci. 2005;6:626–640. doi: 10.1038/nrn1722. [DOI] [PubMed] [Google Scholar]
- Wall MJ. Usowicz MM. Development of action potential-dependent and independent spontaneous GABAA receptor-mediated currents in granule cells of postnatal rat cerebellum. Eur J Neurosci. 1997;9:533–548. doi: 10.1111/j.1460-9568.1997.tb01630.x. [DOI] [PubMed] [Google Scholar]
- Yamada J, Furukawa T, Ueno S, Yamamoto S. Fukuda A. Molecular basis for the GABAA receptor-mediated tonic inhibition in rat somatosensory cortex. Cereb Cortex. 2007;17:1782–1787. doi: 10.1093/cercor/bhl087. [DOI] [PubMed] [Google Scholar]
- Yoon BE, Jo S, Woo J, Lee JH, Kim T, Kim D. Lee CJ. The amount of astrocytic GABA positively correlates with the degree of tonic inhibition in hippocampal CA1 and cerebellum. Mol Brain. 2011;4:42. doi: 10.1186/1756-6606-4-42. [DOI] [PMC free article] [PubMed] [Google Scholar]