

Abstract
The epithalamic lateral habenula (LHb) is implicated as part of the mammalian brain's circadian system. Anatomical evidence suggests that the LHb receives extrinsic circadian timing cues from retinal ganglion cells and the master clock in the suprachiasmatic nuclei (SCN). Intriguingly, some LHb neurones contain the molecular circadian clock, but it is unclear if and how intrinsic and extrinsic circadian processes influence neuronal activity in the mouse LHb. Here, using an in vitro brain slice preparation isolating the LHb from the SCN, we show through whole-cell patch-clamp recordings that LHb neurones exhibit heterogeneity in their resting state, but the majority spontaneously fire action potentials (APs). Discharge rate of APs varied from low firing in the early day to higher firing later in the day and was absent in LHb brain slices prepared from Cry1−/−Cry2−/− mice that lack a functional molecular clock. Low amplitude circadian oscillations in the molecular circadian clock were also monitored in LHb brain slices, but were absent in Cry1−/−Cry2−/− LHb brain tissue. A putative neurochemical output signal of the SCN, prokineticin 2 (PK2), inhibited some LHb neurones by elevating the frequency of GABA release in the LHb. Using multi-electrode recordings in vivo, we found that LHb neurones sluggishly respond to retinal illumination, suggesting that they receive such information through polysynaptic processes. In summary, our results show for the first time that intrinsic circadian signals are important for regulating LHb neuronal state, while the SCN-derived signal PK2 is less influential. Moreover, we demonstrate that mouse LHb neurones have access to and can respond to visual input, but such signals are unlikely to be directly communicated to the LHb. Broadly, these findings raise the possibility that intrinsic circadian signals are likely to be influential in shaping LHb contributions to cognition and emotionality.
Introduction
The habenula of the epithalamus is highly conserved in vertebrates (Bianco & Wilson, 2009) and current evidence implicates the habenula as a relay point, integrating and conveying forebrain information to midbrain structures (Sutherland, 1982; Hikosaka, 2010). The mammalian habenula has two major neuroanatomical divisions, the medial (MHb) and the lateral (LHb) habenula that are also functionally distinguishable. The MHb is a key site for the addictive actions of nicotinic compounds (Leslie et al. 2013), while the LHb is implicated firmly in the processing of reward prediction (Hikosaka, 2010; Jesuthasan, 2012; Lammel et al. 2012) as well as an important substrate of depression (Li et al. 2013).
While many recent investigations of the LHb have centred on its roles in cognition and anxiety, emerging evidence also indicates that the LHb is under the influence of circadian signals. In mammals, the master circadian pacemaker is contained in the hypothalamic suprachiasmatic nuclei (SCN). These comprise thousands of cellular oscillators whose intrinsic molecular clocks drive self-sustained rhythms in spontaneous electrical activity (Brown & Piggins, 2007). Importantly, the activity of these SCN clock cells can be synchronised by extrinsic inputs, most notably via melanopsin-containing retinal ganglion cells (mRGCs), which provide information about daily changes in ambient illumination (Lucas et al. 2014). In this manner, daily variations in action potential (AP) firing within the SCN clock provide information about external time that can coordinate the activity of downstream targets.
Interestingly, contemporaneous studies indicate that the mouse LHb is one such target region innervated by the SCN (Zhang et al. 2009) as well as mRGCs (Hattar et al. 2006), raising the possibility that LHb cellular activity is regulated by these extrinsic circadian-related signals. Moreover, extracellular recordings from rodent brain slices that do not contain the SCN indicate that LHb neurones can express a daily rhythm in spontaneous AP firing rate (Zhao & Rusak, 2005). Indeed, low amplitude rhythms in a bioluminescent reporter of the molecular circadian clock can be monitored in mouse LHb brain slices (Guilding et al. 2010), indicating that the LHb also has a degree of intrinsic circadian rhythmicity.
Nonetheless, the relative contributions of such intrinsic and extrinsic circadian influences on LHb neuronal activity are currently unclear. Hence, it is not yet known whether mRGC input allows mouse LHb neurones to track daily changes in light intensity as do SCN cells (Brown et al. 2011b). Similarly, it is unclear whether the molecular clock of LHb neurones drives the complex circadian variation in basic physiology as described for SCN clock cells: pronounced day–night differences in spontaneous electrical state, AP firing rate, resting membrane potential (RMP) and input resistance (Rinput) (Kuhlman & McMahon, 2004; Belle et al. 2009).
Here we show for the first time that mouse LHb neurones recorded in vitro manifest a variety of electrophysiological states, show daily variation in firing rate that depends on a functional molecular circadian clock, and are responsive to a putative SCN output factor. Furthermore, we establish through recordings in vivo that mouse LHb neurones are responsive to changes in external illumination.
Methods
Animals
Mice, in which a destabilised enhanced green fluorescent protein (EGFP) reports the expression of a clock gene, Per1 [Per1::d2EGFP mice, initial breeding stock kindly provided by Prof. D. McMahon, Vanderbilt University, USA (Kuhlman et al. 2000)], were bred in the Biological Services Facility at the University of Manchester. Animals were bred under a 12/12 h light–dark (LD) cycle. Once weaned, mice were group housed under 12/12 h LD conditions [with Zeitgeber (ZT) 0 defined as lights-on] until use in experiments. A total of 50 male and female Per1::d2EGFP mice (aged 4 weeks to 4 months) were used. Preliminary investigations indicated no obvious sex difference in LHb neuronal activity and so the LHb recordings from male and female mice were combined. Some of the SCN tissue from these mice was utilised for other studies (Scott et al. 2010; Diekman et al. 2013; Belle et al. 2014) to ethically reduce the number of animals. Since one aim of this study was to investigate possible circadian variation in the basic electrical properties of LHb neurones, for convenience we used animals housed for at least 4 weeks under one of three different sets of LD cycles. To record between ZT 5 and 14 we used mice kept on a 07.00–19.00 h LD cycle with lights-on at 07.00 h and lights-off at 19.00 h. Recordings between ZT 14 and 22 were made using mice housed in a reversed LD cycle (lights-on: 23.00–11.00 h), and finally for recording at ZT 22–5, animals were kept in a delayed LD cycle (lights-on: 15.00–03.00 h).
To further examine the contribution of the conventional molecular circadian clock to the electrophysiological properties of LHb neurones, we also used mice deficient in the cryptochrome (Cry) genes. Cry1+/−Cry2+/− animals (van der Horst et al. 1999), that had been bred with Per1-luc mice (Yamaguchi et al. 2000) carrying a Per1 luciferase reporter, were obtained from Dr Edward Jacobs of the Erasmus Medical Centre, Rotterdam, Netherlands. These mice had been backcrossed with C57BL/6J mice for nine generations. From Cry1+/−Cry2+/− x Per1-luc breeding pairs, we genotyped all offspring and used adult (2–6 months of age) animals lacking the molecular clock (referred to here as Cry1−/−Cry2−/− mice) as well as congenic littermates in which the molecular clock is fully functional (referred to here as Cry1+/+Cry2+/+ mice). Prior to use in electrophysiology experiments, these animals were housed on a 12/12 h LD cycle (either lights on at 07.00 h or lights-on at 23.00 h) for a minimum of 4 weeks. To reduce the potential masking influence of the LD cycle, the mice were transferred into constant dark for 2–3 days prior to use in experiments. Cry1−/−Cry2−/− mice are behaviourally arrhythmic, but since Cry1+/+Cry2+/+ mice have an intrinsic rhythm of ∼23.8 h (M. D. C. Belle and H. D. Piggins, unpublished observations), we extrapolated this to predict projected ZT12 (which is the onset of the circadian subjective night) and prepared brain slices from mice (n = 20) during the subjective day.
To facilitate visualisation of the projections of melansopsin-expressing retinal ganglion cells to the habenula complex (Hattar et al. 2006) homozygous Opn4tau-lacZ mice (n = 3; all males), in which the melanopsin gene (Opn4) is replaced by a tau-lacZ gene knock-in, were used. These mice (derived from founder animals kindly supplied by Dr Samar Hatter, Johns Hopkins University, Baltimore, MD, USA) were bred from homozygous Opn4tau-lacZ mice that were maintained in the Biological Services Unit (Manchester) under similar conditions to those of other mice used in this study.
For all mice, food (Bekay, B&K Universal, Hull, UK) and water were provided ad libitum. All animal protocols were in accordance with guidelines of the UK Animal (Scientific Procedure) Act 1986.
Brain slice preparation for in vitro electrophysiology
Mice were deeply anaesthetised with isoflurane (Abbott Laboratories, Maidenhead, UK) and killed by cervical dislocation followed by decapitation. The brain was quickly removed and immersed in cold, oxygenated (95% O2/5% CO2), low Na+/Ca2+, high Mg2+ sucrose-based incubation artificial cerebrospinal fluid (aCSF). This incubation aCSF contained (in mm): NaCl 95, KCl 1.8, KH2PO4 1.2, CaCl2 0.5, MgSO4 7, NaHCO3 26, glucose 15, sucrose 50 and Phenol Red 0.005 mg l−1, and had a pH of 7.4 and a measured osmolality of 300–310 mosmol kg−1. A coronal block of tissue (∼0.5 cm thick) containing the habenula was isolated, mounted on a stage, and coronal slices of 200–250 μm thickness (corresponding to the region between ∼1.34 and 1.46 mm from bregma; Paxinos & Franklin, 2001) were cut using a vibroslicer (Campden Instruments, Leicester, UK). Slices were prepared between ZT1 and 10. For animals housed in constant darkness, animal handling and brain extraction were performed with the aid of night vision goggles to prevent exposure of animals to visible light.
Individual slices containing the intermediate level of the habenula (along the rostrocaudal axis) were then directly transferred to a recording chamber mounted on the stage of a microscope and continuously perfused (∼2 ml min−1) with recording aCSF. The ionic composition of the recording aCSF was (in mm): NaCl 127, KCl 1.8, KH2PO4 1.2, CaCl2 2.4, MgSO4 1.3, NaHCO3 26, glucose 15 and Phenol Red 0.005 mg/l, and had a pH of 7.4 and measured osmolality 300–310 mosmol kg−1, and was oxygenated with 95% O2/5% CO2. Slices were incubated in recording aCSF for at least 1.5 h prior to commencement of electrophysiological recordings.
Whole-cell current-clamp recordings
Patch electrodes were pulled from thick-walled borosilicate glass capillaries (Harvard Apparatus Ltd, Kent, UK) with a two-stage vertical micropipette puller (PB-7, Narishige, Tokyo, Japan). Resistance of the electrodes was 7–10 MΩ, and they were filled with an intracellular solution containing (in mm): potassium gluconate 130, KCl 10, MgCl2 2, K2-ATP 2, Na-GTP 0.5, Hepes 20 and EGTA 0.5; pH was adjusted to 7.28 with KOH and measured osmolarity was 295–300 mosmol kg−1.
Initially, the LHb was distinguished from the adjacent MHb and floor of the lateral ventricles by visualizing it on a video screen using 10× objective on an Olympus BX51W1 microscope (Olympus UK, Southend-on-Sea, UK) that was equipped with IR video-enhanced differential interference contrast (IR/DIC) optics. Subsequently, LHb neurones were identified under this microscopic examination using a 40× water immersion objective. Since the microscope also incorporated filters optimised for visualising GFP under the 40× water immersion objective, Per1::EGFP-expressing Hb neurones were identified with the aid of a fast integrating highly sensitive camera system (ORCA R2 Cooled Digital Charged-Coupled device Camera, Hamamatsu UK, Welwyn Garden City, UK). Images of these neurones were captured with software (HCImage, Hamamatsu). When targeting the neurones containing EGFP, care was taken to only briefly illuminate the slices with the fluorescence light.
The cell membrane was ruptured under minimal holding currents and negative pressure. All data collected in current-clamp mode were made using a BA-O3X bridge amplifier (npi, Tamm, Germany). Access resistance for all cells used in analysis was ∼15 MΩ. Series resistance was ∼20 MΩ, and cells were discarded from analysis if under basal conditions this value changed by more than 15%. Neurones were also removed from analysis if their RMP was unstable after membrane rupture in whole-cell configuration. Signals were sampled at 30 kHz, stored and analysed on a computer using spike2 software (version 6.00; Cambridge Electronic Design (CED), Cambridge, UK). All data acquisition and stimulating protocols were generated through a micro1401 mkII interface (CED). Neurones, including the EGFP-positive cells, were recorded throughout the LHb. To confirm the accurate targeting of EGFP-expressing LHb neurones, patch pipettes sealed to these neurones were photographed in situ (40× objective) at the end of each recording. All LHb neurones–patch pipette assembly were also photographed at 10× magnification to verify their anatomical localisation within this brain structure.
Membrane properties of LHb neurones
Once the whole-cell configuration was established, neurones were allowed to recover for at least 1 min. Membrane properties, such as RMP, spontaneous firing rate (SFR) and input resistance (Rinput), were determined within 4–5 min of membrane rupture to minimise any potential washout effects from whole-cell recordings. RMP was measured as follows: after ∼1 min when the RMP was stable, a 10 s trace was selected and two cursors were placed on each side. Subsequently, a custom-written Spike2 script was used to estimate the RMP of this trace marked by these two cursors. To determine the AP spike amplitude, we quantified the difference between peak voltage and the RMP of the spike, whereas the spike width was measured at half-amplitude (see supplementary fig. 1A of Sakhi et al. 2014) for additional details). Further, Rinput was estimated using Ohm's law (R = V/I), where V is calculated from the instantaneous voltage deflection induced by negative current pulses [−20 pA; 500 ms) (see supplementary fig. 1B of Sakhi et al. 2014). The neuron's response to inhibitory stimuli was identified by a series of hyperpolarising (−10 to −30 pA; 500 ms duration) current injections. This was then used to appropriately categorise the cells. In some cells, the termination of the hyperpolarising current injection (−20 pA; 500 ms) resulted in a rebound spike that was immediately followed by an after-hyperpolarisation (AHP). The amplitude of this AHP was measured between the trough of the AHP and the RMP of the cell before the current injection. The AHP duration was taken between the onset of the AHP and the time point where the membrane potential returns to baseline (Fig.1A).
Figure 1. Mouse LHb neurones exhibit five distinct states in spontaneous activity and resting condition.
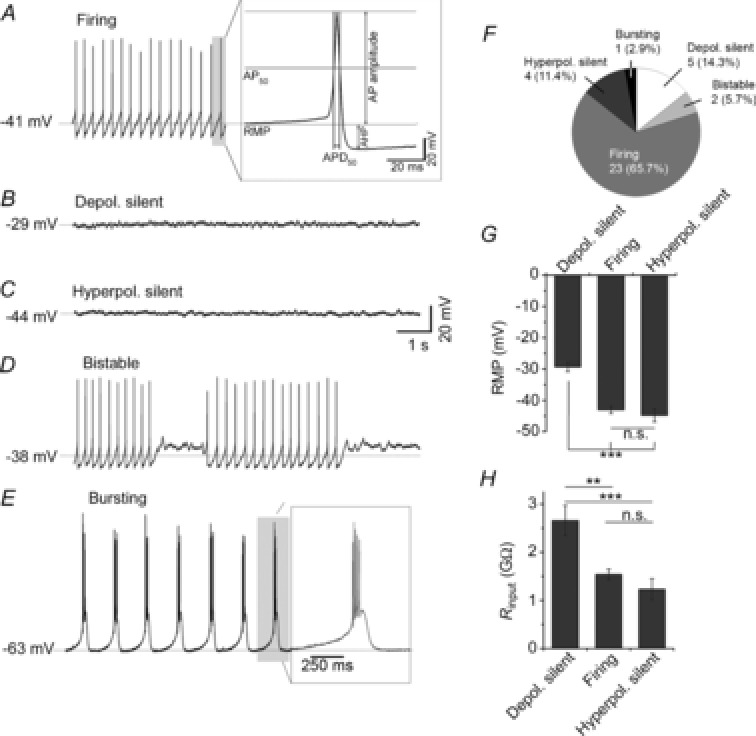
A, firing: most (∼66%) LHb neurones were recorded in a firing state at which their resting membrane potential (RMP) was moderate and they spontaneously discharged action potentials (APs). The grey shaded AP is shown expanded in the inset to demonstrate how the parameters of these APs, including AP amplitude, AP mid-spike amplitude (AP50), mid-spike duration (APD50), after-hyperpolarisation potential (AHP), were measured. B, depolarised-silent: at rest, a minority (∼14%) of LHb neurones are very depolarised and silent [they do not fire APs]. C, hyperpolarised-silent: a minority (∼11%) of LHb neurones recorded were moderately hyperpolarised and silent, failing to spontaneously generate AP firing. D, bistable: a very small proportion (∼6%) of LHb neurones exhibit a bistable state at which they switch between AP firing and a non-AP firing depolarised silence. E, bursting: very rarely (∼3%) LHb neurones exhibited spontaneous bursting of APs. In this state, their resting RMP was initially hyperpolarised and then they showed depolarisation of membrane potential on which they typically produced 3–5 spikes (the grey shaded example is shown in the expanded inset). F, pie chart depiction of the relative proportions of LHb neurones recorded in states A–E. G, clear RMP-related differences in the more frequently sampled LHb neuronal states. In the depolarised-silent state, LHb neurones were significantly more depolarised than those in the firing or hyperpolarised-silent states. H, clear Rinput-related differences in the more frequently sampled LHb neuronal states. Cells in the depolarised-silent state had a significantly higher Rinput than LHb neurones in the firing or hyperpolarised-silent states. **P < 0.01, ***P < 0.001, n.s. = not significantly different (P > 0.05). Broken horizontal lines and mV values in A–E are RMPs for the recordings shown.
Generally, recordings were made for approximately 10 min from each cell. Since whole-cell patch recording cannot be used to record from a single cell over the entire circadian cycle, we recorded from groups of neurones (about five neurones per animal) at various day–night/circadian phases and compared their electrical characteristics as previously described (see Belle et al. 2009; Sakhi et al. 2014).
Synaptic current measurement
Postsynaptic currents (PSCs) were measured from LHb neurones maintained in brain slices prepared as described for current-clamp recordings. PSC frequency was sampled in voltage-clamp mode using an Axopatch 200B amplifier (Molecular Devices, Sunnyvale, CA, USA) with 4–6 MΩ patch pipettes filled with an internal solution that was identical to the one used in current-clamp recordings, except for the following (mm): potassium gluconate 120, KCl 20. With this pipette Cl− concentration, both GABA and glutamate PSCs appear as inward currents when membrane voltage is clamped at −70 mV. A cocktail of receptor antagonists [d-2-amino-5-phosphonopentanoate (AP-5) and 6-cyano-7-nitroquinoxaline-2,3-dione (CNQX) to block glutamate receptors, and/or gabazine to block GABAA receptors] were used to discriminate between AMPA/NMDA/kainate and GABAA receptor-mediated PSC events.
Prior to drug application, the baseline PSC frequency was recorded in aCSF. Then prokineticin 2 (PK2) was bath applied in aCSF for 3 min, and its effects on PSC frequency were recorded. Once the PSC frequency had returned to baseline levels (as assessed by visually inspecting the PSC event frequency after 20 min of washout), the effects of blockade of GABAA and/or glutamate receptors on baseline PSC and PK2-evoked PSCs were determined through bath application of gabazine and/or AP5+CNQX.
Quantification of PSC frequency and amplitude for statistical analysis was done by offline template-based sorting in Clampfit 10.2 (Molecular Devices). PSCs were detected with an amplitude threshold of 10 pA. The Kolmogorov–Smirnov (K–S) test was used for statistical comparisons of amplitude and inter-event interval distributions of PSCs. Cumulative probability distributions were considered significantly different at P<0.01 (K–S test). All numerical data in the text and in graphs represent mean ± SEM.
Per1-luc bioluminescence
Culture preparation
Mice on the Per1-luc background were anaesthetised with isoflurane (Abbott Laboratories) and killed by cervical dislocation. Brains were immediately removed and moistened with ice cold Hank's balanced salt solution (HBSS; Sigma, Poole, UK) supplemented with 0.035% sodium bicarbonate (Sigma), 0.01 m Hepes (Sigma) and 1 mg ml−1 penicillin-streptomycin (Gibco Invitrogen Ltd, Paisley, UK). A coronal block containing the habenula was isolated and 250 μm thick brain slices were cut in cold HBSS using a vibroslicer (Camden Instruments, Loughborough, UK). Slices were then transferred to sterile tissue culture dishes (Corning Inc., New York, USA), and, using a dissecting microscope, the bilateral habenular complex was microdissected (as described in Guilding et al. 2010). Excised tissue was cultured on interface-style Millicell culture inserts (PICMORG50, Millipore (U.K.) Ltd, Watford, UK) in 35 mm glass bottomed cultures dishes (Dow Corning Ltd, Coventry, UK). These contained: 1.2 ml of sterile culture medium (Dulbecco's modified Eagle's medium (DMEM, D-2902; Sigma) supplemented with 3.5 g l−1 d-glucose (Sigma), 0.035% sodium bicarbonate (Sigma), 10 mm Hepes buffer (Sigma), 1 mg ml−1 penicillin-streptomycin (Gibco), B27 (Invitrogen) or 5% fetal bovine serum (FBS; Gibco) and 0.1 mm luciferin (Promega, Southampton, UK) in autoclaved (Milli-Q water). Dishes were sealed with a glass coverslip using autoclaved high-vacuum grease (Dow Corning Ltd) and transferred directly to the EM-CCD-equipped microscope for bioluminescence recording.
Bioluminescence imaging
Bioluminescence emission was imaged with an Olympus LV200 luminescence microscopy system (Olympus, Tokyo, Japan) fitted with a cooled Hamamatsu C9100-13 EM-CCD camera using a 20× 0.4 NA Plan Apo objective (Olympus). The LV200 incubator was maintained at 37°C in darkness. A transmitted light image was recorded prior to the start of each imaging run to aid anatomical localisation of bioluminescence. Acquired images were transferred to ImageJ (version 1.37a, NIH, Bethesda, MD, USA) and a region of interest tool was used to delineate discrete areas (LHb, ependymal cells of the third ventricle and single cells) and assess relative bioluminescence over time. Putative single cells were identified and distinguished from background noise and isolated cosmic events by their characteristic size, shape and temporal expression profile.
Bioluminescence data analysis
Bioluminescence data were smoothed with a 3 h running average. The resulting columns of data were plotted and period (peak–peak and trough–trough averaged) and rate of damping [the number of cycles observed before bioluminescence levels reached the previously determined level of dark noise (±10%)] were assessed manually by two experienced, independent researchers.
Extracellular multi-electrode recordings
Multi-electrode recordings were performed at 35°C on 250 μm thick coronal habenula brain slices prepared from Per1::d2EGFP mice. For this, a 64 electrode perforated multi-electrode array (60pMEA100/30iR, Multichannel Systems GmbH, Reutlingen, Germany) was used. Brain slice preparation and anatomical coordinates of the sections used were as described for whole-cell recordings above. Tissue slices were kept at room temperature for at least 1 h before transferring to the pMEA chamber and continuously perfused (∼3 ml min–1) with gassed (95%O2/5%CO2) recording aCSF, preheated with a perfusion cannula (Multichannel Systems) at 35°C. The temperature in the recording chamber was constantly monitored. To accurately position the habenula slices on the electrode contacts, the sections were trans-illuminated from below the array and the brain slice–array assembly was visualised with a binocular microscope fitted with a USB 1.3×1.3 Mpixel web camera. Under this configuration, the location of each of the electrodes contacting the habenula slices can be clearly seen and photographed in situ. This was then used to accurately locate the positioning of each recording electrode. Brain slices were allowed to recover for at least 30 min before data acquisition commenced.
Recordings were sampled at 25 kHz and acquired using an MEA2100 amplifier and MC Rack 4.5.1 software (Multichannel Systems). After termination of the acquisition of experimental data, TTX (1 μm) was bath applied to inhibit electrical activity and to confirm that all events recorded and analysed were indeed APs. AP waveform data from active channels were converted with MC-Data Tools (Multichannel Systems), and 3 min of the 15 min of data collected in each condition was analysed using event detection analysis in ClampFit (Molecular Devices). To ensure detection of activity of cells closest to the electrodes and therefore to maximise the signal-to-noise ratio, a highly conservative threshold level was set for spike detection and waveform sorting. To do this, the baseline noise level (∼ ±8 μV) recorded at each electrode during TTX application to the LHb slices was first measured. The threshold level to detect and sort spikes was then set at least twice this TTX baseline value (some channels showed action potential activity that was ∼4× TTX baseline value). With the current configuration of amplifier, 32 channels per MEA could be monitored per experiment. Across these three experiments, electrical activity at only 19 electrodes could be detected with these criteria. Subsequent AP waveform detection and spike sorting indicated that such activity measured at each of these 19 electrodes could be ascribed as putative single unit activity.
In vivo electrophysiology
Multi-electrode recordings were performed in urethane anaesthetised (1.55 g kg−1) adult male mice, using methods similar to those described previously (Brown et al. 2011b). In brief, recording probes (A4×8–5 mm-50-200-177; Neuronexus, Ann Arbor, MI, USA) consisting of four shanks (spaced 200 μm), each with eight recording sites (spaced 50 μm) were coated with fluorescent dye (CM-DiI; Invitrogen) and inserted to the brain in coronal orientation, 18 deg from vertical using the following coordinates: 1.8 mm caudal and 1.3 mm lateral to bregma (centre of probe). Probes were then lowered to a depth of 2.6 mm such that recording sites spanned the LHb. In some experiments (3/6) after recording in this position, we subsequently raised the electrode array by 400 μm and recorded a second set of responses.
After allowing 30 min for neural activity to stabilise following probe insertion, wideband neural signals were acquired using a Recorder64 system (Plexon, Dallas, TX, USA), amplified (×2000) and digitised at 40 kHz. Action potentials were discriminated from these signals offline as ‘virtual’-tetrode waveforms using custom MATLAB scripts (Mathworks, Natick, MA, USA). In brief, data were high pass filtered in forward and reverse directions (300 Hz, 4th order Butterworth) and grouped as overlapping sets of linear tetrodes (three tetrodes covering the eight recording sites on each shank). Tetrode waveforms (40 samples per channel) were then discriminated by threshold crossing (typically 40 μV) and sorted manually using commercial principal components based software (Offline sorter; Plexon). Single unit isolation was confirmed by reference to MANOVA F statistics, J3 and Davies-Bouldin validity metrics (Offline sorter) and the presence of a distinct refractory period (>1.5 ms) in the interspike interval distribution. Special care was taken to ensure that no cell was discriminated more than once on overlapping tetrodes (confirmed via cross correlogram analysis of unit firing).
Visual stimuli
All light measurements were performed using a calibrated spectroradiometer (Bentham Instruments, Reading, UK). Full field visual stimuli were generated via two LEDs (λmax 410 nm; half-width: ±7 nm; Thorlabs, Newtown, NJ, USA) independently controlled via LabVIEW (National Instruments, Austin, TX, USA) and neutral density filter wheels (Thorlabs). Light was supplied to the subject via 7 mm diameter flexible fibre optic light guides (Edmund Optics, York, UK), positioned 5 mm from each eye and enclosed within internally reflective plastic cones that fit snugly over each eye, preventing any off-target effects due to scattered light.
Responses were assessed from ZT6 to ZT12 using two different protocols. The first was designed to determine the relative magnitude and sensitivity of eye-specific responses. Here, mice were maintained in darkness and 5 s light steps were applied in an interleaved fashion to contra- and/or ipsilateral eyes for a total of 10 repeats at logarithmically increasing intensities spanning 9.8–15.8 log photons cm–2 s–1 (interstimulus interval 20–50 s depending on intensity). Because all mouse photoreceptors display similar sensitivity to the wavelengths contained in our stimuli, after correction for pre-receptoral filtering (Enezi et al. 2011), effective photon fluxes for each mouse opsin were between 0.5 (M- and S-cone opsins) and 0.3 log units (melanopsin) dimmer than this value. Intensities reported here reflect effective irradiance for rod opsin, which is intermediate between these extremes (9.4–15.4 log photons cm–2 s–1). In the second protocol we stepped binocular light intensity every 30 s between one of three logarithmically spaced intensities (13.4–15.4 log effective photons cm–2 s–1) in a sequence that covered every possible transition between the three intensities.
Histology
At the end of each experiment, mice were overdosed with urethane (2 g kg−1) and within 90 s of opening of the thoracic cavity they were perfused transcardially with 0.1 m PBS followed immediately by 4% paraformaldehyde. The brain was removed and post-fixed in 4% paraformaldehyde for 30 min and subsequently cryoprotected in 30% sucrose. The following day, brains were sectioned at 100 μm on a freezing sledge microtome and mounted directly onto slides using Vectashield (Vector Laboratories Ltd, Peterborough, UK).
After mounting, DiI-labelled probe placements were visualised under a fluorescent microscope (Olympus BX51) with appropriate filter sets, and resulting images were scaled to account for shrinkage (based on the known distance between electrode shanks) and aligned with appropriate stereotaxic atlas figures (Paxinos & Franklin, 2001). Anatomical locations of recorded cells were then estimated from these images, based on the known geometry of the electrode array. Maps of multi-unit firing responses were constructed by averaging multi-unit activity observed at electrode sites falling within a moving circular window (radius 100 μm; step size 50 μm). Resulting plots were then smoothed by cubic spline interpolation.
For visualisation of mRGC projections, brains of Opn4tau-lacZ mice were first processed as described above and then X-gal staining was performed using established methods (Hattar et al. 2006). Brain sections were washed twice for 10 min each in buffer B (0.1 m PBS at pH 7.4, 2 mm MgCl2, 0.01% sodium desoxycholate and 0.02% octylphenoxypolyethoxyethanol). Sections were then incubated for 18 h in staining solution [buffer B with potassium ferricyanide (5 mm), potassium ferrocyanide (5 mm) and X-gal (Bioline Reagents Ltd, London, UK; 1 mg ml−1)] at 37°C in darkness. Following staining, sections were washed twice for 5 min in 0.1 m PBS and mounted on slides using Vectashield.
Drugs
Stock solutions for PK2 (Phoenix Pharmaceuticals, Burlingame, CA, USA), gabazine, AP-5, CNQX and TTX (all purchased from Tocris, Bristol, UK) were prepared in distilled water. The final concentrations of solutions were made in aCSF.
Statistical analysis
Most data were statistically analysed using Graphpad Prism Version 5.04 (Graphpad, La Jolla, CA, USA), while some data were analysed using Systat Version 10 or SPSS (Systat/SPSS Software Inc., Chicago, IL, USA). Most grouped data were analysed by paired t-test or ANOVA followed by post hoc (Tukey or Bonferroni) test. In vitro extracellular recordings were analysed by related-samples Friedman's multiple comparisons followed by the Wilcoxon test. Values were considered statistically significant at P < 0.05. All values, both in the text and in graphs, are presented as mean ± SEM.
Results
Our original intention was to selectively record from LHb neurones in which the EGFP construct was readily visible (Per1::EGFP+ve) and LHb neurones in which the construct was not detectable (Per1::EGFP-ve) to determine if and how their membrane properties differed. However, in pilot studies we found no obvious differences between such cells and indeed, unlike in the SCN, where EGFP+ve neurones are readily distinguishable, the level of EGFP signal in the LHb was very low. So we made no further attempts to discriminate between EGFP+ve and EGFP-ve neurones. The absence of overt EGFP+ve neurones in the LHb may reflect the short Per1 promotor sequence used to drive the expression of EGFP and/or the low level of endogenous Per1 expression in the habenula complex (Shieh, 2003). Since this is the first comprehensive investigation of circadian-driven electrophysiological behaviour of murine LHb neurones, we first describe the spontaneous states of LHb neurones with respect to their membrane properties, then investigate the daily variation in these states and determine how the absence of a functional molecular clock influences the temporal expression of LHb neuronal activity. We also assessed how a putative SCN output factor, PK2, influenced LHb neuronal activity. Finally, through in vivo recordings, we examine how LHb neurones respond to retinal illumination.
To determine the basic membrane properties of mouse LHb neurones, we initially recorded from 35 cells from the mid to late day (ZT6–12). LHb neurones were heterogeneous in their baseline electrical states and based on spontaneous firing of APs, RMP and Rinput, we distinguished five spontaneous states (see Fig.1): (1) firing, (2) depolarised-silent, (3) hyperpolarised-silent, (4) bistable and (5) bursting. We could not detect any obvious difference in the occurrence of these states in medial (LHbM) vs. lateral (LHbL) regions of the LHb, an observation generally consistent with the rat (Kowski et al. 2009).
Firing state
The majority of LHb neurones (n = 23/35; ∼66%) showed spontaneous repetitive firing of APs in a frequency range of 0.2–11.8 Hz, with a mean firing rate of 4.1 ± 0.6 Hz (Fig.1A). Cells in this state rested between −36 and −50 mV and had an average RMP of −41.3 ± 0.9 mV, while their mean Rinput was estimated as 1.5 ± 0.1 GΩ. From 10 s epochs taken from 10 randomly selected firing neurones, the average amplitude of APs was estimated at 62.5 ± 1.8 mV, with an average mid-spike duration of 3.2 ± 0.3 ms (APD50). The average AHP of these APs was estimated as 8.3 ± 0.7 mV (expansion in Fig.1A illustrates how AP50, APD50 and AHP were calculated).
Depolarised-silent state
In this infrequently observed state, LHb neurones (n = 5/35; ∼14%) were spontaneously depolarised and did not discharge APs (Fig.1B). These electrically silent neurones rested at membrane values between −24 and −33 mV, with a mean RMP of −29.3 ± 1.5 mV and Rinput of 2.7 ± 0.3 GΩ.
Hyperpolarised-silent state
In this infrequently recorded state (n = 4/35; ∼11%), cells were silent at rest and completely lacking in spontaneous discharge of APs (Fig.1C). These non-spiking silent cells rested at relatively hyperpolarised levels, with the RMP ranging between −40 and −51 mV (mean RMP: −44.8 ± 2.1 mV), and an average Rinput of 1.2 ± 0.2 GΩ.
Bistable state
Two of the 35 (∼6%) cells showed bistability in their resting state, whereby they rapidly shifted between periods of spontaneous AP spiking and non-spiking (silence). An example recording is shown in Fig.1D. This neurone rested at a relatively depolarised RMP (∼−38 mV) with Rinput of ∼1.6 GΩ.
Burst firing state
One of the 35 (∼3%) cells spontaneously generated oscillations of burst AP discharge at rest (Fig.1E). The cell rested at a comparatively hyperpolarised level (RMP: ∼−64 mV), with a low Rinput of ∼0.2 GΩ, and typically produced 4–5 APs per burst (inset in Fig.1E shows expanded view of burst firing highlighted in grey shading).
Figure1F summarises the relative proportions of the 35 LHb neurones sampled in these different states. To statistically compare the parameters of these different states, we randomly sampled 10 of the spontaneously firing cells and compared their parameters with those of the depolarised-silent (n = 5) and hyperpolarised-silent (n = 4) cells. For RMP, one-way ANOVA indicated clear state-related differences (F2,18 = 27.3, P < 0.001), with cells in the depolarised-silent state (mean RMP = −29.3 ± 1.5 mV) being significantly more depolarised than cells in the spontaneously firing or hyperpolarised-silent states (Bonferroni post hoc tests, all P < 0.001; Fig.1G). Similarly, Rinput varied in a state-related manner (one-way ANOVA, F2,18 = 4.9, P < 0.05), with cells in the depolarised-silent state having significantly higher Rinput than cells in the firing or hyperpolarised-silent states (Bonferroni post hoc test, P < 0.01–0.001; Fig.1H).
To further characterise these states, we determined the responses of neurones to brief (500 ms) hyperpolarising injections of current. With the termination of the hyperpolarising current pulses, 82% of neurones showed burst firing of 3–5 APs per burst for 1–5 s, before transitioning into the firing state. Figure2A illustrates how a slow firing cell responded to this stimulus. The remaining 18% of neurones did not show burst firing, but instead returned to the spontaneous firing state within 0.5–5 s (Fig.2B and C). Such behaviour on termination of the hyperpolarising current injection occurred independently of the cells’ initial state and did not delineate any spontaneous state (data not shown).
Figure 2. Transition of the spontaneous electrical behaviour in LHb neurones through current injection.
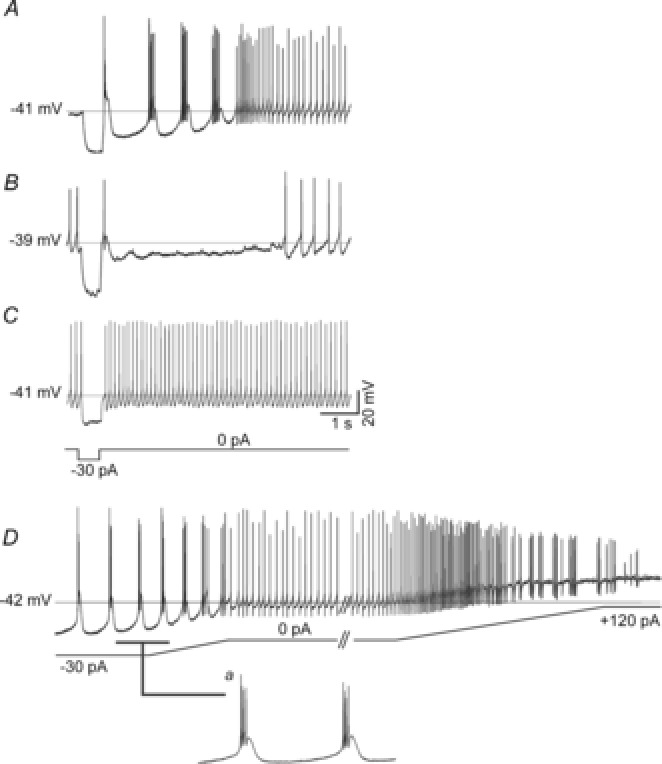
Transient (0.5 s) injections of negative current (−10 to −30 pA) were applied to calculate Rinput following which different rebound behaviours including bursting (A), single AP firing with prolonged hyperpolarisation (B) or immediately returning to resting state (C) were observed. D, intrinsic states are recapitulated through sustained injection of ramps of negative and positive currents. This LHb neurone transitioned states from the bursting (inset a) to the bistable and then to the depolarised-silent state as the RMP was systematically hyperpolarised and depolarised by injection of negative and positive currents. Broken horizontal lines and mV values in A–D are the RMPs for the cell recordings shown.
The prevalence of burst firing evoked following termination of hyperpolarising pulses in 82% of cells suggests that this is a property common to most LHb neurones. To further explore this, all 35 cells were given longer lasting (up to 12 s) ramps of negative and/or positive current injection. Under these conditions, as spontaneously depolarised-silent cells were manually hyperpolarised, they exhibited the characteristics of cells in the more hyperpolarised states, while cells hyperpolarised-silent in their resting state showed firing of APs and silencing through depolarisation as they were injected with positive current (Fig.2D). Neurones also showed burst firing with the hyperpolarising current (inset a in Fig.2D). Since all the resting states could be recapitulated by manipulating RMP, this indicates that the spontaneous states recorded do not represent different types of LHb neurones, but rather reflect states at which the LHb neurones rest.
To examine whether some of these states are driven by AP-dependent communication, we recorded the baseline activity of a further eight cells (five firing, three hyperpolarised-silent) and determined how treatment with TTX (1 μm) influenced these states. Since TTX prevents neurones from generating APs, we measured RMP and Rinput (data not shown) and found that TTX did not significantly influence these parameters (paired t-tests, both P > 0.05; summarised in Fig.3C). Figure3A illustrates the absence of effect of TTX on the RMP of LHb neurones in either a firing state (upper trace) or a hyperpolarised-silent state (lower trace). Treatment with TTX also had no effect on the depolarisations in membrane potential that underpin burst firing following transient hyperpolarisation (Fig.3B; upper trace without TTX, lower trace with TTX). These data indicate that the firing and hyperpolarised states of LHb neurones as well as their response to transient hyperpolarisation arise through intrinsic mechanisms that are independent of AP communication.
Figure 3. Spontaneous LHb neuronal states are intrinsically generated.
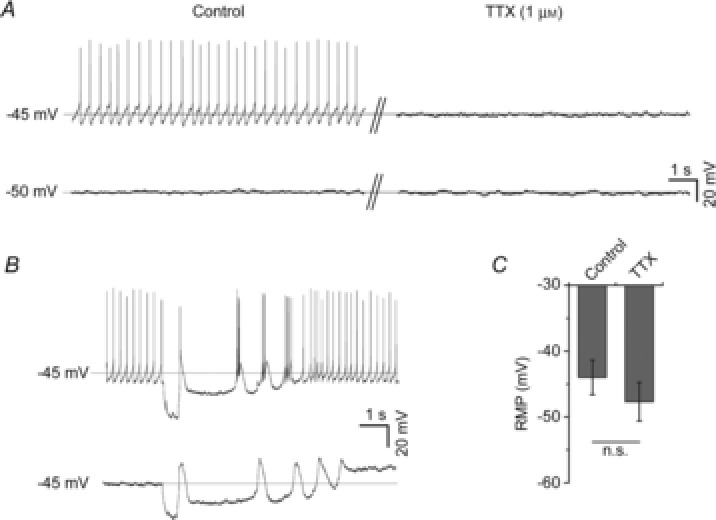
A, in whole-cell current clamp recordings, cessation of AP-dependent communication through blockade of voltage-dependent Na+ channels with TTX (1 μm) had little effect on the RMP of cells (n = 5) in the firing state (upper trace) or cells (n = 3) in the hyperpolarised-silent state (lower trace). B, following injection (0.5 s) of −20 pA of current, cells (n = 5) in the firing state show transient depolarised oscillations in membrane potential and burst AP firing (upper trace). These oscillations in membrane potential evoked following injection of negative current are sustained in the presence of TTX and are therefore an intrinsic property of the cells (lower trace). C, absence of effect of TTX on the RMP of cells in the firing and hyperpolarised-silent states. n.s., P > 0.05. Broken horizontal lines and mV values in A and B are the RMPs for the cell recordings shown.
Circadian variation
The LHb is implicated as part of an extended neural circadian system (Tavakoli-Nezhad & Schwartz, 2006; Guilding & Piggins, 2007; Dibner et al. 2010; Paul et al. 2011) and rodent LHb brain slices express 24 h rhythms in extracellularly recorded AP firing and molecular activities (Zhao & Rusak, 2005; Guilding et al. 2010). To determine if the bioelectric properties of mouse LHb neurones also exhibit daily variation, we made whole-cell current-clamp recordings and sampled 144 neurones in the LHbM and LHbL across the 24 h day–night cycle. Using protocols described above, we measured RMP, Rinput and AP firing rate as well as responses to transient and sustained current injection. Based on the time of this 24 h cycle at which the cells were sampled, data from the recordings were allocated to one of 6 h time bins (ZT0–6, 6–12, 12–18 and 18–24; ZT0 = lights-on, ZT12 = lights-off). The states detailed above were detected at all phases of the light–dark cycle with no obvious time-dependent variation (data not shown). Thus, across all time bins, the firing state was the most commonly recorded state (106 of 144 cells; ∼74%; Fig.4A). For these spontaneously AP discharging cells (n = 106), comparison of RMP and Rinput across the four 6 h time bins indicated that there was no effect of time on these parameters (one-way ANOVAs, both P > 0.05; data not shown). However, for AP discharge, a clear time effect was found (F3,103 = 3.19, P < 0.05), with mean spike firing rate increasing significantly from 3.1 ± 0.4 spikes s–1 at ZT0–6 to 5.0 ± 0.5 spikes s–1 at ZT6–12 (Tukey test, P < 0.05; Fig.4B).
Figure 4. AP firing rate of LHb neurones varies across the 24 h day–night cycle and depends on a functional molecular clock.
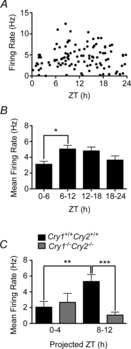
A, scatter plot showing AP firing rate of individual LHb neurones. Each black dot represents the rate of firing of an individual cell at the time of recording. B, mean firing rate of LHb neurones increases from early day (ZT0–6) to late day (ZT6–12) and slowly declines over the night (ZT12–24). C, in Cry1+/+Cry2+/+ mice with an intact molecular clock, the mean firing rate of LHb neurones increases significantly from the early (ZT0–4) to late (ZT8–12) projected day. Such variation is absent in recordings of LHb neurones from Cry1−/−Cry2−/− mice that do not have a functional molecular clock. *P < 0.05, **P < 0.01, ***P < 0.001. ZT, Zeitgeber time.
Loss of the molecular clock
The finding that the spontaneous firing rate of mouse LHb neurones varies across the day–night cycle demonstrates that extrinsic and/or intrinsic factors shape the daily profile of LHb neuronal activity. We next tested the contribution of a functional molecular circadian clock to neuronal rhythms in the LHb. To this end, we recorded from LHb neurones in brain slices prepared from mice lacking the cryptochromes genes (Cry1−/−Cry2−/−), in which the molecular clock does not function, and compared them with similar recordings from LHb neurones of congenic littermates whose molecular clock is intact (Cry1+/+Cry2+/+ mice). To reduce the influence of the external LD cycle, slices were prepared from mice that had been transferred from the LD condition to constant dark for 48–72 h prior to slice preparation. We targeted our recordings at two epochs, projected early and late day (ZT0–4 and 8–12, respectively), since these corresponded with the phases of the LD cycle at which the spontaneous firing rate of Per1::d2EGFP mouse LHb neurones showed most significant changes.
Thirty-two Cry1+/+Cry2+/+ LHb neurones were recorded and subjected to hyperpolarising current injections as described above. Eighteen of the 32 neurones (∼56%) were spontaneously firing APs, whereas the remaining cells were either hyperpolarised-silent (13/32; ∼38%) or rested in a bistable state (1/32; ∼6%). The proportions of the Cry1+/+Cry2+/+ LHb neurones in these states were similar to those found for LHb neurones sampled from Per1::EGFP mice. These cells showed similar responses to hyperpolarising current injections as Per1::d2EGFP mouse LHb neurones (data not shown). Fifty-three LHb neurones were recorded from Cry1−/−Cry2−/− mouse slices, with 21 neurones spontaneously discharging APs (∼40%) and 27 (∼51%) in the hyperpolarised-silent state, with the remaining (∼9%) in the bistable, depolarised-silent or burst firing states. These neurones showed similar responses to hyperpolarising current injections as Cry1+/+Cry2+/+ LHb cells, indicating that the fundamental properties of LHb neurones are not overtly affected by the absence of the cryptochrome genes (data not shown). To determine if the loss of these key components of the molecular circadian clock influenced the temporal changes in LHb neurones, we compared the frequency of AP discharge of cells in the firing state. Two-way ANOVA indicated a significant effect of time (F1,74 = 7.7, P < 0.01) and time × genotype interaction (F1,74 = 8.6, P < 0.01). Bonferroni post hoc comparisons showed that the firing rate of Cry1+/+Cry2+/+ LHb neurones varied significantly from projected ZT0–4 to ZT8–12 (P < 0.05; Fig.4C), while that of Cry1−/−Cry2−/− did not (P > 0.05). Indeed, the firing rate of Cry1+/+Cry2+/+ LHb neurones at ZT8–12 (5.3 ± 0.9 spikes s–1) was significantly higher than that of Cry1−/−Cry2−/− neurones (1.1 ± 0.4 spikes s–1) at this time (Bonferroni post hoc test, P < 0.05; Fig.4C). Notably, the firing activity of the Cry1−/−Cry2−/− LHb neurones remains low at both projected ZT0–4 and 8–12. Therefore, in the absence of a functional molecular circadian clock, LHb neurones do not express the daily temporal change in the firing rate.
Previously, we reported that in coronal mouse Hb slices, rhythmic bioluminescent PER2::LUC signals could be visualised and monitored via photovideomicroscopy from a small number of cells in the LHbM (Guilding et al. 2010). To determine whether rhythms in another reporter of the molecular clock could be detected in the LHb and to evaluate how the loss of the molecular clock could affect these signals, we made coronal LHb sections from Cry1+/+Cry2+/+ and Cry1−/−Cry2−/− mice which carry a luciferase reporter of the Per1 gene and investigated this clock-driven bioluminescent signal (Per1-luc) in tissue explants through photovideomicroscopy. Similar to the PER2::LUC recordings reported previously (Guilding et al. 2010), in Cry1+/+Cry2+/+ Hb slices, rapidly damping, low amplitude rhythms in Per1-luc expression were detectable at the whole LHb level for up to three cycles in vitro (Fig.5A, and Ba,b). The most obvious source of this signal was a cluster of cells in the LHbM (Fig.5A), although some cells were observed scattered in the lateral LHb. In the LHbM, ∼8–20 cells were detected per slice, but these quickly diminished in amplitude and did not appear to maintain obvious synchrony in the phase of their rhythms (Fig.5Bb). By comparison, with the same recording settings as used with Cry1+/+Cry2+/+ animals, Per1-luc signals could not be detected in Cry1−/−Cry2−/− Hb slices. By increasing the gain of the EM-CCD camera, signals could be detected in the Cry1−/−Cry2−/− LHb but these did not cycle (Fig.5Ba). Therefore, rapidly damping low amplitude rhythms in Per1-luc expression which are dependent on a functional molecular clock are detectable in the LHb and in cells in the LHbM.
Figure 5. Rapidly dampening circadian variation in Per1-luc bioluminescence expression in the LHb of Cry1+/+Cry2+/+ mice, but not Cry1−/− Cry2−/− mice.
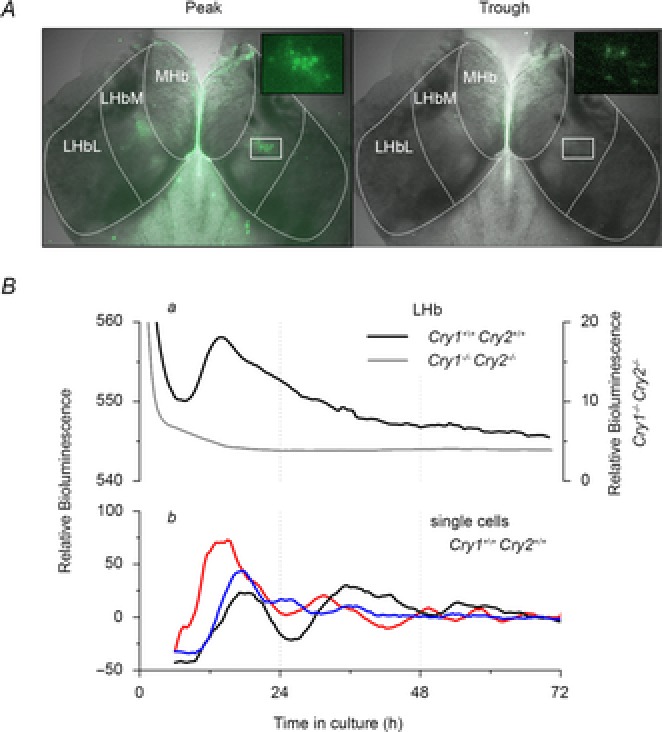
A, EM-CCD images overlaid on brightfield image of a live Hb slice, illustrating Per1-luc bioluminescence (coloured green to aid visualisation) in the LHb and ependymal cell layer when Per1-luc expression is at its peak (left photomicrograph) and trough (right photomicrograph). In each photomicrograph, insets highlight clusters of Per1-luc cells in the LHbM. B, representative plots of relative bioluminescence expression of the LHb (a, delineated by white broken line in A) of both genotypes and bioluminescence expression (b) of three typical cell-like regions of interest of Cry1+/+Cry2+/+ mouse LHb explants. Even with a greatly expanded scale on the ordinate, circadian oscillations in Per1-luc bioluminescence could not be detected in the Cry1−/− Cry2−/− LHb explants. Single cells from Cry1+/+Cry2+/+ congenic WT explants exhibit rapidly dampening circadian rhythms in Per1-luc expression over several days, indicating a degree of intrinsic rhythmicity in LHb neurones.
Extrinsic regulation of the LHb
PK2 suppresses LHb neuronal activity
The main mammalian circadian pacemaker in the SCN conveys time of day information to the rest of the brain through neural and paracrine signals. One neuropeptide that is hypothesised to function as an SCN output signal is PK2 (Cheng et al. 2002). This neuropeptide is synthesised by SCN neurones which innervate other SCN cells as well as extra-SCN brain sites, including the LHb (Zhang et al. 2009). PK2 acts via the PK2 receptor, and mRNA for this receptor is expressed in the LHb (Cheng et al. 2002). At present, it is unclear if LHb neurones are responsive to PK2, and therefore we determined the effects of PK2 on the electrophysiological activity of spontaneously firing LHb neurones. From multi-electrode extracellular recordings, we discriminated 19 putative single units; all signals abolished at the termination of the recording by TTX (Fig.6A). We then determined that exogenously bath applied PK2 (200 nm) predominantly suppressed spontaneous activity in these putative single LHb neurones (compare Fig.6A baseline vs. PK2). In response to 5 min exposure to PK2, 8 of 19 of these putative neurones (∼42%) decreased AP firing by ∼40%, from 1 ± 0.3 to 0.6 ± 0.2 Hz (Wilcoxon test, P < 0.05; Fig.6A and B). Interestingly, with washout of PK2, we noted that two of the eight PK2-suppressed neurones altered their firing pattern to burst firing. In the remaining putative single neurones (11/19) bath applied PK2 had no effect on baseline AP frequency (data not shown). Since the few studies investigating the effects of PK2 on brain cells have mainly reported excitatory actions of this neuropeptide (Cottrell et al. 2004; Ren et al. 2011), the present results suggest that PK2 could be acting trans-synaptically to elevate inhibitory signals. To assess this, we allowed PK2-responsive cells to return to baseline firing, and then we bath applied the GABAA receptor antagonist gabazine (20 μm) prior to and during a subsequent PK2 treatment. Friedman multiple comparisons test (baseline vs. PK2 vs. gabazine+PK2) revealed that the significant suppressive main effect of PK2 on the baseline activity of LHb neurones was attenuated in the presence of gabazine (Friedman test χ2 = 7.161, P < 0.05; subsequent comparison of baseline vs. gabazine+PK2; Wilcoxon test P > 0.05; Fig.6A and B). In some putative single units (4 of 8 tested), gabazine alone caused a small elevation in baseline firing (from 1.1 ± 0.4 to 1.5 ± 0.9 Hz; P > 0.05, Wilcoxon test; data not shown), suggesting the presence of basal inhibitory GABAergic tone in the LHb. These results suggest that PK2 suppresses LHb neurones by increasing trans-synaptic GABA release.
Figure 6. Prokineticin 2 (PK2) suppresses LHb neurones by increasing GABAergic tone.
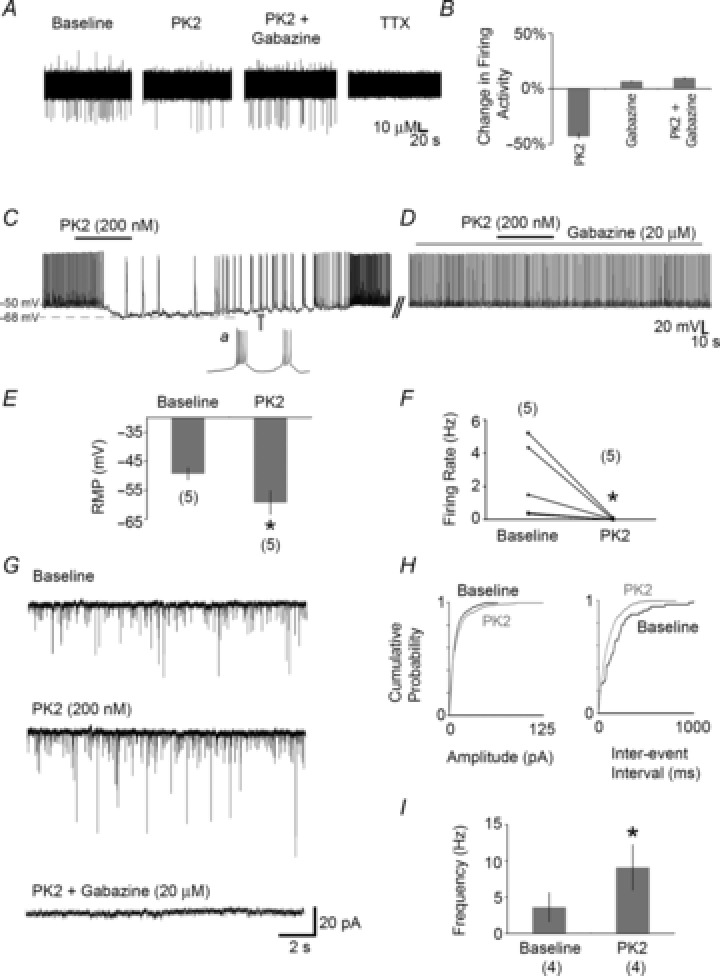
A, an extracellular recording of a putative single LHb neurone showing firing activity suppression with PK2. No such suppressive effect of PK2 was seen when this drug was applied with gabazine (selective GABAA receptor antagonist). TTX treatment abolished AP firing in all extracellular recordings. B, summary of percentage change in activity of LHb cells with PK2 with and without gabazine. C, current clamp recording showing suppression of membrane potential and AP firing rate in an LHb neurone by bath applied PK2. Note that during hyperpolarisation, this cell changed its firing behaviour from tonic to burst firing (concurrent with and following PK2 application – inset a). D, typical example showing that co-application of gabazine in the aCSF (four cells) prevented the suppressive effect of PK2 on cells that previously showed sensitivity to this neuropeptide (C). E and F, summary of the effects of PK2 on RMP (E) and firing rate (F) of LHb neurones (5/19 cells responded in this manner). G–I, in a separate sample of cells recorded in voltage clamp mode, bath applied PK2 caused a significant increase in the frequency but not amplitude of spontaneous postsynaptic currents (sPSCs: 4/15 LHb cells). G, typical voltage clamp traces recorded from LHb neurones showing increased sPSC frequency with bath applied PK2. These sPSC events were abolished when gabazine was co-applied with PK2 in the recording aCSF. H, normalised cumulative graphs of amplitude and inter-event intervals for the cell shown in G. I, summary of the frequency of sPSCs at baseline and during PK2 bath application. *P < 0.05. Number of cells tested in each condition is shown in parentheses. Broken horizontal lines in C show the pretreatment RMP (−50 mV) and post-treatment membrane potential (−68 mV) for the recorded cell shown.
To further explore the actions of PK2 on the membrane properties of mouse LHb neurones, we performed whole-cell patch recordings and assessed the effects of PK2 on RMP and SFR. In recordings made in current-clamp mode, bath application of 200 nm PK2 significantly hyperpolarised and suppressed AP firing in 5 of 19 cells (∼26%) tested (Fig.6C, E and F). In 2 cells, the hyperpolarising actions of PK2 transiently silenced all AP firing. Consistent with observations from extracellular recordings, as PK2 washed out, some LHb neurones (2 of the 5 cells that were suppressed by PK2) began to depolarise to baseline RMP and showed burst AP firing (inset below Fig.6C). Since in both, extracellular and current-clamp recordings, we observed inhibitory actions of PK2, and because we found that the extracellularly recorded actions of PK2 were attenuated by gabazine, we further tested the possibility that PK2 acts to recruit inhibitory GABAergic mechanisms to suppress LHb activity. When we co-applied gabazine, the hyperpolarising and AP suppressing actions of PK2 in whole-cell recordings were absent (Fig.6D). This supports the interpretation of our extracellular recordings that PK2 suppresses LHb neurones through GABA–GABAA signalling.
To confirm that PK2 acts presynaptically to enhance the release of GABA which then acts on the postsynaptic GABAA receptor, we subsequently made voltage-clamp recordings from LHb neurones and determined how PK2 altered the frequency and amplitude of spontaneous PSCs (sPSCs). From 15 cells tested, 4 (27%) were found to be responsive to PK2. In recordings from these 4 PK2-sensitive LHb cells, application of PK2 significantly increased the frequency but not the amplitude of sPSCs (Fig.6G–I). Subsequent treatment with gabazine abolished all sPSCs as well as PK2's evoked increases in the frequency of sPSCs (Fig.6G). This firmly establishes that PK2 acts presynaptically to increase GABA–GABAA inhibitory signalling in the LHb.
Activation of light-input pathways alters LHb activity in vivo
We next aimed to determine whether neurones in the mouse LHb received information about external illumination, as suggested by anatomical studies (Hattar et al. 2006) and physiological recordings in the rat (Zhao & Rusak, 2005). To this end, we performed multi-electrode recordings (from 32 channels) from the Hb and surrounding brain regions of urethane anaesthetised mice (n = 9 probe placements from six mice; recordings made from ZT6 to ZT12).
We started by evaluating multi-unit responses evoked by full field binocular illumination (410 nm LED; 5 s steps; 15.4 log photons cm–2 s–1). We chose this wavelength since all mouse opsins are equally sensitive in this region of the spectrum. Accordingly, for the mouse visual system, this stimulus provides a good approximation to natural daylight (Enezi et al. 2011).
Using this stimulus, we found robust changes in multi-unit firing across the LHb and neighbouring posterior thalamus (Fig.7A). Broadly in line with the distribution of mRGC inputs to these regions as revealed by X-gal staining in Opn4tau-LacZ reporter mice (Fig.7B; Hattar et al. 2006), these electrophysiological responses were largest around the dorsal and lateral borders of the LHb (Fig.7C). Nonetheless, the spatial extent of these responses was considerably greater than suggested by this anatomical reporter (compare Fig.7B with C). Moreover, in the most part these responses developed very slowly, taking several hundred milliseconds to become apparent. The exception to this observation was a small region of the posterior thalamus, lateral to the LHb, where we found much more rapid visual responses (∼50 ms; Fig.7A), more in line with those we observe in the SCN and more conventional visual targets (Brown et al. 2011b).
Figure 7. Visual responses in the mouse LHb.
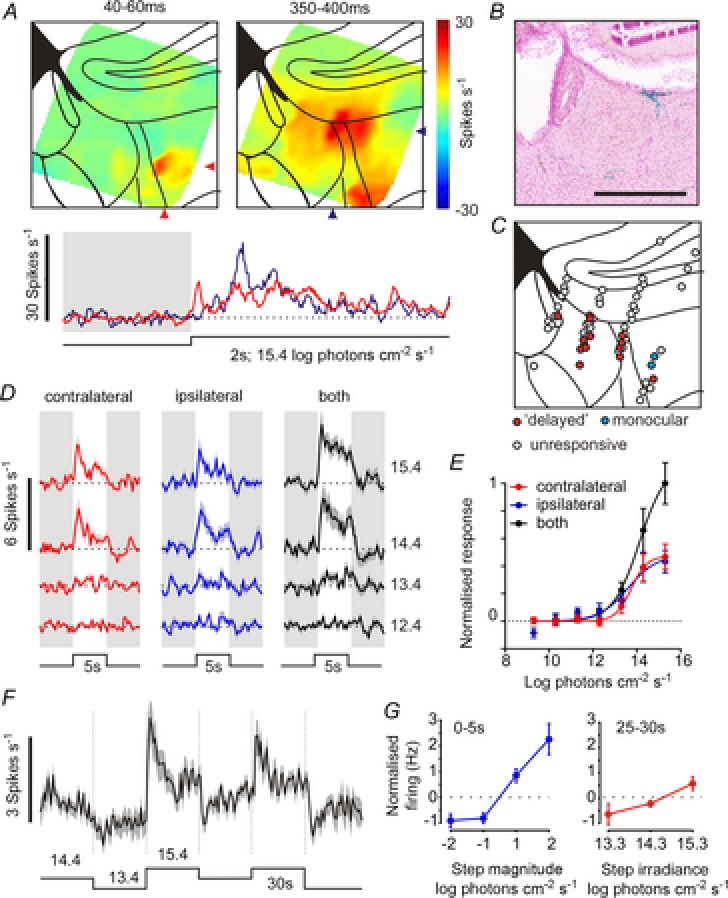
A, (top) heat maps showing average multi-unit firing in the LHb and surrounding regions, evoked by bright (15.4 log effective photons cm–2 s–1; 410 nm LED) binocular light steps. Data derive from nine multi-electrode probe placements across six mice and show mean 40–60 ms after start of light step (left) or 350–400 ms after (right). The bottom plot shows the average time course of multi-unit firing response at the locations indicated by arrows in the plots above. B, X-gal-stained section from an opn4tau-LacZ reporter mouse, showing melanopsin expressing retinal ganglion cell fibres around the border of the LHb. C, projected anatomical locations of 67 single units isolated from multi-electrode recordings including 14 cells with sluggish binocular responses (‘delayed’) and two with rapid monocular responses. D, mean response (normalised change in firing) of ‘delayed’ cells to 5 s light steps applied to one or both eyes at a range of intensities (12.4–15.4 log effective photons cm–2 s–1). E, mean response of ‘delayed’ cells during the 5 s light step as a function of stimulus intensity. Data fit with four-parameter sigmoid equations. F, mean normalised firing activity of ‘delayed’ cells under light adapted conditions (30 s epochs at 13.4–15.4 log effective photons cm–2 s–1). G, quantification of data in F, showing mean normalised firing activity as a function of step magnitude (left; 0–5 s after light step) or step irradiance (right; 25–30 s after light step).
We next isolated the activities of individual neurones contributing to these multi-unit recordings (Fig.7C and D). From a total of 67 neurones isolated we identified 16 that were visually responsive. The majority of these (n = 13) were located within or very close to the LHb, where they constituted a sizeable proportion of the total number of recorded cells (∼40%). Consistent with the multi-unit responses discussed above, all but two visually responsive cells exhibited characteristically sluggish, but sustained visual responses. Moreover, further analysis of responses to light steps spanning a range of light intensities (9.4–15.4 log photons cm–2 s–1), and targeting one or both eyes, revealed several additional characteristic properties (Fig.7D and E). First, visually evoked activity exhibited surprisingly low sensitivity (threshold >12.4 log photons cm–2 s–1). Second, responses could be evoked by stimulating either one eye alone and were additive, such that binocular stimulation resulted in particularly large changes in firing. Again, the exceptions to this rule were two cells isolated from electrode sites lateral to the LHb (Fig.7C). These exhibited rapid, purely contralateral-driven visual responses that were two orders of magnitude more sensitive than those of the cells discussed above (data not shown).
Given the characteristic visual response properties we observe in LHb neurones, one obvious interpretation is that such cells receive information about global levels of ambient illumination. To test this further we next investigated responses to small (1–2 log units) but maintained (30 s) changes in binocular illumination. Surprisingly, we found only a relatively weak relationship between LHb neuronal firing and absolute irradiance (Fig.7F and G). Instead it appeared that, despite their relatively sustained visual responses, these cells were primarily driven by visual contrast such that response magnitude following a step of fixed irradiance was heavily dependent on previous light exposure.
Discussion
These results provide new insight into the intrinsic properties of mouse LHb neurones, reveal how extrinsic factors regulate their activity and extend our understanding of biological timekeeping in the epithalamus. In addition to the basic electrophysiological states previously observed in rat LHb neurones (firing, burst firing and silent-hyperpolarised; Chang & Kim, 2004; Weiss & Veh, 2011), we describe two other possible states that have not been reported before: depolarised-silent and bistable. We further show that mouse LHb neurones exhibit a significant daily variation in AP firing similar to that reported for extracellularly recorded firing rates of rat LHb neurones in vitro (Zhao & Rusak, 2005). Surprisingly, however, our whole-cell recordings indicate that this rhythm in firing is not associated with any appreciable rhythm in Rinput or RMP. The daily variation in AP firing appears to depend on a functional molecular clock since it is absent in LHb recordings from Cry1−/−Cry2−/− mice. Indeed, the low amplitude rhythms in the Per1-luc reporter seen in LHb slices from animals with an intact molecular clock are undetectable in the LHb of Cry1−/−Cry2−/− mice. We also show how PK2, a putative output signal of the SCN circadian pacemaker, suppresses LHb neuronal activity via enhancing the release of GABA. Finally, we demonstrate that some LHb neurones are sensitive to changes in binocular illumination consistent with those that occur around the day–night transition.
Our finding that the majority of mouse LHb neurones rest in a state at which they are spontaneously firing APs is in agreement with similar whole-cell patch recordings made in rat LHb brain slices (∼54–62% of cells sampled; Kim & Chang, 2005; Weiss & Veh, 2011). In both mouse and rat, LHb neurones discharge APs over a similar range, ∼0.2–12 spikes s–1, indicating that many of their properties are conserved. The rate of AP discharge noted here for mouse LHb neurones is also in broad agreement with values reported in another study of murine LHb neuronal activity (Li et al. 2013). Similar to the rat LHb (Kim & Chang, 2005; Weiss & Veh, 2011), neurones that were hyperpolarised and silent (RMP ∼–58 mV) were also detected in this study. Through injection of positive current, these neurones could be driven to fire APs, while release from transient hyperpolarisation (to RMP of ∼−65 to −75 mV) resulted in burst firing. This demonstrates that such states are a general property of LHb neurones and do not appear to represent distinct types of LHb neurones. Indeed, blockade of AP-dependent intercellular communication did not alter the RMP of cells in the firing or hyperpolarised-silent states, indicating that they were intrinsically generated. Our observation that sustained injection of current that alters RMP could recapitulate these states further substantiates their intrinsic nature (Fig.2D).
In this study, we found two unusual depolarised resting states of LHb neurones, depolarised-silent and bistable. Neurones in these infrequently encountered states rested at comparatively depolarised RMP, but through injection of negative current they showed AP firing and burst firing, demonstrating that these neurones have properties similar to many other LHb neurones (see below). Such depolarised states have been observed in recordings of neurones in other brain areas including the MHb (Sakhi et al. 2014), the SCN (Belle et al. 2009) and the cerebellum (Raman et al. 2000). Intriguingly, all of these structures exhibit circadian variation in molecular activities, raising the possibility that neurones in spontaneously depolarised states are a feature of neuronal circadian clocks in the brain.
We also observed a common property of mouse LHb neurones. In response to release of injection of negative current of the RMP to ∼−65 to −70 mV, independently of their initial resting state, the majority of LHb neurones (>85%) showed AP burst firing, characterised by the firing of 3–4 APs per burst. These bursts typically occurred for 1–4 s, while recurrent burst firing could last for several seconds and very occasionally for a few minutes. Some cells transitioned from these bursts into more conventional spontaneous AP firing behaviour as well as to their initial resting state. A similar phenomenon has been noted with rat LHb neurones (Kim & Chang, 2005; Weiss & Veh, 2011). Indeed in this investigation as well as the rat LHb studies, a very small proportion (∼2–3%) of LHb neurones show spontaneous burst firing, a state which in the rat LHb requires T-type calcium channel activity (Kim & Chang, 2005). Such responses appear physiological since recovery from PK2-evoked hyperpolarisation of RMP and suppression of AP firing can lead to burst AP firing.
It is notable that the daily temporal profile in spontaneous AP firing rate of LHb neurones, lowest at late night/early day and highest in the late day/early night, is sustained in LHb brain slices prepared from mice that have been in constant dark for 2–3 days. This suggests that LHb neuronal firing is under circadian control rather than simply driven by the exogenous light–dark cycle. Indeed, in LHb brain slices prepared from animals in constant dark that lack a functional intracellular molecular circadian clock, the Cry1−/−Cry2−/− mice, this profile was absent. This is similar to the adjacent MHb, where the daily change in spontaneous AP firing, increasing from low rates in the early day to peak firing in the late day, is absent in the Cry1−/−Cry2−/− MHb. Interestingly, while Cry1−/−Cry2−/− MHb neurones show high AP firing in both the projected morning and late day, Cry1−/−Cry2−/− LHb neurones spontaneously discharge at low frequencies at these phases. Therefore, while loss of the molecular circadian clock alters the circadian profile of neuronal activity in both MHb and LHb, it differentially affects the circadian profile of spontaneous AP firing rate in these two nuclei of the Hb. This suggests that circadian signals act to suppress spontaneous MHb neuronal activity in the early day and to activate LHb neurones at this phase.
At present, the source(s) of circadian signals to the LHb remain unclear. The SCN is the main circadian pacemaker in the mammalian brain and expresses circadian rhythms in electrical activity both in vivo and in vitro (Inouye & Kawamura, 1979; Herzog et al. 1998; Belle et al. 2009; van Oosterhout et al. 2012). In mouse SCN brain slices, extracellularly recorded peak AP firing rate (∼3–5 spikes s–1) occurs around the middle of the projected day (∼ZT6–7), with the nadir (∼1–2 spikes s–1) occurring at the middle of the night (∼ZT18–21; Cutler et al. 2003; Brown et al. 2006). Whole-cell patch recordings in mouse SCN brain slices demonstrate an overt day–night rhythm in RMP, with maximally depolarised cells (∼−25–30 mV) occurring through the middle to late day (ZT6–9), and maximally hyperpolarised cells (∼−65–75 mV) found at night (ZT13–18) (Belle et al. 2009; Scott et al. 2010). Compared with the SCN, the rhythm we recorded here in the mouse LHb shows peak firing some 3–4 h later and over a broader temporal range (∼ZT8–16). Thus, while both SCN and LHb neurones show firing rate rhythms, the circadian control in the SCN is more precise and more overtly influences basic neuronal membrane properties than do circadian signals in the LHb.
The extended neural circadian system encompasses the LHb and a recent study demonstrates that lesioning the habenula or the main output pathway from the LHb alters the distribution of locomotor activity (Paul et al. 2011). Since the SCN is intact in the animals used in that study, this suggests that the habenula/LHb output is important for regulating the normal night-time activity of laboratory rodents.
Evidence suggests that the LHb is innervated by PK2 neurones of the SCN (Zhang et al. 2009) and that PK2R mRNA is expressed in the LHb (Cheng et al. 2002). Our finding that PK2 alters the electrical activity of some LHb neurones is an indication that receptors for PK2 are functionally expressed in the LHb. Unlike in the subfornical area (Cottrell et al. 2004) or SCN (Ren et al. 2011) in which PK2 acts post-synaptically to elevate AP firing, we find that PK2 acts mainly to enhance the frequency of GABA release, indicating an excitatory presynaptic action. There are very few investigations of the electrophysiological actions of PK2 in the CNS and our findings demonstrate that there are other modes of influence of this neuropeptide on neuronal activity beyond excitatory postsynaptic actions.
Release of PK2 from SCN efferents is one possible route via which the SCN master circadian pacemaker could convey circadian signals. However, our LHb brain slices do not contain the SCN, establishing that there is local circadian control of neuronal activity in the epithalamus. Indeed, monitoring of long-term brain slice cultures in which the activity of the molecular circadian clock is reported by bioluminescence shows that both ependymal cells lining the dorsal third ventricle adjacent to the MHb as well as some cells in the LHbM express intrinsic circadian timekeeping (Guilding et al. 2010). Assessment of clock gene expression by in situ hybridisation demonstrates that components of the molecular clock are present in the MHb (Shieh, 2003), but it is unclear whether the LHb also expresses core clock genes in vivo. These observations support the idea that the epithalamus has intrinsic circadian timekeeping properties. Since LHb activity is also modulated by changes in ambient illumination (this study; Zhao & Rusak, 2005), it is likely that this information is integrated with SCN circadian signals to shape neuronal activity in the LHb and possibly the MHb as well. Further work is required to determine if and how intrinsic and extrinsic circadian signals are processed and integrated with light input information to sculpt LHb activity.
By convention, the mammalian LHb is schematised as divided into the LHbL and LHbM (Herkenham & Nauta, 1977; Sutherland, 1982). More recent studies, however, suggest that rodent LHb contains 10 morphologically distinct subnuclei (Andres et al. 1999; Geisler et al. 2003; Geisler & Trimble, 2008; Aizawa et al. 2012), and in support of this, subnucleus-related afferent and efferent connectivity has been described (Gruber et al. 2007; Kowski et al. 2008; Brinschwitz et al. 2010; Sego et al. 2014). However, electrophysiological investigations have not detected an obvious association between the biolectric characteristics of rat LHb neurones and/or modes of electrical responsiveness with a particular subnucleus or neuronal morphology (Kim & Chang, 2005; Weiss & Veh, 2011). Although we did not attempt to discriminate subnuclei in the LHb, we noted the approximate location of each recorded cell. We found that the resting states described and their responses to hyperpolarising injections of current were similar throughout the LHb and did not overtly segregate according to the LHbL or LHbM. Indeed, our observations that the different resting states could be recapitulated through sustained postive and negative current injections demonstrate that these resting behaviours represent a continuum of possible LHb neuronal resting states rather than particular types of LHb neurones.
Our observation that changes in retinal illumination drive most robust increases in AP firing around the lateral margins of the LHb (an area described as the parahabenula; Morin & Studholme, 2014) suggest that cells in this region may have greater access to visual information. However, it is unlikely that the visual responses we describe here within the LHb are directly driven by retinal input. Indeed, these responses exhibit surprisingly low sensitivity (∼two orders of magnitude less than even the SCN) and are remarkably sluggish [∼1 order of magnitude slower than the SCN (Brown et al. 2011b)]. Moreover, such visually responsive cells are much more widely distributed than one would expect based on the anatomical arrangement of mRGC inputs (this study; Hattar et al. 2006). Finally, a previous neuroanatomical investigation reports that retinal input to the Hb region in the mouse is almost entirely derived from the contralateral retina (Hattar et al. 2006), whereas we find that mouse LHb cells are binocularly driven. On this basis it seems that visual responses in the LHb are indirect in origin, most likely via inputs from retinorecipient cells in the SCN and/or lateral geniculate (Moore et al. 2000; Zhang et al. 2009). In this regard it is noteworthy that we have previously observed similarly sluggish/low sensitivity responses in the nucleus reuniens, another brain region that is devoid of direct retinal input and targeted by the SCN and intergeniculate leaflet (Brown et al. 2011b). These findings extend those of Zhao & Rusak (2005) who found rat LHb to be responsive to retinal illumination, but did not characterise the sensitivity or temporal profile of those responses in detail.
The roles and functions of circadian rhythmicity in the LHb remain to be determined. Hyperactivity in the LHb is strongly implicated in human depression (McCarthy & Welsh, 2012; Aizawa et al. 2013) and animal models of depression (Li et al. 2013). Indeed, a recent case study points to inhibition of LHb activity through deep brain stimulation as a potential therapeutic intervention in the alleviation of symptoms in seemingly intractable depression (Sartorius et al. 2010). Depression and mania are also associated with altered circadian rhythmicity, raising the possibility that daily variation in LHb activity could be altered in such disorders. Most LHb neurones are glutamatergic (Brinschwitz et al. 2010) and because the majority of LHb neurones are spontaneously generating and firing APs (Zhao & Rusak, 2005; Weiss & Veh, 2011), they can convey excitatory information to the targets of LHb efferents. These targets include the ventral tegmental area (VTA) and the rostromedial tegmentum (RMTg) (Jhou et al. 2009). The VTA and RMTg play key roles in reward and addiction processes (Barrot et al. 2012) and there are well-characterised time-of-day influences on brain dopamine levels (Earley et al. 2013) as well as dopamine-mediated processes (Webb et al. 2009; Albrecht, 2013). Circadian signals conveyed from the LHb to the VTA/RMTg could conceivably influence these daily variations. Another target of LHb neurones are the raphe nuclei (Bernard & Veh, 2012; Sego et al. 2014) providing a route through which the LHb could contribute to temporal patterning of daily variation in sleep–wake states (Jalewa et al. 2014). In addition, the coupling of LHb and hippocampal neuronal activity influences cognition (Aizawa et al. 2013; Goutagny et al. 2013) and disruption of circadian rhythms alters performance on some learning and memory tasks (Ruby et al. 2013). Further studies are necessary to determine if and how circadian signals from the LHb influence neuronal activity and function in the VTA/RMTg, raphe nuclei and other structures.
Our determination that both the MHb (Sakhi et al. 2014) and the LHb (this study) manifest circadian variation in their neuronal activity adds to the growing knowledge and insight into the regulation of epithalamic neuronal activity, as well as circadian oscillators in extra-SCN brain sites (Abe et al. 2002; Guilding & Piggins, 2007; Guilding et al. 2009; Mendoza & Challet, 2009). Such investigations highlight the richness of intrinsic and extrinsic influences on brain activity (Granados-Fuentes et al. 2004), and suggest new ways that circadian signals can modulate neuronal activity and behaviour.
Acknowledgments
We thank Clare Guilding, Rayna Samuels and Fiona Scott for technical assistance.
Glossary
- aCSF
artificial cerebrospinal fluid
- AHP
after-hyperpolarisation
- AP
action potential
- AP50
action potential mid-spike amplitude
- APD50
action potential mid-spike duration
- Cry/CRY
cryptochrome gene/protein
- CT
circadian time
- EGFP
enhanced destabilised green fluorescent protein
- LD
light–dark cycle
- Luc
luciferase
- LHb
lateral habenula
- LHbL
lateral part of the lateral habenula
- LHbM
medial part of the lateral habenula
- MEA
multi-electrode array
- MHb
medial habenula
- mRGCs
melanopsin-containing retinal ganglion cells
- Opn4tau-lacZ
opsin 4 (melanopsin)-tau-lacz transgene
- Per/PER
period genes/proteins
- Per1::GFP
mPer1::d2EGFP transgene
- Per1-luc
Perl-luciferase transgene
- PER2::LUC
mPER2Luc fusion protein
- PK2
prokineticin 2
- PK2R
prokineticin 2 receptor
- Rinput
input resistance
- RMP
resting membrane potential
- RMTg
rostromedial tegmentum
- SCN
suprachiasmatic nucleus
- SFR
spontaneous firing rate
- VTA
ventral tegmental area
- ZT
Zeitgeber time
Additional Information
Competing interests
None declared.
Author contributions
K.S., M.D.C.B., P.D., T.M.B. and H.D.P. designed the research; K.S., M.D.C.B. and S.W. performed the in vitro electrophysiological studies. T.M.B. and M.H. made and analysed the in vivo electrophysiological recordings. K.S., S.W. and M.D.C.B. analysed the in vitro electrophysiological recordings using Spike 2 scripts written by M.D.C.B. The manuscript was written by K.S., S.W., M.D.C.B., T.M.B. and H.D.P. and the research was conducted at the University of Manchester.
Funding
This research was supported by a grant from the Wellcome Trust to H.D.P., a David Phillips Fellowship award from the Biotechnology and Biological Sciences Research Council (UK) to T.M.B., by research funds from the Institut de Recherches Servier (IdRS, France), by a University of Manchester studentship to K.S., and by a studentship to S.W. from the Neurosciences Research Institute, University of Manchester.
Key points
Light input from the retina acts on clock neurones in the suprachiasmatic nuclei (SCN) and the intrinsic daily electrical output of these cell autonomous clocks coordinates circadian rhythms in the brain and body.
Cells in the lateral habenula express clock genes and anatomical studies indicate that SCN output and retinal pathways terminate in this structure.
Using a brain slice preparation isolating the lateral habenula from retinal and SCN inputs, we found mouse lateral habenula neurones exhibit a daily variation in their electrical properties that is dependent on a functional molecular clock.
Prokineticin 2, a putative output signal of the SCN, changed lateral habenula neuronal activity through enhancing inhibitory signalling. In response to retinal illumination in vivo, lateral habenula neurones sluggishly altered their electrical activity.
These studies indicate that mouse lateral habenula neurones possess intrinsic timekeeping capabilities and show for the first time that they are responsive to extrinsic SCN and retinal signals.
References
- Abe M, Herzog ED, Yamazaki S, Straume M, Tei H, Sakaki Y, Menaker M. Block GD. Circadian rhythms in isolated brain regions. J Neurosci. 2002;22:350–356. doi: 10.1523/JNEUROSCI.22-01-00350.2002. [DOI] [PMC free article] [PubMed] [Google Scholar]
- Aizawa H, Cui W, Tanaka K. Okamoto H. Hyperactivation of the habenula as a link between depression and sleep disturbance. Front Hum Neurosci. 2013;7:826. doi: 10.3389/fnhum.2013.00826. [DOI] [PMC free article] [PubMed] [Google Scholar]
- Aizawa H, Kobayashi M, Tanaka S, Fukai T. Okamoto H. Molecular characterization of the subnuclei in rat habenula. J Comp Neurol. 2012;520:4051–4066. doi: 10.1002/cne.23167. [DOI] [PubMed] [Google Scholar]
- Albrecht U. Circadian clocks and mood-related behaviors. Hndbk Exp Pharmacol. 2013;217:227–239. doi: 10.1007/978-3-642-25950-0_9. [DOI] [PubMed] [Google Scholar]
- Andres KH, von During M. Veh RW. Subnuclear organization of the rat habenular complexes. J Comp Neurol. 1999;407:130–150. doi: 10.1002/(sici)1096-9861(19990428)407:1<130::aid-cne10>3.0.co;2-8. [DOI] [PubMed] [Google Scholar]
- Barrot M, Sesack SR, Georges F, Pistis M, Hong S. Jhou TC. Braking dopamine systems: a new GABA master structure for mesolimbic and nigrostriatal functions. J Neurosci. 2012;32:14094–14101. doi: 10.1523/JNEUROSCI.3370-12.2012. [DOI] [PMC free article] [PubMed] [Google Scholar]
- Belle MD, Diekman CO, Forger DB. Piggins HD. Daily electrical silencing in the mammalian circadian clock. Science. 2009;326:281–284. doi: 10.1126/science.1169657. [DOI] [PubMed] [Google Scholar]
- Belle MD, Hughes AT, Bechtold DA, Cunningham P, Pierucci M, Burdakov D. Piggins HD. Acute suppressive and long-term phase modulation actions of orexin on the mammalian circadian clock. J Neurosci. 2014;34:3607–3621. doi: 10.1523/JNEUROSCI.3388-13.2014. [DOI] [PMC free article] [PubMed] [Google Scholar]
- Bernard R. Veh RW. Individual neurons in the rat lateral habenular complex project mostly to the dopaminergic ventral tegmental area or to the serotonergic raphe nuclei. J Comp Neurol. 2012;520:2545–2558. doi: 10.1002/cne.23080. [DOI] [PubMed] [Google Scholar]
- Bianco IH. Wilson SW. The habenular nuclei: a conserved asymmetric relay station in the vertebrate brain. Phil Trans R Soc Lond B Biol Sci. 2009;364:1005–1020. doi: 10.1098/rstb.2008.0213. [DOI] [PMC free article] [PubMed] [Google Scholar]
- Brinschwitz K, Dittgen A, Madai VI, Lommel R, Geisler S. Veh RW. Glutamatergic axons from the lateral habenula mainly terminate on GABAergic neurons of the ventral midbrain. Neuroscience. 2010;168:463–476. doi: 10.1016/j.neuroscience.2010.03.050. [DOI] [PubMed] [Google Scholar]
- Brown TM, Allen AE, Wynne J, Paul DL, Piggins HD. Lucas RJ. Visual responses in the lateral geniculate evoked by Cx36-independent rod pathways. Vision Res. 2011b;51:280–287. doi: 10.1016/j.visres.2010.08.010. [DOI] [PMC free article] [PubMed] [Google Scholar]
- Brown TM, Banks JR. Piggins HD. A novel suction electrode recording technique for monitoring circadian rhythms in single and multiunit discharge from brain slices. J Neurosci Methods. 2006;156:173–181. doi: 10.1016/j.jneumeth.2006.02.024. [DOI] [PubMed] [Google Scholar]
- Brown TM. Piggins HD. Electrophysiology of the suprachiasmatic circadian clock. Prog Neurobiol. 2007;82:229–255. doi: 10.1016/j.pneurobio.2007.05.002. [DOI] [PubMed] [Google Scholar]
- Brown TM, Wynne J, Piggins HD. Lucas RJ. Multiple hypothalamic cell populations encoding distinct visual information. J Physiol. 2011b;589:1173–1194. doi: 10.1113/jphysiol.2010.199877. [DOI] [PMC free article] [PubMed] [Google Scholar]
- Chang SY. Kim U. Ionic mechanism of long-lasting discharges of action potentials triggered by membrane hyperpolarization in the medial lateral habenula. J Neurosci. 2004;24:2172–2181. doi: 10.1523/JNEUROSCI.4891-03.2004. [DOI] [PMC free article] [PubMed] [Google Scholar]
- Cheng MY, Bullock CM, Li C, Lee AG, Bermak JC, Belluzzi J, Weaver DR, Leslie FM. Zhou QY. Prokineticin 2 transmits the behavioural circadian rhythm of the suprachiasmatic nucleus. Nature. 2002;417:405–410. doi: 10.1038/417405a. [DOI] [PubMed] [Google Scholar]
- Cottrell GT, Zhou QY. Ferguson AV. Prokineticin 2 modulates the excitability of subfornical organ neurons. J Neurosci. 2004;24:2375–2379. doi: 10.1523/JNEUROSCI.5187-03.2004. [DOI] [PMC free article] [PubMed] [Google Scholar]
- Cutler DJ, Haraura M, Reed HE, Shen S, Sheward WJ, Morrison CF, Marston HM, Harmar AJ. Piggins HD. The mouse VPAC2 receptor confers suprachiasmatic nuclei cellular rhythmicity and responsiveness to vasoactive intestinal polypeptide in vitro. Eur J Neurosci. 2003;17:197–204. doi: 10.1046/j.1460-9568.2003.02425.x. [DOI] [PubMed] [Google Scholar]
- Dibner C, Schibler U. Albrecht U. The mammalian circadian timing system: organization and coordination of central and peripheral clocks. Ann Rev Physiol. 2010;72:517–549. doi: 10.1146/annurev-physiol-021909-135821. [DOI] [PubMed] [Google Scholar]
- Diekman CO, Belle MD, Irwin RP, Allen CN, Piggins HD. Forger DB. Causes and consequences of hyperexcitation in central clock neurons. PLoS Comput Biol. 2013;9:e1003196. doi: 10.1371/journal.pcbi.1003196. [DOI] [PMC free article] [PubMed] [Google Scholar]
- Earley CJ, Kuwabara H, Wong DF, Gamaldo C, Salas RE, Brasic JR, Ravert HT, Dannals RF. Allen RP. Increased synaptic dopamine in the putamen in restless legs syndrome. Sleep. 2013;36:51–57. doi: 10.5665/sleep.2300. [DOI] [PMC free article] [PubMed] [Google Scholar]
- Enezi J, Revell V, Brown T, Wynne J, Schlangen L. Lucas R. A ‘melanopic’ spectral efficiency function predicts the sensitivity of melanopsin photoreceptors to polychromatic lights. J Biol Rhythms. 2011;26:314–323. doi: 10.1177/0748730411409719. [DOI] [PubMed] [Google Scholar]
- Geisler S, Andres KH. Veh RW. Morphologic and cytochemical criteria for the identification and delineation of individual subnuclei within the lateral habenular complex of the rat. J Comp Neurol. 2003;458:78–97. doi: 10.1002/cne.10566. [DOI] [PubMed] [Google Scholar]
- Geisler S. Trimble M. The lateral habenula: no longer neglected. CNS Spectr. 2008;13:484–489. doi: 10.1017/s1092852900016710. [DOI] [PubMed] [Google Scholar]
- Goutagny R, Loureiro M, Jackson J, Chaumont J, Williams S, Isope P, Kelche C, Cassel JC. Lecourtier L. Interactions between the lateral habenula and the hippocampus: implication for spatial memory processes. Neuropsychopharmacology. 2013;38:2418–2426. doi: 10.1038/npp.2013.142. [DOI] [PMC free article] [PubMed] [Google Scholar]
- Granados-Fuentes D, Saxena MT, Prolo LM, Aton SJ. Herzog ED. Olfactory bulb neurons express functional, entrainable circadian rhythms. Eur J Neurosci. 2004;19:898–906. doi: 10.1111/j.0953-816x.2004.03117.x. [DOI] [PMC free article] [PubMed] [Google Scholar]
- Gruber C, Kahl A, Lebenheim L, Kowski A, Dittgen A. Veh RW. Dopaminergic projections from the VTA substantially contribute to the mesohabenular pathway in the rat. Neurosci Lett. 2007;427:165–170. doi: 10.1016/j.neulet.2007.09.016. [DOI] [PubMed] [Google Scholar]
- Guilding C, Hughes AT, Brown TM, Namvar S. Piggins HD. A riot of rhythms: neuronal and glial circadian oscillators in the mediobasal hypothalamus. Mol Brain. 2009;2:28. doi: 10.1186/1756-6606-2-28. [DOI] [PMC free article] [PubMed] [Google Scholar]
- Guilding C, Hughes AT. Piggins HD. Circadian oscillators in the epithalamus. Neuroscience. 2010;169:1630–1639. doi: 10.1016/j.neuroscience.2010.06.015. [DOI] [PMC free article] [PubMed] [Google Scholar]
- Guilding C. Piggins HD. Challenging the omnipotence of the suprachiasmatic timekeeper: are circadian oscillators present throughout the mammalian brain? Eur J Neurosci. 2007;25:3195–3216. doi: 10.1111/j.1460-9568.2007.05581.x. [DOI] [PubMed] [Google Scholar]
- Hattar S, Kumar M, Park A, Tong P, Tung J, Yau KW. Berson DM. Central projections of melanopsin-expressing retinal ganglion cells in the mouse. J Comp Neurol. 2006;497:326–349. doi: 10.1002/cne.20970. [DOI] [PMC free article] [PubMed] [Google Scholar]
- Herkenham M. Nauta WJ. Afferent connections of the habenular nuclei in the rat. A horseradish peroxidase study, with a note on the fibre-of-passage problem. J Comp Neurol. 1977;173:123–146. doi: 10.1002/cne.901730107. [DOI] [PubMed] [Google Scholar]
- Herzog ED, Takahashi JS. Block GD. Clock controls circadian period in isolated suprachiasmatic nucleus neurons. Nat Neurosci. 1998;1:708–713. doi: 10.1038/3708. [DOI] [PubMed] [Google Scholar]
- Hikosaka O. The habenula: from stress evasion to value-based decision-making. Nat Rev Neurosci. 2010;11:503–513. doi: 10.1038/nrn2866. [DOI] [PMC free article] [PubMed] [Google Scholar]
- Inouye ST. Kawamura H. Persistence of circadian rhythmicity in a mammalian hypothalamic ‘island’ containing the suprachiasmatic nucleus. Proc Natl Acad Sci USA. 1979;76:5962–5966. doi: 10.1073/pnas.76.11.5962. [DOI] [PMC free article] [PubMed] [Google Scholar]
- Jalewa J, Joshi A, McGinnity TM, Prasad G, Wong-Lin K. Holscher C. Neural circuit interactions between the dorsal raphe nucleus and the lateral hypothalamus: an experimental and computational study. PloS ONE. 2014;9:e88003. doi: 10.1371/journal.pone.0088003. [DOI] [PMC free article] [PubMed] [Google Scholar]
- Jesuthasan S. Fear, anxiety, and control in the zebrafish. Dev Neurobiol. 2012;72:395–403. doi: 10.1002/dneu.20873. [DOI] [PubMed] [Google Scholar]
- Jhou TC, Geisler S, Marinelli M, Degarmo BA. Zahm DS. The mesopontine rostromedial tegmental nucleus: a structure targeted by the lateral habenula that projects to the ventral tegmental area of Tsai and substantia nigra compacta. J Comp Neurol. 2009;513:566–596. doi: 10.1002/cne.21891. [DOI] [PMC free article] [PubMed] [Google Scholar]
- Kim U. Chang SY. Dendritic morphology, local circuitry, and intrinsic electrophysiology of neurons in the rat medial and lateral habenular nuclei of the epithalamus. J Comp Neurol. 2005;483:236–250. doi: 10.1002/cne.20410. [DOI] [PubMed] [Google Scholar]
- Kowski AB, Geisler S, Krauss M. Veh RW. Differential projections from subfields in the lateral preoptic area to the lateral habenular complex of the rat. J Comp Neurol. 2008;507:1465–1478. doi: 10.1002/cne.21610. [DOI] [PubMed] [Google Scholar]
- Kowski AB, Veh RW. Weiss T. Dopaminergic activation excites rat lateral habenular neurons in vivo. Neuroscience. 2009;161:1154–1165. doi: 10.1016/j.neuroscience.2009.04.026. [DOI] [PubMed] [Google Scholar]
- Kuhlman SJ. McMahon DG. Rhythmic regulation of membrane potential and potassium current persists in SCN neurons in the absence of environmental input. Eur J Neurosci. 2004;20:1113–1117. doi: 10.1111/j.1460-9568.2004.03555.x. [DOI] [PubMed] [Google Scholar]
- Kuhlman SJ, Quintero JE. McMahon DG. GFP fluorescence reports Period 1 circadian gene regulation in the mammalian biological clock. Neuroreport. 2000;11:1479–1482. [PubMed] [Google Scholar]
- Lammel S, Lim BK, Ran C, Huang KW, Betley MJ, Tye KM, Deisseroth K. Malenka RC. Input-specific control of reward and aversion in the ventral tegmental area. Nature. 2012;491:212–217. doi: 10.1038/nature11527. [DOI] [PMC free article] [PubMed] [Google Scholar]
- Leslie FM, Mojica CY. Reynaga DD. Nicotinic receptors in addiction pathways. Mol Pharmacol. 2013;83:753–758. doi: 10.1124/mol.112.083659. [DOI] [PubMed] [Google Scholar]
- Li K, Zhou T, Liao L, Yang Z, Wong C, Henn F, Malinow R, Yates JR., 3rd Hu H. βCaMKII in lateral habenula mediates core symptoms of depression. Science. 2013;341:1016–1020. doi: 10.1126/science.1240729. [DOI] [PMC free article] [PubMed] [Google Scholar]
- Lucas RJ, Peirson SN, Berson DM, Brown TM, Cooper HM, Czeisler CA, Figueiro MG, Gamlin PD, Lockley SW, O'Hagan JB, Price LL, Provencio I, Skene DJ. Brainard GC. Measuring and using light in the melanopsin age. Trends Neurosci. 2014;37:1–9. doi: 10.1016/j.tins.2013.10.004. [DOI] [PMC free article] [PubMed] [Google Scholar]
- McCarthy MJ. Welsh DK. Cellular circadian clocks in mood disorders. J Biol Rhythms. 2012;27:339–352. doi: 10.1177/0748730412456367. [DOI] [PubMed] [Google Scholar]
- Mendoza J. Challet E. Brain clocks: from the suprachiasmatic nuclei to a cerebral network. Neuroscientist. 2009;15:477–488. doi: 10.1177/1073858408327808. [DOI] [PubMed] [Google Scholar]
- Moore RY, Weis R. Moga MM. Efferent projections of the intergeniculate leaflet and the ventral lateral geniculate nucleus in the rat. J Comp Neurol. 2000;420:398–418. doi: 10.1002/(sici)1096-9861(20000508)420:3<398::aid-cne9>3.0.co;2-9. [DOI] [PubMed] [Google Scholar]
- Morin LP. Studholme KM. Retinofugal projections in the mouse. J Comp Neurol. 2014;522:3733–3753. doi: 10.1002/cne.23635. [DOI] [PMC free article] [PubMed] [Google Scholar]
- Paul MJ, Indic P. Schwartz WJ. A role for the habenula in the regulation of locomotor activity cycles. Eur J Neurosci. 2011;34:478–488. doi: 10.1111/j.1460-9568.2011.07762.x. [DOI] [PMC free article] [PubMed] [Google Scholar]
- Paxinos G. Franklin KBJ. 2001. The mouse brain in stereotaxic coordinates. Academic Press, San Diego.
- Raman IM, Gustafson AE. Padgett D. Ionic currents and spontaneous firing in neurons isolated from the cerebellar nuclei. J Neurosci. 2000;20:9004–9016. doi: 10.1523/JNEUROSCI.20-24-09004.2000. [DOI] [PMC free article] [PubMed] [Google Scholar]
- Ren P, Zhang H, Qiu F, Liu YQ, Gu H, O'Dowd DK, Zhou QY. Hu WP. Prokineticin 2 regulates the electrical activity of rat suprachiasmatic nuclei neurons. PloS ONE. 2011;6:e20263. doi: 10.1371/journal.pone.0020263. [DOI] [PMC free article] [PubMed] [Google Scholar]
- Ruby NF, Fernandez F, Garrett A, Klima J, Zhang P, Sapolsky R. Heller HC. Spatial memory and long-term object recognition are impaired by circadian arrhythmia and restored by the GABAA antagonist pentylenetetrazole. PloS ONE. 2013;8:e72433. doi: 10.1371/journal.pone.0072433. [DOI] [PMC free article] [PubMed] [Google Scholar]
- Sakhi K, Belle MD, Gossan N, Delagrange P. Piggins HD. Daily variation in the electrophysiological activity of mouse medial habenula neurones. J Physiol. 2014;592:587–603. doi: 10.1113/jphysiol.2013.263319. [DOI] [PMC free article] [PubMed] [Google Scholar]
- Sartorius A, Kiening KL, Kirsch P, von Gall CC, Haberkorn U, Unterberg AW, Henn FA. Meyer-Lindenberg A. Remission of major depression under deep brain stimulation of the lateral habenula in a therapy-refractory patient. Biol Psychiat. 2010;67:e9–e11. doi: 10.1016/j.biopsych.2009.08.027. [DOI] [PubMed] [Google Scholar]
- Scott FF, Belle MD, Delagrange P. Piggins HD. Electrophysiological effects of melatonin on mouse Per1 and non-Per1 suprachiasmatic nuclei neurones in vitro. J Neuroendocrinol. 2010;22:1148–1156. doi: 10.1111/j.1365-2826.2010.02063.x. [DOI] [PubMed] [Google Scholar]
- Sego C, Goncalves L, Lima L, Furigo IC, Donato J., Jr Metzger M. Lateral habenula and the rostromedial tegmental nucleus innervate neurochemically distinct subdivisions of the dorsal raphe nucleus in the rat. J Comp Neurol. 2014;522:1454–1484. doi: 10.1002/cne.23533. [DOI] [PubMed] [Google Scholar]
- Shieh KR. Distribution of the rhythm-related genes rPERIOD1rPERIOD2, and rCLOCK, in the rat brain. Neuroscience. 2003;118:831–843. doi: 10.1016/s0306-4522(03)00004-6. [DOI] [PubMed] [Google Scholar]
- Sutherland RJ. The dorsal diencephalic conduction system: a review of the anatomy and functions of the habenular complex. Neurosci Biobehav Rev. 1982;6:1–13. doi: 10.1016/0149-7634(82)90003-3. [DOI] [PubMed] [Google Scholar]
- Tavakoli-Nezhad M. Schwartz WJ. Hamsters running on time: is the lateral habenula a part of the clock? Chronobiol Int. 2006;23:217–224. doi: 10.1080/07420520500521947. [DOI] [PubMed] [Google Scholar]
- van der Horst GT, Muijtjens M, Kobayashi K, Takano R, Kanno S, Takao M, de Wit J, Verkerk A, Eker AP, van Leenen D, Buijs R, Bootsma D, Hoeijmakers JH. Yasui A. Mammalian Cry1 and Cry2 are essential for maintenance of circadian rhythms. Nature. 1999;398:627–630. doi: 10.1038/19323. [DOI] [PubMed] [Google Scholar]
- van Oosterhout F, Lucassen EA, Houben T, vanderLeest HT, Antle MC. Meijer JH. Amplitude of the SCN clock enhanced by the behavioral activity rhythm. PloS ONE. 2012;7:e39693. doi: 10.1371/journal.pone.0039693. [DOI] [PMC free article] [PubMed] [Google Scholar]
- Webb IC, Baltazar RM, Wang X, Pitchers KK, Coolen LM. Lehman MN. Diurnal variations in natural and drug reward, mesolimbic tyrosine hydroxylase, and clock gene expression in the male rat. J Biol Rhythms. 2009;24:465–476. doi: 10.1177/0748730409346657. [DOI] [PubMed] [Google Scholar]
- Weiss T. Veh RW. Morphological and electrophysiological characteristics of neurons within identified subnuclei of the lateral habenula in rat brain slices. Neuroscience. 2011;172:74–93. doi: 10.1016/j.neuroscience.2010.10.047. [DOI] [PubMed] [Google Scholar]
- Yamaguchi S, Mitsui S, Miyake S, Yan L, Onishi H, Yagita K, Suzuki M, Shibata S, Kobayashi M. Okamura H. The 5’ upstream region of mPer1 gene contains two promoters and is responsible for circadian oscillation. Curr Biol. 2000;10:873–876. doi: 10.1016/s0960-9822(00)00602-3. [DOI] [PubMed] [Google Scholar]
- Zhang C, Truong KK. Zhou QY. Efferent projections of prokineticin 2 expressing neurons in the mouse suprachiasmatic nucleus. PloS ONE. 2009;4:e7151. doi: 10.1371/journal.pone.0007151. [DOI] [PMC free article] [PubMed] [Google Scholar]
- Zhao H. Rusak B. Circadian firing-rate rhythms and light responses of rat habenular nucleus neurons in vivo and in vitro. Neuroscience. 2005;132:519–528. doi: 10.1016/j.neuroscience.2005.01.012. [DOI] [PubMed] [Google Scholar]