

Abstract
Obesity has been associated with impaired executive functions including working memory. Less explored is the influence of obesity on learning and memory. In the current study we assessed stimulus reward association learning, explicit learning and memory and working memory in healthy weight, overweight and obese individuals. Explicit learning and memory did not differ as a function of group. In contrast, working memory was significantly and similarly impaired in both overweight and obese individuals compared to the healthy weight group. In the first reward association learning task the obese, but not healthy weight or overweight participants consistently formed paradoxical preferences for a pattern associated with a negative outcome (fewer food rewards). To determine if the deficit was specific to food reward a second experiment was conducted using money. Consistent with experiment 1, obese individuals selected the pattern associated with a negative outcome (fewer monetary rewards) more frequently than healthy weight individuals and thus failed to develop a significant preference for the most rewarded patterns as was observed in the healthy weight group. Finally, on a probabilistic learning task, obese compared to healthy weight individuals showed deficits in negative, but not positive outcome learning. Taken together, our results demonstrate deficits in working memory and stimulus reward learning in obesity and suggest that obese individuals are impaired in learning to avoid negative outcomes.
Keywords: obesity, cognitive dysfunction, neuropsychology, explicit memory, working memory, conditioning, negative outcome learning, impulsivity
1. Introduction
The extent to which cognitive functioning is impaired in obesity has been under active investigation for a number of years (e.g., Chelune, Ortega, Linton, & Boustany, 1986; Elias, Elias, Sullivan, Wolf, & D’Agostino, 2003; Gunstad et al., 2007; Liang, Matheson, Kaye, & Boutelle, 2014). Obese individuals tend to show deficits on tasks that are associated with executive function, such as cognitive flexibility, working memory, decision-making, planning and problem solving (van den Berg, Kloppenborg, Kessels, Kappelle, & Jan, 2009; Fitzpatrick, Gilbert, & Serpell, 2013). For instance, obese, compared to healthy weight individuals show deficits on the one-back visual working memory task (Stingl et al., 2012). Interestingly, a diet high in fat and sugar was found to have no effect on two classical frontal lobe tasks (Trail Making Test and the Wisconsin Card Sort Test) after accounting for BMI (Francis and Stevenson, 2011). This suggests that deficits in executive function might be associated with adiposity, rather than diet.
Less clear is whether there are deficits in learning and memory. In the rodent model, obesity and the so-called “Western diet” (high in saturated fat and simple sugars) have consistently been associated with deficits in learning and memory (see Kanoski & Davidson, 2011 for a review). For example, consumption of a Western diet impairs performance on spatial learning and memory tasks (e.g., Farr et al., 2008; Granholm et al., 2008; Jurdak, Lichtenstein, & Kanarek, 2008; Kanoski & Davidson, 2010; Murray et al., 2009; Wu, Molteni, Ying, & Gomez-Pinilla, 2003), operant rule learning (e.g., Greenwood & Winocur, 1990, 2001), as well as feature negative discrimination learning, in which rodents fail to reduce appetitive responding to non-reinforced trials (Kanoski, Meisel, Mullins, & Davidson, 2007; Kanoski, Zhang, Zheng, & Davidson, 2010). There is also evidence that diet induced obesity results in decreased dopaminergic signaling, which is in turn associated with a failure to alter responding for food in the presence of a cue signaling impending shock (Johnson and Kenny, 2010).
To our knowledge the influence of diet and adiposity on conditioning or stimulus reward association learning has not been examined in humans. However, explicit memory has been examined and produced contradictory findings. In a 2009 review Van den Berg and colleagues reported that only two out of five studies examining explicit memory found evidence of impairment in obese relative to healthy weight individuals (van den Berg, Kloppenborg, Kessels, Kappelle, & Jan, 2009). However, the tasks and sample characteristics varied considerably across studies. In one study (Kuo et al., 2006) of men and women between the ages of 65 and 94, BMI had no effect on measures of explicit memory (the Hopkins Verbal Learning Test word lists, the Rey Auditory-Verbal Learning, and the Rivermead Behavioral Memory Test paragraph recall task). In contrast, obese men between the ages of 32–62 displayed deficits in both immediate and delayed recall on a logical memory task (Elias et al., 2003). In another study in which age was entered as a covariate, a negative correlation was observed between BMI and both immediate and delayed recall of a list of words at a 5-year follow-up (Cournot et al., 2006). More recently, Francis and Stevenson (2011) reported clear deficits in explicit learning and memory as a function of a diet high in fat and sugar in a population of young adults. Notably, the effect of diet was not influenced by BMI. Stanek et al. (2013) also failed to observe an effect of BMI on performance of verbal list learning (Stanek et al., 2013). However, deficits have been reported in immediate recall of stories (logical memory; Benito-León, Mitchell, Hernández-Gallego, & Bermejo-Pareja, 2013). Miller and colleagues reported explicit memory deficits in one quarter of study participants pre-bariatric surgery, with significant improvement on these measures post-surgery (Miller et al., 2013), but this could be related to either decreased adiposity or fat intake. The effects of BMI on explicit learning and memory thus remain uncertain.
This uncertainty represents an important gap in the literature, not only because it is important to establish the association between obesity and memory, but also because memory plays an important role in food intake, and memory deficits are thought to contribute to overeating (Higgs, 2005, 2008). For example, asking healthy weight individuals to recall items eaten at lunch decreases their food intake later on (Higgs, 2002). This is a robust phenomenon and raises the possibility that reduced memory for food eaten might result in increased intake later in the day (Francis & Stevenson, 2011; Higgs, Williamson, & Attwood, 2008).
The purpose of the current investigation was therefore to examine the effect of adiposity on stimulus reward association learning and explicit learning and memory. Working memory was also assessed in the context of one of the stimulus reward association learning experiments. All tasks employed nonverbal stimuli to facilitate comparisons.
Experiment 1
2. Method
2.1. Participants
Sixty participants were enrolled in this experiment. Participants were members of the New Haven and/or Yale communities. Access to the population was gained by advertising through fliers posted throughout the Yale-New Haven area and by word-of-mouth. All participants were screened over the phone to ensure they met inclusion and exclusion criteria. All participants completed version 1, 2 or 3 (updated versions) of our standard screening form. In version 1 of the form we ask a number of questions related to demographic information (e.g., race, ethnicity, height, weight…), safety questions related to MRI (e.g., implanted devices, brain or cardiac surgery, dental work, metal in body or working with metal), and health questions: ADHD, corrective lenses, visual impairments such as cataracts glaucoma and macular degeneration, head injury, unstable or serious illness, heart attack, stroke, psychiatric disorder, depression, medical hospitalization within the three years, history of drug or alcohol abuse, food allergies, current or recent diet, history of taste and smell impairments, smoker (duration and amount), ear infections in childhood, start date of menstrual cycle, pregnancy. In versions 2 and 3 of our screening form, the questions were similar but slightly more detailed. For instance, participants were also asked to indicate if they have had hypertension, abnormal EKG, Diabetes, HIV/AIDS, kidney failure, chronic pain, seizures, arrhythmia, thyroid problems, hepatits, liver cirrhosis, abnormal EEG, any heart related conditions, graves diseases, STDs and form of cancer. They are then asked if they have any other past or current medical conditions we have not covered. If the response is yes to any of the above questions the participant is excluded. We additionally ask for the full list of medications people take. Smokers, dieters and heavy drinkers/alcoholics are excluded but not participants with a history of drug abuse, as long as they were not currently taking drugs. If there is evidence of a chronic condition the participant is excluded (e.g. insulin or metformin would suggest diabetes).
Inclusion criteria included age less than 41, being an English speaker and being a non-smoker. Besides the ones mentioned above, exclusion criteria also included being pregnant, a psychiatric or medical diagnosis including diabetes, current dieting, head injury with loss of consciousness, daily medication use or food allergies, or awareness of the probabilistic relationship between the pattern and the reward outcome in the Conditioned Cue Preference Test (CCPT). Eleven participants were excluded. Reasons for exclusion included pregnancy (1), awareness of the probabilistic relationship between the pattern and reward CCPT (3), reported disliking of the treats used in the CCPT (3), performance more than 3 standard deviations from the mean on one of the tasks (2), or missing data on the Abstract Design List (ADL) test or the CCPT (2). Thus data analysis was performed on 49 participants. Participants were recruited to achieve similar distributions of age, gender and education across groups. Demographic information is summarized in Table 1.
Table 1.
Demographic Information – Experiment 1.
| Healthy-weight | Overweight | Obese | |
|---|---|---|---|
| Number of participants (number of women) | 16 (9) | 16 (7) | 17 (9) |
| Average Body Mass Index | 22.43 (SD = 1.45) | 27.63 (SD = 1.49) | 36.02 (SD = 6.54) |
| Average age | 24.25 (SD =4.25) | 24.94 (SD =4.55) | 25.17 (SD = 4.39) |
| Average years of education | 15.25 (SD =1.88) | 14.8 (SD = 2.14) | 15.58 (SD = 2.29) |
| ADL – design recall during trial 1 | 5.75 (SD = 2.35) | 6.00 (SD = 2.53) | 6.59 (SD = 1.62) |
| ADL – design recall during trial 2 | 9.88 (SD = 1.89) | 9.56 (SD = 2.39) | 9.88 (SD = 1.50) |
| ADL – design recall during trial 3 | 11.19 (SD = 1.22) | 10.94 (SD = 1.88) | 11.47 (SD = 1.59) |
| ADL – design recall during trial 4 | 12.63 (SD = 0.72) | 11.81 (SD = 1.47) | 12.18 (SD = 1.13) |
| ADL – design recall during delayed trial | 12.69 (SD = 0.60) | 12.06 (SD = 1.69) | 12.06 (SD = 1.34) |
| ADL – design recognition | 11.69 (SD = 1.25) | 11.33 (SD = 1.63) | 11.41 (SD = 1.06) |
| ADL – slopes of design recall | 3.01 (SD = 2.70) | 1.88 (SD = 0.70) | 1.84 (SD = 0.60) |
| Working memory performance – overall number of errors | 4.13 (SD = 3.00) | 11.81 (SD = 13.61) | 9.18 (SD = 8.22) |
| Working memory performance – under-estimation errors | 2.73 (SD = 2.52) | 4.88 (SD = 5.35) | 4.71 (SD = 4.13) |
| Working memory performance – overestimation errors | 1.40 (SD = 1.40) | 6.94 (SD = 10.60) | 4.47 (SD = 5.61) |
| CCPT – preference score for the positive pattern | 5.44 (SD = 2.53) | 5.25 (SD = 2.54) | 3.76 (SD = 3.13) |
| CCPT – preference score for the bivalent pattern | 5.56 (SD = 3.27) | 6.69 (SD = 2.55) | 4.18 (SD = 3.41) |
| CCPT – preference score for the negative pattern | 5.81 (SD = 2.81) | 4.06 (SD = 2.59) | 6.35 (SD = 2.80) |
2.2. Procedure
Participants were asked not to eat for at least two hours prior to the study. Upon arrival the procedures were explained and consent obtained. Next the neuropsychological tests were performed in the order presented below.
2.2.1. Abstract Design List Learning and Immediate Recall (ADL)
The ADL test measures the ability to learn and remember abstract designs (Jones-Gotman, 1986). Participants were told that this is a design-learning test and that they will learn the designs by copying each one on a small piece of paper. The thirteen abstract designs were presented for 10 seconds each on a computer screen for the participant to copy. Once all 13 designs were copied, a piece of paper was provided to draw, in any order, as many designs as could be remembered. This procedure was repeated four times. Following the learning and immediate recall phase the conditioned cue preference test was performed so that at least 60 minutes passed before delayed recall and recognition were assessed.
2.2.2. Conditioned Cue Preference Test (CCPT)
The CCPT (Johnsrude et al., 1999) assesses preference conditioning for initially neutral stimuli. In this task, participants were told that their objective is to locate and remember the number and location of red but not black balls hidden behind boxes. Unbeknownst to participants abstract patterns (not used in the ADL) were revealed at each box selection and were probabilistically associated with finding a red ball. A food reward and pleasant flourish sound was delivered concomitant to uncovering a red ball and an unpleasant buzzer concomitant to uncovering a black ball.
First, participants were asked to choose one of several commercially available bite-sized treats (Raisins, M&Ms, and Willy Wonka’s Nerds candies) to serve as the food reward. Participants were then read the instructions for performing the formation phase of the CCPT (Johnsrude et al., 1999, p.255):
You will see three boxes on the screen. At any time, one of the boxes is hiding a red ball, and the other two are hiding black balls. What you have to do is guess where the red ball is. I would like you to find as many red balls as you can. You can choose a box clicking on it with the mouse. Once you have clicked a box, it will open up and show you which ball was hidden underneath. Every so often, you will be asked how many times you have found the red ball in a particular box. Thus, while you are choosing boxes you have also to try and remember how many times you have found a red ball in each of the three boxes.
The formation phase consisted of six training blocks of 20, 30, 40, 40, 30 and 20 trials (i.e., 180 trials in total). Working memory was assessed during this formation phase by asking the participants to report the number of times red balls were presented and where they occurred at the end of each block. The test was programmed so that each of the three abstract patterns behind the balls was presented an equal number of times in each square and an equal number of times in total. This was done to equate exposure and avoid mere exposure effects (Zajonc, 1968). We also counterbalanced the pattern – reward contingency associations by using three versions of the task so that each pattern was associated with each reward contingency (90%, 50% or 10% predictive of the red ball).
The second phase of the test, called judgment phase, began once all training blocks were completed. This phase aimed at assessing cue preference formation. Participants were shown a pair of abstract patterns on the computer screen, one on the left and one on the right. Participants then chose the pattern that they preferred by clicking on it with the mouse. They received the following instructions (adapted from Johnsrude et al., 1999, p. 257): “You will see two patterns on the screen. I would like you to choose the one you prefer by clicking it. Don’t think too hard, just go with your first impression”. This was repeated 30 times. Each of the three patterns was presented ten times, five times on the left and five times on the right. The patterns presented during this phase of the test consisted of the three abstract patterns used in the first part of the test as well as three novel abstract patterns (see Figure 1). All possible pairs of patterns were presented.
Figure 1.
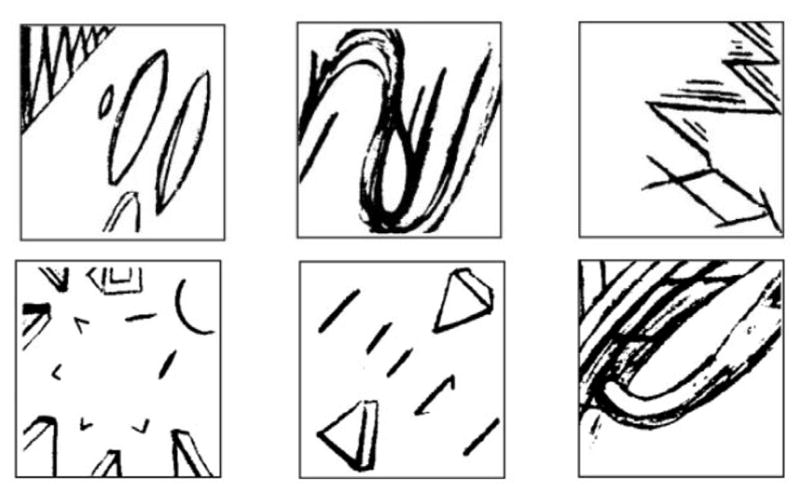
Representation of the three conditioned patterns (top row) and of the three novel patterns (bottom row) employed in the Conditioned Cue Preference Test in Experiment 1. These patterns were taken from Petrides & Milner (1982).
During the third phase of the test, called question phase, participants were shown all six patterns from the judgment phase. These patterns were presented with a number on top of each of them. This number represented the number of times that they were chosen as preferred during the judgment phase. For the three patterns chosen most often, participants were asked why they preferred these patterns. Participants were also asked if they remembered seeing any of the patterns during the initial (formation) phase of the test.
2.2.3. Delayed Recall and Recognition of the ADL
To assess delayed recall, after the completion of the CCPT, participants were asked to draw from memory as many of the ADL designs as they could remember on a blank sheet of paper. Recognition was then queried by displaying one of the ADL designs along with five foils on a computer screen and asking participants to indicate which design had been previously copied. There were thirteen trials, one for each ADL design.
2.2.4. Anthropometric measures
Height and weight were measured using a Detecto 439 Mechanical Scale (footwear and coats removed).
2.2.5. Compensation
Finally, the participant was paid 40 $US as compensation for their time.
3. Results
3.1. Age and level of education
One-way Analyses of Variance (ANOVA) revealed no significant differences in age and education across the three groups {age: [F(2, 46) = 0.20, p =.823]; education: [F(2, 45) = 0.55, p =.579]}.
3.2. ADL
The results of the ADL are presented in Figure 2. A repeated measures ANOVA with the factors experimental group (3: healthy weight individuals, overweight individuals, obese individuals) and trial (4: trial 1, trial 2, trial 3, trial 4) showed a significant main effect of trial [F(3, 138) = 312.89, p < .001, η2 =.87], reflecting greater design recall with increasing number of trials, but no significant interaction between group and trial [F(6, 138) = 1.21, p =.306] and no main effect of group [F(2, 46) = 0.37, p =.690] (Figure 2). Similarly, one-way ANOVAs comparing group performance on delayed recall and recognition revealed no significant effects of group {recall: [F(2, 46) = 1.26, p =.293]; recognition: [F(2, 45) = 0.31, p =.734]}. We also analyzed the slopes of remembered items across trials since prior studies have shown that right hippocampal damage impairs learning but not remembering of designs (Majdan, Sziklas, & Jones-Gotman, 1996). There was no main effect in slope across the groups [F(2, 46) = 1.37, p =.265]. Thus, we conclude that BMI does not influence the ability to learn or remember abstract designs.
Figure 2.
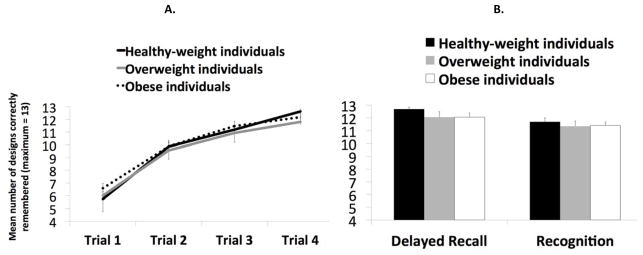
A. Experiment 1: Mean number of designs correctly remembered (on a maximum of 13) in the Abstract Design List learning (ADL) task across the four learning trials (1–4) and according to the experimental groups, i.e. health-weight, overweight and obese individuals. B. Mean number of designs correctly remembered in the same task during the delayed recall trial and mean number of designs correctly recognized during the recognition task according to the experimental group.
3.3. CCPT
3.3.1. Working memory task
To determine if BMI is associated with working memory we compared total number of errors on the red ball counting task across groups. A one-way ANOVA revealed a statistical trend [F(2, 45) = 2.65, p =.082, η2 =.11] for group differences. Since we had hypothesized that the obese and overweight groups would perform worse than the healthy weight group we performed planned comparisons to test these specific predictions. Overweight [F(1, 29) = 4.56, p =.041, η2 =.14] and obese individuals [F(1, 30) = 5.04, p =.032, η2 =.14] both made significantly more errors than did the healthy weight participants and did not differ from each other [F(1, 31) = 0.46, p =.502] (Figure 3). A follow up analysis showed that healthy weight individuals tended to make less over-estimation errors than overweight [F(1, 29) = 4.02, p =.054, η2 =.12] and made significantly less than obese [F(1, 30) = 4.24, p =.048, η2=.12].
Figure 3.

Experiment 1: Mean number of errors (under-estimation errors, over-estimation errors and total number of errors) in he working memory task of the Conditioned Cue Preference Test (i.e., counting the number of red balls) according to the experimental group, i.e. healthy-weight, overweight and obese individuals. Error bars represent standard errors of the mean.
3.3.2. Condition cue preference test (CCPT)
The results of the CCPT are displayed in Figure 4. The average number of times (from 0 to 10) that a pattern was selected as most preferred served as the preference score.
Figure 4.

Experiment 1: Mean preference score (out of a maximum of 10) for the “positive” pattern (paired with a food reward 90% of the time), the “bivalent” pattern paired with a food reward 50% of the time), and the “negative” pattern paired with a food reward (10% of the time) in healthy-weight, overweight and obese individuals. Error bars represent standard errors of the mean.
To determine if preference scores differed across the groups we conducted a 3 * 3 repeated measures ANOVA with the factors experimental group (3: healthy weight, overweight, obese) and pattern (3: positive, bivalent, negative). This analysis revealed a significant group by pattern interaction [F(4, 92) = 2.80, p =.030, η2 =.11], which arose because the preferred pattern differed across groups. Specifically, in contrast to our prediction the healthy weight group showed no preference for a single pattern, selecting each as most preferred [F(2, 30) = 0.06, p =.945] with equal frequency (average preference scores for the positive, negative and bivalent patterns are 5.44, 5.81 and 5.56, respectively). In contrast, and again counter to our prediction, the obese participants showed a preference for the negative over the positive pattern [F(1,16) = 5.80, p =.028, η2 =.27] and a trend for a similar preference over the bivalent pattern F(1,16) = 3.30, p =.088, η2 =.17]. Preference for the negative pattern was also significantly greater for the obese compared to the overweight group [F(1,31) = 5.91, p =.021, η2 =.16]. The overweight group also formed a preference but here it was for the bivalent over the negative [F(1, 15) = 6.90, p =.019, η2 =.32]. No other significant effects were observed.
Next, we considered whether working memory ability was related to preference formation. Working memory demand has been shown to interfere with preference formation in this task (Brunstrom & Higgs, 2002). Since our healthy weight subjects failed to develop a preference for the positive outcome pattern and since overweight and obese individuals demonstrated working memory deficits we hypothesized that the lack of preference formation in the healthy weight group and the negative preference in the obese might be related to working memory performance. To test this we re-ran all analyses using the total number of errors on the working memory task as a covariate. Preference learning was still absent in the healthy weight group [F(2, 26) = 1.13, p =.337]. Obese participants no longer showed a preference for the negative over the positive pattern [F(1,15) = 0.02, p =.884], but still preferred the negative over the bivalent pattern [F(1,15) = 5.37, p =.035, η2 =.26]. This pattern was also more preferred by the obese compared to the overweight group [F(1,30) = 5.19, p =.030, η2 =.15]. To gain further insight into how working memory might impact results we ran correlation analyses between the working memory and preference scores. A trend towards a negative relationship was observed between working memory scores in the obese and preference score for the negative outcome pattern (r = .−46, p = .062). Specifically, poorer working memory scores were associated with greater preference for the negative outcome pattern. This association was not observed in the overweight and healthy weight groups.
We therefore conclude that working memory demands were unrelated to our failure to observe a positive preference formation in the healthy weight group, but may be related to negative preference formation in the obese.
In summary, BMI did not influence explicit learning and memory but it was associated with impaired working memory and altered conditioning.
Experiment 2
The results from experiment 1 suggest that conditioning is altered in obesity. However, since healthy weight individuals did not form a preference we cannot conclude that the deficit is with “preference” conditioning per se. In addition, since the unconditioned reward was a snack food, it is possible that even though participants claimed to be unaware of the contingencies, obese participants purposefully selected the pattern not associated with the food to avoid social stigma. In this case performance would not reflect a “preference” for stimuli associated with negative outcomes. To address these concerns we conducted a second experiment where positive and negative outcome learning were assessed (Frank, Seeberger, & O’Reilly, 2004) and money was used to assess preference formation for abstract patterns (Cox, Andrade, & Johnsrude, 2005).
5. Method
5.1. Participants
Thirty-six participants were enrolled in this experiment. Participants were members of the New Haven and/or Yale Communities. Access to the population was gained by advertising through fliers posted throughout the Yale-New Haven area and by word-of-mouth. As in Experiment 1, all participants were screened over the phone to ensure they met inclusion criteria1. Six healthy weight participants were excluded following participation because they were aware of the association of the reward contingencies. Demographic information is summarized in Table 2.
Table 2.
Demographic Information - Experiment 2.
| Healthy-weight | Obese | |
|---|---|---|
| Number of participants (number of women) | 15 (9) | 15 (9) |
| Average Body Mass Index | 21.80 (SD = 1.66) | 40.09 (SD = 11.69) |
| Average age | 25.13 (SD = 5.63) | 28.53 (SD = 5.77) |
| Average years of education | 17.40 (SD = 3.18) | 14.27 (SD = 1.58) |
| CCPT – Preference score for the positive pattern | 12.60 (SD = 5.07) | 9.00 (SD = 4.12) |
| CCPT – Preference score for the bivalent pattern | 10.00 (SD = 3.95) | 11.27 (SD = 5.39) |
| CCPT – Preference score for the negative pattern | 4.13 (SD = 3.66) | 8.73 (SD = 3.67) |
| Probabilistic learning task – Choose A | 65.44 (SD = 27.75) | 69.6 (SD = 23.25) |
| Probabilistic learning task – Avoid B | 82.52 (SD = 15.34) | 65.87 (SD = 19.02) |
| NART | 22.87 (SD = 7.70) | 14.27 (SD = 6.82) |
| Self-reported Western diet consumption | 41.73 (SD = 8.68) | 44.98 (SD = 8.71) |
| DEBQ - Dietary restraint | 2.25 (SD = 0.82) | 2.87 (SD = 0.57) |
5.2. Procedure
Upon arrival, the procedures were explained and informed consent was obtained. Next, the neuropsychological tests were performed. The administration order of the CCPT and the Probabilistic Learning Task was counterbalanced across individuals.
5.2.1. Conditioned Cue Preference Test (CCPT)
As in experiment 1, the CCPT (Cox, Andrade, & Johnsrude, 2005) assesses preference conditioning for initially neutral stimuli. However, in experiment 2 money rather than snack food was used as a reward. In the formation phase of this version of the task, similar to Cox et al. (2005), participants were presented with virtual playing cards. These cards were displayed face up, one at a time, on a computer screen. Participants were told that a number was written on the back of each card. They were instructed to guess whether the number was higher or lower than the value shown. After they gave their response, the card was flipped, and feedback (positive or negative) was given. On “correct” trials, the number superimposed on the back of the card was presented in green. On “incorrect” trials, the number was presented in red. Positive feedback consisted of 0.25 $US and a melodic flourish. Negative feedback was a loss of 0.22 $US and a buzzer sound. This conditioning procedure, including the monetary gain and loss, was proven the most effective of several conditioning procedures tested in previous work Cox (2004). On the right side of the computer screen, there was a “reward bar” that represented cumulative winnings. This bar was always visible, and rose and fell in accordance with the positive or negative feedback. The playing cards varied from numbers 4 to 9. The outcome numbers on the back varied from 1 to 12.
Unbeknownst to the participants, the outcome of a trial (correct or incorrect) was in fact pre-specified, and the outcome numbers were (pseudorandomly) chosen after the participant’s response to conform to this pre-specified outcome. Thus, if the face of the card was a 4, the participant pressed “higher,” and the trial outcome was pre-specified to be correct, then the number written on the back of the card would be between 5 and 12. Conversely, if that trial was specified to be incorrect, the number on the back would be 1, 2, or 3. This procedure enabled us to control the frequency with which positive and negative feedback was given, while remaining credible to participants. The back of the cards showed an outcome number, which was superimposed on one of five different abstract visual patterns (Petrides and Milner, 1982; Johnsrude et al., 1999), which were not mentioned in the instructions, and irrelevant to the task itself. Each of the patterns was associated with positive/negative feedback at a pre-specified ratio, of 90%, 70%, 50%, 30% or 10%.
The formation phase consisted of two training blocks, each with 120 trials (120 correct and 120 incorrect). We counterbalanced the pattern – reward contingency by using five versions of the task so that each pattern was associated with each reward contingency (90%, 70%, 50%, 30% or 10% predictive). The patterns of interest were those associated with a 90%, 50% and 10% probability of reward, and were presented 60 times each. The patterns associated with a 70% and 30% probability of reward were presented 30 times each.
The second phase of the test, the judgment phase, began once both training runs were completed. Participants were shown eight patterns, of which five were the conditioned ones, and three were novel. In each trial, two patterns were presented sequentially at first, in the middle of the screen, and then simultaneously, on the left and right sides of the screen. When shown together, participants had to indicate which of the two patterns they preferred. They received the following instruction: “Don’t think too hard, just go with your first impression”. This was repeated 72 times. Each of the five patterns was presented 18 times, 9 times on the left and 9 times on the right. The patterns presented during this phase of the test consisted of the five abstract patterns used in the first part of the test, as well as three novel abstract patterns. In 30 trials, the positive, negative, and bivalent patterns were paired with each other, which allowed us to investigate conditioning effects independent of differences in exposure. In 10 of these 30 trials, the positive pattern was paired directly with the negative pattern. In another 30 trials, each of the three novel patterns (from the binary preference task) was paired with each of the five conditioned patterns. In the 12 remaining trials, the displayed pairs were formed from only novel patterns.
During the third phase of the test, called question phase, participants were shown all eight patterns from the judgment phase. These patterns were presented with a number superimposed on each of them. This number represented the number of times that they were chosen as preferred during the judgment phase. The participants were then asked to indicate why they chose the two patterns chosen most often and the two patterns chosen least often. Participants were also asked if they remembered seeing any of the patterns during the initial (formation) phase of the test. If they said yes, they were asked which ones. Finally, they were asked whether they had noticed anything in particular when seeing them. If the participants did not say anything spontaneously, they were prompted with the following sentence: “for example, with a particular number or color?”.
5.2.2. Probabilistic Learning Task
The Probabilistic Learning Task (Frank, Seeberger, & O’Reilly, 2004) measures the ability to learn from positive and negative outcomes. In the learning phase participants were presented with one of three pairs of patterns (AB, CD and EF), and told to choose one of them. They then received feedback indicating whether their choice was correct or incorrect. In AB pairs, choosing A led to feedback that the choice was “correct’” 80% or “incorrect” 20% of the time. Choosing B resulted in the opposite feedback so that it was incorrect 80% of the time. In CD pairs, choosing C led to feedback that the choice was “correct” 70% and “incorrect” 30% of the time (and vice versa for D). In EF pairs, E was correct 60% and incorrect 40% of the time and vice versa for F. Over trials participants learn to choose A, C and E more often than B, D and F. Once criterion is reached the test phase begins where new pairs are presented and feedback no longer provided (AC, AD, AE, AF, BC, BD, BE, BF). If participants learned to choose A over B by learning that A leads to “correct” feedback, they should choose A in all these novel pairs; in contrast, if participants learned to choose A over B by learning that B leads to an incorrect feedback, then they should be more likely to avoid B in the novel pairs.
5.2.3. NART and Questionnaires
Participants completed the National Adult Reading Test (NART; Nelson, 1982) as a measure of verbal IQ estimate and filled out the Dutch Eating Behavior Questionnaire (DEBQ; van Strien, Frijters, Bergers, & Defares, 1986), which assesses restrained, emotional and external eating behavior, and the dietary fat and free sugar questionnaire (Francis & Stevenson, 2013).
5.2.4. Anthropometric measures
Height and weight were measured using a Detecto 439 Mechanical Scale (footwear and coats removed) and waist circumference was assessed.
5.2.5. Compensation
The participant was paid 30 $US as a compensation for their time, and 3.5 $US for the money they had “won” during the CCPT.
6. Results
6.1. Age and level of education
One-way Analyses of Variance (ANOVA) revealed no significant differences in age between the groups: [F(1, 28) = 2.67, p =.114] but a significant difference in the level of education: [F(1, 28) = 11.68, p =.002, η2 =.29]. We consequently conducted all relevant group analyses with the level of education as a covariate.
6.2. CCPT – Conditioning cue preference test
The results of the CCPT are displayed in Figure 5. The average number of times (from 0 to 18) that a pattern was selected as most preferred served as the preference score.
Figure 5.

Experiment 2: Mean preference score (out of a maximum of 18) for the “positive” pattern (paired with a monetary reward 90% of the time), the “bivalent” pattern (paired with a monetary reward 50% of the time), and the “negative” pattern (paired with a monetary reward (10% of the time) in healthy-weight, overweight and obese individuals. Error bars represent standard errors of the mean.
To determine if preference scores differed across the groups we conducted a 2 * 3 repeated measures ANOVA with the factors experimental group (2: healthy weight, obese) and pattern (3: 90%, 50%, and 10% probability of reward). This analysis revealed a significant group by pattern interaction [F (2, 54) = 5.27, p =.008, η2 =.16], which arose because the preferred pattern differed across groups. Specifically, healthy weight individuals showed a preference for the positive pattern over the negative one [F(1, 14) = 24.21, p < .001, η2 =.63] and for the bivalent pattern over the negative one [F(1, 14) = 25.12, p < .001, η2 =.64]. Obese individuals showed no preference for a single pattern, selecting each as most preferred [F(2, 28) = 1.19, p =.318] with equal frequency (average preference scores for the positive, negative and bivalent patterns are 9.00, 8.73 and 11.27, respectively). Preference for the positive pattern was significantly greater for the healthy weight compared to the obese group [F(1, 27) = 6.34, p =.018, η2 =.19] while preference for the negative pattern was significantly greater for the obese compared to the healthy weight group [F(1, 27) = 5.62, p =.025, η2 =.17].
6.3. Probabilistic Learning Task
Consistent with our findings in experiment 1 the obese individuals were less successful at avoiding the pattern associated with the negative outcome than the healthy weight individuals (avoid B) [F(1, 27) = 6.26, p =.019, η2 =.19]. In contrast, the groups did not differ in their ability to select the pattern associated with positive outcomes (choose A) [F(1, 27) = 1.57, p =.221] (see Figure 6).
Figure 6.

Experiment 2: Mean percent accuracy for “choose A” (selecting the pattern associated with positive outcomes) and “avoid B” (avoiding the pattern associated with negative outcomes) on the probabilistic learning task in healthy-weight and obese individuals. Error bars represent standard errors of the mean.
6.4. NART and questionnaires
Healthy weight individuals did not perform better at the NART than obese individuals [F(1, 27) = 2.39, p =.134] with the level of education as a covariate. In addition, when including NART rather than level of education as a covariate in the above analyses, all effects remained.
There was no significant effect of group on self-reported Western diet consumption [F(1, 23) = 0.99, p =.329]. To evaluate possible effects of dietary restraint, following Brunstorm, Downes and Higgs (2001) we used a median split of the DEBQ restraint score to define restrained and unrestrained. In healthy weight individuals (N = 8 restrained eaters, 7 unrestrained eaters, median = 2.1), there was no significant interaction between dietary restraint status and contingencies of reinforcement on preference scores [F(2,26) = 0.55, p =.581]. In obese individuals (N = 8 restrained eaters, 7 unrestrained eaters, median = 2.95), there was a weak trend [F(2,26) = 2.62, p =.092]. Preference for the negative pattern was significantly greater for the unrestrained compared to the restrained eaters [F(1,13) = 8.79, p =.011, η2 =.40]. Preferences for the positive and bivalent patterns were not influenced by the dietary restraint status [F(1,13) = 1.01, p =.333 and F(1,13) = 0.71, p =.415, respectively].
In summary, in experiment 2 we find additional evidence of impaired conditioning and negative outcome learning in obesity.
4. Discussion
We conducted two experiments to examine the relationship between BMI and learning and memory. BMI did not influence explicit learning and memory for abstract designs. However, both overweight and obese groups were impaired relative to healthy control participants on a working memory task. In addition obese participants showed deficits in preference conditioning based on both food and monetary rewards as well as impaired negative outcome learning.
4.1. Explicit Learning and Memory
Prior studies of explicit learning and memory in obesity have produced conflicting findings (e.g., Benito-León et al., 2013; Van den Berg et al., 2009; Cournot et al., 2006; Elias et al., 2003; Kuo et al., 2006; Miller et al., 2013; Stanek et al., 2013). The current results support the conclusion that adiposity does not influence this ability. Rather, emerging data in humans and other animals indicate that explicit learning and memory are specifically impaired by consumption of a Western diet independently from adiposity. For example, Kanoski and Davidson reported memory deficits in rodents after as little as three days of Western diet consumption (Kanoski & Davidson, 2010) and Francis and Stevenson have recently reported a negative association between verbal memory performance and high fat diet consumption in healthy weight individuals (Francis & Stevenson, 2011). Our results support and extend this conclusion by showing no influence of BMI on a nonverbal learning and memory task.
4.2. Working Memory
Consistent with many prior studies (e.g., Van den Berg et al., 2009; Fitzpatrick, Gilbert, & Serpell, 2013; Francis & Stevenson, 2011; Stingl et al., 2012), we observed a significant impairment in working memory in both overweight and obese individuals. This finding cannot be attributed to age, education or gender, as these factors did not differ across the groups. Importantly, both overweight and obese differed from healthy weight but not from each other. This suggests that working memory impairments do not worsen with increasing adiposity. Interestingly, we also found that the errors made on this task were not random but rather tended to be over-estimations of the number of balls presented. This contrasts with the earlier work by Johnsrude and colleagues (2000) who reported that patients with frontal lobe lesions tended to make errors of under-estimation (Johnsrude, Owen, White, Zhao, & Bohbot, 2000). The reason for this discrepancy is not clear. One possibility is that the tendency to over-estimate by the obese relates to the tendency to over-estimate negative events (Harris, Corner, & Hahn, 2009). Specifically, since overweight and obese participants formed a preference for the patterns that indicated the red ball was less likely to appear, it is possible that the appearance of the red ball might have been experienced as a negative event and consequently over-estimated.
4.3 Stimulus Reward Association Learning: Conditioned Preference Formation
In addition to working memory and explicit learning and memory we also evaluated the influence of BMI on stimulus reward association learning using two preference conditioning tasks. Several unexpected findings were observed. First, the healthy weight participants did not form a preference for the pattern most strongly predictive of a treat. Thus, we were unable to replicate Johnsrude and colleagues (1999) and Brunstrom and Higgs (2002). The reason for this lack of replication is unclear. Our sample was of roughly the same age, education level and gender composition as theirs. Moreover, working memory scores were unrelated to preference formation in healthy weight individuals indicating that working memory demand unlikely accounts for the result. One possibility is that there was a differential effect of experimental demand (Orne, 1962) on the two samples. More specifically, it is possible that our population of participants did not want to be seen as preferring the pattern associated with snack rewards. However, we feel this possibility is unlikely because both studies excluded participants who reported being aware of the association between the patterns and the reward. Nevertheless, in experiment 2 with monetary reward healthy weight participants did form the expected preferences for patterns associated with positive outcomes.
The second unexpected finding was that the obese group formed a preference for the pattern most strongly predictive of a negative food outcome. Including working memory in the model somewhat diminished the effect, with poor working memory scores associated with stronger preferences for the negative outcome pattern. It is therefore possible that working memory deficits contribute to the altered negative outcome learning. Further, since working memory and negative outcome learning are both dependent upon dopamine signaling (Sawaguchi & Goldman-Rakic, 1991) it is conceivable that the deficits we have observed in working memory and stimulus reward learning both result from altered dopaminergic signaling in response to the obese state. Negative outcome learning impairments and decreased D2 receptor densities have been previously reported in response to extended access to a high fat diet and increased adiposity. Johnson and Kenny found that compared to chow fed rats, rats exposed to a high fat diet showed decreased D2 receptors and failed to reduce responding for food in the presence of a cue that predicted electric shock (Johnson & Kenny, 2010). Accordingly, in humans Wang and colleagues have shown that morbidly obese individuals have decreased binding potential for D2 receptors (Wang et al., 2001). Relatedly, individuals at genetic risk for lower D2 signaling are more likely to be overweight (Blum et al., 2000) and are impaired at negative outcome learning (Klein et al., 2007). Increased impulsivity, characterized by a lack of regard for negative outcomes, has also been observed in obese individuals (Babbs et al., 2013; Mobbs, Crépin, Thiéry, Golay, & Van der Linden, 2010; Nederkoorn, Jansen, Mulkens, & Jansen, 2007; Nederkoorn, Smulders, Havermans, Roefs, & Jansen, 2006).
One notable feature of our results was that this preference for the pattern associated with the negative food outcome was not present in overweight participants and the strength of preference for the negative outcome pattern was significantly greater for the obese compared to the overweight group. Moreover, the overweight participants formed a preference for the bivalent pattern. This suggests the possibility that impairments in negative outcome learning emerge over time with increased exposure to Western diets and/or greater adiposity. Again, as with the lack of preference formation for the positive outcome pattern, we could not rule out the possibility that overweight and obese participants might have purposefully chosen the negative or bivalent pattern to appear to favor food less. For this reason we conducted a second study using monetary rewards. In contrast to healthy control participants, obese individuals did not form a preference for the positive outcome pattern. This result clearly demonstrates impaired preference conditioning in obesity, which is unlikely related to differences in education or intelligence because all reported effects were controlled for their potential influence. In addition, as in experiment 1, obese individuals again fail to avoid choosing the negative outcome pattern, selecting it more frequently than healthy weight individuals. Interestingly, preference for the negative outcome pattern was also related to dietary restraint in study two (it was not assessed in study 1). Dietary restraint has previously been shown to influence preference formation for flavors, with restrained eaters preferring flavors least frequently paired with chocolate (Brunstrom, Higgs, & Mitchell, 2005). Here, with the monetary reward, the opposite pattern was observed; restrained eaters were less likely to prefer the pattern associated with the negative outcome. This suggests that restrained eating may be associated with more efficient conditioning since in both cases preferences are formed (or avoided) according to the presumed goals of the individual (avoiding calories and maximizing monetary reward). If so, this would also suggest the existence of some level of contingency awareness in restrained eaters – even though they are unable to articulate this association when explicitly asked (Brunstrom, 2004; Brunstrom & Higgs, 2002).
Likewise, obese compared to healthy weight individuals showed deficits in negative, but not positive outcome learning on the probabilistic learning task. Specifically, they were unable to avoid choosing the pattern consistently associated with negative feedback but were able to learn to select the pattern associated with positive feedback. Since working memory demands are similar in both, this finding suggests that working memory deficits do not account for the observed deficits in negative outcome learning; although this does not preclude the possibility that both impairments are related to altered dopamine signaling.
If it is the case that obese individuals fail to learn about negative outcomes an important question becomes how this impairment may impact eating behavior? There are several possibilities. First, failing to appreciate the negative consequences of overeating may decrease the impact that these outcomes have on deterring unhealthy eating behavior. It may also contribute to compulsive responding for food in a more implicit manner as is observed in rodents who, following a high fat diet and weight gain fail to stop responding for food in the presence of a cue that signals impending shock (Johnson & Kenny, 2010). Second, as suggested by Kanoski and Davidson (2011), internal signals of hunger and satiety may fail to appropriately modulate behavior following a high fat diet so that eating occurs despite the fact that one has learned that eating in the absence of hunger fails to produce the expected reward signal (i.e., a negative outcome). In such a manner, brain adaptations to a high fat diet may help to entrain a viscous cycle of positive energy balance leading to obesity. Third, lack of regard for negative outcomes is an integral part impulsivity which is itself consistently linked to overeating and obesity (Yeomans, Leitch, & Mobini, 2008; Delgado-Rico et al., 2012; Davis, 2009). Our data raise the possibility that a deficit in negative outcome learning may contribute to impulsive eating. Finally, it may be the case that a fundamental deficit in negative outcome learning may contribute to a variety of behaviors associated with unhealthy eating. Regardless, the current findings indicate that future work is needed aimed at linking negative outcome learning deficits directly to eating behavior.
Conclusions
We conclude that working memory and negative outcome learning are impaired in obesity and we speculate that this occurs in response to adaptations in the dopamine system in response to overeating. However, we note two caveats. First, we are unable to rule out the possibility that physiological changes associate with obesity contributed to the observed effects as our exclusion criteria were confirmed only by self-report (i.e., participants did not undergo a full medical exam). Second, norms do not exist for our conditioning task and therefore it is difficult to know the level of actual impairment. For example, group differences could exist with both groups scoring in the normal range.
Highlights.
We investigated learning and memory in overweight/obese individuals
Explicit learning and memory was not associated with BMI
Both overweight and obese participants displayed a working memory deficit
Obese individuals exhibited associative learning deficits
Obese individuals exhibited impaired negative outcome learning
Acknowledgments
This work was supported by the National Institutes of Diabetes and Digestive and Kidney Diseases R01 DK085579 awarded to Dana M. Small and an Early Postdoctoral Mobility fellowship from the Swiss National Science Foundation (PBGEP1-139853) and a Marie Curie postdoctoral fellowship COFUND to Géraldine Coppin.
The authors would like to thank Bastiaan Oud for insightful comments.
The authors would like to thank Sylvia Cox for providing the materials necessary to administer the Conditioned Cue Preference Test, used in Experiment 2.
Footnotes
Two obese participants had a history of drug abuse. Excluding these participants did not change the absence of evidence of preference for the positive pattern in the CCPT and the deficit in negative outcome learning in the Probabilistic learning task.
Authors’ contributions
Ms Géraldine Coppin formalized the data analyses of Experiment 1, collected the data of Experiment 2, analyzed the data of Experiment 2 and wrote the manuscript; Ms Sarah Nolan-Poupart participated in Experiment 1’s design, collected the data of Experiment 1 and ran preliminary data analyses of Experiment 1; Ms Marilyn Jones-Gotman provided the ADL’s materials and participated in writing the manuscript; Ms Dana M. Small designed and supervised the experiments and participated in writing the manuscript.
Publisher's Disclaimer: This is a PDF file of an unedited manuscript that has been accepted for publication. As a service to our customers we are providing this early version of the manuscript. The manuscript will undergo copyediting, typesetting, and review of the resulting proof before it is published in its final citable form. Please note that during the production process errors may be discovered which could affect the content, and all legal disclaimers that apply to the journal pertain.
References
- Babbs RK, Sun X, Felsted J, Chouinard-Decorte F, Veldhuizen MG, Small D. Decreased caudate response to milkshake is associated with higher body mass index and greater impulsivity. Physiology & Behavior. 2013;10(121):103–111. doi: 10.1016/j.physbeh.2013.03.025. [DOI] [PMC free article] [PubMed] [Google Scholar]
- Benito-León J, Mitchell AJ, Hernández-Gallego J, Bermejo-Pareja F. Obesity and impaired cognitive functioning in the elderly: a population-based cross-sectional study (NEDICES) European Journal of Neurology: The Official Journal of the European Federation of Neurological Societies. 2013;20(6):899–906. e76–7. doi: 10.1111/ene.12083. [DOI] [PubMed] [Google Scholar]
- Blum K, Braverman ER, Holder JM, Lubar JF, Monastra VJ, Miller D, Lubar JO, Chen TJ, Comings DE. Reward deficiency syndrome: A biogenetic model for the diagnosis and treatment of impulsive, addictive, and compulsive behaviors. Journal of Psychoactive Drugs. 2000;32(Suppl):i–iv. 1–112. doi: 10.1080/02791072.2000.10736099. [DOI] [PubMed] [Google Scholar]
- Brunstrom JM. Does dietary learning occur outside awareness? Consciousness and Cognition. 2004;13(3):453–470. doi: 10.1016/j.concog.2004.05.004. [DOI] [PubMed] [Google Scholar]
- Brunstrom JM, Downes CR, Higgs S. Effects of dietary restraint on flavour-flavour learning. Appetite. 2001;37(3):197–206. doi: 10.1006/appe.2001.0432. [DOI] [PubMed] [Google Scholar]
- Brunstrom JM, Higgs S. Exploring evaluative conditioning using a working memory task. Learning and Motivation. 2002;33(4):433–455. doi: 10.1016/S0023-9690(02)00007-3. [DOI] [Google Scholar]
- Brunstrom JM, Higgs S, Mitchell GL. Dietary restrain and US devaluation predict evaluative learning. Physiology & Behavior. 2005;85(4):524–535. doi: 10.1016/j.physbeh.2005.06.001. [DOI] [PubMed] [Google Scholar]
- Chelune GJ, Ortega D, Linton JC, Boustany MM. Personality and Cognitive Findings Among Patients Electing Gastroplasty for Morbid Obesity. International Journal of Eating Disorders. 1986;5(4):701–712. [Google Scholar]
- Cournot M, Marquié JC, Ansiau D, Martinaud C, Fonds H, Ferrières J, Ruidavets JB. Relation between body mass index and cognitive function in healthy middle-aged men and women. Neurology. 2006;67(7):1208–14. doi: 10.1212/01.wnl.0000238082.13860.50. [DOI] [PubMed] [Google Scholar]
- Cox SML. Unpublished doctoral dissertation. University of Cambridge; United Kingdom: 2004. Learning to like: Behavioural expression and neural bases of conditioned preferences in humans. [Google Scholar]
- Cox SML, Andrade A, Johnsrude IS. Learning to like: a role for human orbitofrontal cortex in conditioned reward. The Journal of Neuroscience. 2005;25(10):2733– 40. doi: 10.1523/JNEUROSCI.3360-04.2005. [DOI] [PMC free article] [PubMed] [Google Scholar]
- Davis C. Psychobiological traits in the risk profile for overeating and weight gain. International Journal of Obesity. 2009;33(Suppl 2):S49–S53. doi: 10.1038/ijo.2009.72. [DOI] [PubMed] [Google Scholar]
- Delgado-Rico E, Río-Valle JS, Gonzáles-Jiménez E, Campoy C, Verdejo-García A. BMI predicts emotion-driven impulsivity and cognitive inflexibility in adolescents with excess weight. Obesity. 2012;20(8):1604–1610. doi: 10.1038/oby.2012.47. [DOI] [PubMed] [Google Scholar]
- Elias MF, Elias PK, Sullivan LM, Wolf Pa, D’Agostino RB. Lower cognitive function in the presence of obesity and hypertension: the Framingham heart study. International Journal of Obesity and Related Metabolic Disorders: Journal of the International Association for the Study of Obesity. 2003;27(2):260–8. doi: 10.1038/sj.ijo.802225. [DOI] [PubMed] [Google Scholar]
- Farr SA, Yamada Ka, Butterfield DA, Abdul HM, Xu L, Miller NE, Morley JE. Obesity and hypertriglyceridemia produce cognitive impairment. Endocrinology. 2008;149(5):2628–36. doi: 10.1210/en.2007-1722. [DOI] [PMC free article] [PubMed] [Google Scholar]
- Fitzpatrick S, Gilbert S, Serpell L. Systematic Review: Are Overweight and Obese Individuals Impaired on Behavioural Tasks of Executive Functioning? Neuropsychology Review. 2013;23(2):138–156. doi: 10.1007/s11065-013-9224-7. [DOI] [PubMed] [Google Scholar]
- Francis HM, Stevenson RJ. Higher reported saturated fat and refined sugar intake is associated with reduced hippocampal-dependent memory and sensitivity to interoceptive signals. Behavioral Neuroscience. 2011;125(6):943–55. doi: 10.1037/a0025998. [DOI] [PubMed] [Google Scholar]
- Francis HM, Stevenson RJ. Validity and test-retest reliability of a short dietary questionnaire to assess intake of a saturated fat and free sugar: A preliminary study. Journal of Human Nutrition and Dietetics. 2013;26(3):234–242. doi: 10.1111/jhn.12008. [DOI] [PubMed] [Google Scholar]
- Frank MJ, Seeberg LC, O’Reilly RC. By carrot or by stick: Cognitive reinforcement learning in parkinsonism. Science. 2004;306(5703):1940–1943. doi: 10.1126/science.1102941. [DOI] [PubMed] [Google Scholar]
- Granholm AC, Bimonte-Nelson Ha, Moore AB, Nelson ME, Freeman LR, Sambamurti K. Effects of a saturated fat and high cholesterol diet on memory and hippocampal morphology in the middle-aged rat. Journal of Alzheimer’s Disease: JAD. 2008;14(2):133–45. doi: 10.3233/jad-2008-14202. [DOI] [PMC free article] [PubMed] [Google Scholar]
- Greenwood CE, Winocur G. Learning and memory impairment in rats fed a high saturated fat diet. Behavioral and Neural Biology. 1990;53(1):74–87. doi: 10.1016/0163-1047(90)90831-P. [DOI] [PubMed] [Google Scholar]
- Greenwood CE, Winocur G. Glucose treatment reduces memory deficits in young adult rats fed high-fat diets. Neurobiology of Learning and Memory. 2001;75(2):179– 89. doi: 10.1006/nlme.2000.3964. [DOI] [PubMed] [Google Scholar]
- Gunstad J, Paul RH, Cohen RA, Tate DF, Spitznagel MB, Gordon E. Elevated body mass index is associated with executive dysfunction in otherwise healthy adults. Comprehensive Psychiatry. 2007;48(1):57–61. doi: 10.1016/j.comppsych.2006.05.001. [DOI] [PubMed] [Google Scholar]
- Harris AJL, Corner A, Hahn U. Estimating the probability of negative events. Cognition. 2009;110(1):51–64. doi: 10.1016/j.cognition.2008.10.006. [DOI] [PubMed] [Google Scholar]
- Higgs S. Memory for recent eating and its influence on subsequent food intake. Appetite. 2002;39(2):159–166. doi: 10.1006/appe.2002.0500. [DOI] [PubMed] [Google Scholar]
- Higgs S. Memory and its role in appetite regulation. Physiology & Behavior. 2005;85(1):67–72. doi: 10.1016/j.physbeh.2005.04.003. [DOI] [PubMed] [Google Scholar]
- Higgs S. Cognitive influences on food intake: the effects of manipulating memory for recent eating. Physiology & Behavior. 2008;94(5):734–9. doi: 10.1016/j.physbeh.2008.04.012. [DOI] [PubMed] [Google Scholar]
- Higgs S, Williamson AC, Attwood AS. Recall of recent lunch and its effect on subsequent snack intake. Physiology & Behavior. 2008;94(3):454–62. doi: 10.1016/j.physbeh.2008.02.011. [DOI] [PubMed] [Google Scholar]
- Johnson PM, Kenny PJ. Dopamine D2 receptors in addiction-like reward dysfunction and compulsive eating in obese rats. Nature Neuroscience. 2010;13(5):635–41. doi: 10.1038/nn.2519. [DOI] [PMC free article] [PubMed] [Google Scholar]
- Johnsrude IS, Owen AM, White NM, Zhao WV, Bohbot V. Impaired preference conditioning after anterior temporal lobe resection in humans. The Journal of Neuroscience: The Official Journal of the Society for Neuroscience. 2000;20(7):2649–56. doi: 10.1523/JNEUROSCI.20-07-02649.2000. [DOI] [PMC free article] [PubMed] [Google Scholar]
- Johnsrude IS, Owen AM, Zhao WV, White NM. Conditioned Preference in Humans: A Novel Experimental Approach. Learning and Motivation. 1999;30(3):250–264. doi: 10.1006/lmot.1999.1031. [DOI] [Google Scholar]
- Jones-Gotman M. Memory for designs: the hippocampal contribution. Neuropsychologia. 1986;24(2):193–203. doi: 10.1016/0028-3932(86)90052-7. [DOI] [PubMed] [Google Scholar]
- Jurdak N, Lichtenstein AH, Kanarek RB. Diet-induced obesity and spatial cognition in young male rats. Nutritional Neuroscience. 2008;11(2):48–54. doi: 10.1179/147683008X301333. [DOI] [PubMed] [Google Scholar]
- Kanoski SE, Davidson TL. Different patterns of memory impairments accompany short- and longer-term maintenance on a high-energy diet. Journal of Experimental Psychology Animal Behavior Processes. 2010;36(2):313–9. doi: 10.1037/a0017228. [DOI] [PubMed] [Google Scholar]
- Kanoski SE, Davidson TL. Western diet consumption and cognitive impairment: links to hippocampal dysfunction and obesity. Physiology & Behavior. 2011;103(1):59–68. doi: 10.1016/j.physbeh.2010.12.003. [DOI] [PMC free article] [PubMed] [Google Scholar]
- Kanoski SE, Meisel RL, Mullins AJ, Davidson TL. The effects of energy-rich diets on discrimination reversal learning and on BDNF in the hippocampus and prefrontal cortex of the rat. Behavioural Brain Research. 2007;182(1):57–66. doi: 10.1016/j.bbr.2007.05.004. [DOI] [PMC free article] [PubMed] [Google Scholar]
- Kanoski SE, Zhang Y, Zheng W, Davidson TL. The effects of a high-energy diet on hippocampal function and blood-brain barrier integrity in the rat. Journal of Alzheimer’s Disease: JAD. 2010;21(1):207–19. doi: 10.3233/JAD-2010-091414. [DOI] [PMC free article] [PubMed] [Google Scholar]
- Klein TA, Neumann J, Reuter M, Hennig J, von Cramon DY, Ullsperger M. Genetically determined differences in learning from errors. Science. 2007;318(5856):1642–5. doi: 10.1126/science.1145044. [DOI] [PubMed] [Google Scholar]
- Kuo HK, Jones RN, Milberg WP, Tennstedt S, Talbot L, Morris JN, Lipsitz La. Cognitive function in normal-weight, overweight, and obese older adults: an analysis of the Advanced Cognitive Training for Independent and Vital Elderly cohort. Journal of the American Geriatrics Society. 2006;54(1):97–103. doi: 10.1111/j.1532-5415.2005.00522.x. [DOI] [PMC free article] [PubMed] [Google Scholar]
- Liang J, Matheson BE, Kaye WH, Boutelle KN. Neurocognitive correlates of obesity and obesity-related behaviors in children and adolescents. International Journal of Obesity. 2014;38(4):494–506. doi: 10.1038/ijo.2013.142. [DOI] [PMC free article] [PubMed] [Google Scholar]
- Madjan A, Sziklas V, Jones-Gotman M. Performance of healthy control subjects and patients with resection from the anterior temporal lobe on matched tests of verbal and visuoperceptual learning. Journal of Clinical and Experimental Neuropsychology. 1996;18(3):416–430. doi: 10.1080/01688639608408998. [DOI] [PubMed] [Google Scholar]
- Miller LA, Crosby RD, Galioto R, Strain G, Devlin MJ, Wing R, Gunstad J. Bariatric Surgery Patients Exhibit Improved Memory Function 12 Months Postoperatively. Obesity Surgery. 2013;23(10):1527–1535. doi: 10.1007/s11695-013-0970-7. [DOI] [PMC free article] [PubMed] [Google Scholar]
- Mobbs O, Crépin C, Thiéry C, Golay A, Van der Linden M. Obesity and the four facets of impulsivity. Patient Education and Counseling. 2010;79(3):372–7. doi: 10.1016/j.pec.2010.03.003. [DOI] [PubMed] [Google Scholar]
- Murray AJ, Knight NS, Cochlin LE, McAleese S, Deacon RMJ, Rawlins JNP, Clarke K. Deterioration of physical performance and cognitive function in rats with short-term high-fat feeding. FASEB Journal: Official Publication of the Federation of American Societies for Experimental Biology. 2009;23(12):4353–60. doi: 10.1096/fj.09-139691. [DOI] [PubMed] [Google Scholar]
- Nederkoorn C, Jansen E, Mulkens S, Jansen A. Impulsivity predicts treatment outcome in obese children. Behaviour Research and Therapy. 2007;45(5):1071–5. doi: 10.1016/j.brat.2006.05.009. [DOI] [PubMed] [Google Scholar]
- Nederkoorn C, Smulders FTY, Havermans RC, Roefs A, Jansen A. Impulsivity in obese women. Appetite. 2006;47(2):253–6. doi: 10.1016/j.appet.2006.05.008. [DOI] [PubMed] [Google Scholar]
- Nelson HE. The National Adult Reading Test (NART): test manual. Windsor, UK: NFER-Nelson; 1982. [Google Scholar]
- Orne MT. On the social psychology of the psychological experiment: With particular reference to demand characteristics and their implications. American Psychologist. 1962;17(11):776–783. doi: 10.1037/h0043424. [DOI] [Google Scholar]
- Petrides M, Milner B. Deficits on subject-ordered tasks after frontal- and temporal-lobe lesions in man. 1982;20(3):249–262. doi: 10.1016/0028-3932(82)90100-2. [DOI] [PubMed] [Google Scholar]
- Sawaguchi T, Goldman-Rakic PS. D1 dopamine receptors in prefrontal cortex: Involvement in working memory. Science. 1991;251(4996):946–950. doi: 10.1126/science.1825731. [DOI] [PubMed] [Google Scholar]
- Stanek KM, Strain G, Devlin M, Cohen R, Paul R, Crosby RD, Gunstad J. Body mass index and neurocognitive functioning across the adult lifespan. Neuropsychology. 2013;27(2):141–51. doi: 10.1037/a0031988. [DOI] [PMC free article] [PubMed] [Google Scholar]
- Stingl KT, Kullmann S, Ketterer C, Heni M, Häring HU, Fritsche A, Preissl H. Neuronal correlates of reduced memory performance in overweight subjects. NeuroImage. 2012;60(1):362–9. doi: 10.1016/j.neuroimage.2011.12.012. [DOI] [PubMed] [Google Scholar]
- Van den Berg E, Kloppenborg RP, Kessels RPC, Kappelle LJ, Jan G. Biochimica et Biophysica Acta Type 2 diabetes mellitus, hypertension, dyslipidemia and obesity: A systematic comparison of their impact on cognition Note specified. BBA - Molecular Basis of Disease. 2009;1792(5):470–481. doi: 10.1016/j.bbadis.2008.09.004. [DOI] [PubMed] [Google Scholar]
- Van Strien T, Frijters JER, Bergers GPA, Defares PB. The Dutch Eating Behavior Questionnaire (DEBQ) for assessment of restrained, emotional, and external eating behavior. International Journal of Eating Disorders. 1986;5(2):295–315. doi: 10.1002/1098-108X(198602)5:2<295::AID-EAT226005029>3.0CO;2-T. [DOI] [Google Scholar]
- Wang GJ, Volkow ND, Logan J, Pappas NR, Wong CT, Zhu W, Netusil N, Fowler JS. Brain dopamine and obesity. Lancet. 2001;357(9253):354–357. doi: 10.1016/S0140-6736(00)03643-6. [DOI] [PubMed] [Google Scholar]
- Wu A, Molteni R, Ying Z, Gomez-Pinilla F. A saturated-fat diet aggravates the outcome of traumatic brain injury on hippocampal plasticity and cognitive function by reducing brain-derived neurotrophic factor. Neuroscience. 2003;119(2):365–375. doi: 10.1016/S0306-4522(03)00154-4. [DOI] [PubMed] [Google Scholar]
- Yeomans MR, Leitch M, Mobini S. Impulsivity is associated with the disinhibition but not restraint factor from the Three Factor Eating Questionnaire. Appetite. 2008;50(2–3):469–476. doi: 10.1016/j.appet.2007.10.002. [DOI] [PubMed] [Google Scholar]
- Zajonc RB. Attitudinal effects of mere exposure. Journal of Personality and Social Psychology. 1968;9(2):1–27. doi: 10.1037/h0025848. [DOI] [Google Scholar]