Abstract
Background:
Electrical high frequency stimulation (HFS) has been shown to suppress seizures. However, the mechanisms of seizure suppression remain unclear and techniques for blocking specific neuronal populations are required.
Objective:
The goal is to study the optical HFS protocol on seizures as well as the underlying mechanisms relevant to the HFS-mediated seizure suppression by using optogenetic methodology.
Methods:
Thy1-ChR2 transgenic mice were used in both vivo and in vitro experiments. Optical stimulation with pulse trains at 20 and 50 Hz was applied on the focus to determine its effects on in vivo seizure activity induced by 4-AP and recorded in the bilateral and ipsilateral-temporal hippocampal CA3 regions. In vitro methodology was then used to study the mechanisms of the in vivo suppression.
Results:
Optical HFS was able to generate 82.4 % seizure suppression at 50 Hz with light power of 6.1 mW and 80.2 % seizure suppression at 20 Hz with light power of 2.0 mW. The suppression percentage increased by increasing the light power and saturated when the power reached above-mentioned values. In vitro experimental results indicate that seizure suppression was mediated by activation of GABA receptors. Seizure suppression effect decreased with continued application but the suppression effect could be restored by intermittent stimulation.
Conclusions:
This study shows that optical stimulation at high frequency targeting an excitatory opsin has potential therapeutic application for fast control of an epileptic focus. Furthermore, electrophysiological observations of extracellular and intracellular signals reveled that GABAergic neurotransmission activated by optical stimulation was responsible for the suppression.
Keywords: 4-AP, high frequency stimulation, hippocampus, optogenetics, seizure suppression
Introduction
Approximately 60 percent of epilepsy disorders are classified as partial epilepsy, of which temporal lobe epilepsy involving the hippocampus is the most common (1, 2). Temporal lobe epilepsy is also among the most difficult to treat medically, often necessitating surgical resection of an epileptic focus. Electrical high frequency stimulation (HFS) is an alternative treatment for seizure disorders. Previous studies have shown that high frequency electrical stimulation can suppress seizures in animal models of epilepsy (3-5) and reduce seizure frequency in patients (6-8). However, the mechanisms of seizure suppression remain unclear, and multiple mechanisms are most likely involved (9-12).
Optogenetics provides a possible alternative treatment for epilepsy by allowing for the reversible excitation and inhibition of neurons with millisecond time resolution using light-activated ion channels and pumps expressed in target cell populations. Cell activation can be achieved using channelrhodopsin-2 (ChR2), a light-gated cation channel isolated from the algae Chlamydomonas reinhardtii that has been successfully expressed in mammalian neurons (13). After illumination with blue light, ChR2 opens to allow the passive movement of Na+, H+, Ca2+ and K+ ions, causing depolarization of the cell membrane (14). The light-activated chloride pump, halorhodopsin (NpHR), that is naturally expressed by the halobacterium Natronomonas pharaonis (15), can cause membrane hyperpolarization and inhibition of action potential firing in neurons after exposure to yellow light (16). Given that seizure disorders result from excessive neuronal activity, common optogenetic strategies currently being investigated for the treatment of epilepsy are to inhibit excitatory neurons using NpHR or to excite inhibitory neurons using ChR2 that is selectively expressed in these cells (17). Previously, NpHR expression in the hippocampal formation was shown to provide sufficient inhibition to curtail excessive hyper-excitability induced by an electrical stimulus burst in organotypic slice cultures (18). Similarly, optical activation of NpHR in neurons at the site of an epileptic focus transduced using lentiviral gene delivery can attenuate electrographic seizures in a rodent model of focal neocortical epilepsy using open-loop optical stimulation paradigms (19). Closed-loop control using seizure detection algorithms to apply optical stimulation only at seizure onset has also been shown to be effective to suppress seizures either by temporarily inhibiting pyramidal neurons (20) or through the activation of a sub-population of GABAergic interneurons (21). These studies indicate that seizures can be aborted and hyper-excitability suppressed by optical stimulation that could induce either neural activation or inhibition.
In the present study, the effects of optical HFS protocol on seizures as well as the underlying mechanisms relevant to the HFS-mediated seizure suppression were evaluated. ChR2 expression driven by the Thy-1 promoter is present both in excitatory and inhibitory neurons (22) and is well suited for studying the mechanism of seizure suppression as compared with electrical HFS that activates both excitatory and inhibitory neurons.
Materials and methods
Animals
Thy1-ChR2-YFP transgenic mice were used in this study. In the in vitro experiments, mice were used at the age of approximately postnatal day 14 (P14, range P11 to P16). In the in vivo experiments, adult mice were used at age P90 to P110. All experimental protocols were reviewed and approved by the Institution Animal Care and Use Committee at Case Western Reserve University.
In vitro preparation for hippocampal recordings
Transgenic and wildtype mice were anesthetized by isoflurane inhalation and decapitated. 350μm transverse hippocampal slices were prepared in a bath recording chamber containing normal-aCSF (n-aCSF) solution with (in mM): NaCl, 125; KCl, 2.5; NaH2PO4, 1.25; D-glucose, 25; NaHCO3, 25; MgCl2, 4; CaCl2, 1 and superfused with bubbled n-aCSF heated to 32ºC. Borosilicate glass recording electrodes were pulled to a resistance of 5 MΩ to measure field potentials (150mM NaCl pipette filling solution) or 90-120 MΩ for intracellular recording electrodes (4M K-Acetate filling solution). Recordings were amplified using the Axopatch 200B Patch Clamp Amplifier (gain = 100, Molecular Devices) and IE-210 Intracellular Electrometer high impedance amplifiers (gain = 10, Warner Instruments) and low-pass filtered at 2 kHz. Signals were then digitized at 10 kHz (Digidata 1440A, Molecular Devices) and stored for off-line analysis.
In vivo preparation for hippocampal recordings
Transgenic mice were anesthetized for the duration of the experiment. Anesthesia was induced by delivering 4% isoflurane in a carbogen gas mixture (95% O2 / 5% CO2) via a mask as mice and maintained at 2% of isoflurane before seizure was induced. Two tungsten electrodes (A-M systems) were inserted into CA3 of the hippocampus bilaterally (bregma −1.7mm, lateral ±2.0mm, depth 2.1mm). Screw electrodes (E363/20, Plastics One) were fixed in the parietal area as the reference electrode and the frontal area as the ground. In some experiments, one additional tungsten electrode was inserted in the CA3 area of the ventral hippocampus (bregma −3.1mm, lateral −2.5mm, depth 4.1mm) to monitor activity along longitudinal pathways. Neural activity was recorded and amplified by 1000 times by a 4-channel amplifier (Model 1700, A-M systems) at a bandwidth of 1 Hz to 5 kHz. Signal were digitized with a sampling rate of 20 kHz by the ML795 PowerLab/16SP data acquisition system (AD Instruments Inc.) and stored for the offline analysis.
Seizure induction in animal models
For in vitro experiments, hippocampal slices were immersed in aCSF with 100 ⍰M 4-aminopyridine (4-AP) to induce epileptiform activity. In addition, 100 μM picrotoxin (PCTXN, Sigma) was also included in a subset of experiments to block the effects of GABAA in the suppression of activity from optical stimulation.
In the in vivo experiments, seizure activity was induced by bolus injection of 4-AP in order to clearly define the seizure focus. A 1 μL volume of 40 mM 4-AP was injected directly into the left CA3 area (bregma −1.8mm, lateral −2.0mm, depth 2.1mm), near the ipsilateral recording electrode. Additional injections were administered every 10 minutes until seizures propagated throughout the hippocampus and became continuous. The average dose was 3.2±1.1 ⍰L in ten transgenic mice.
Optical stimulation parameters
In the in vitro experiments, optical pulse trains at 20 Hz with 10ms pulse width were delivered by using a fiber-coupled 473 nm laser (100 mW DPSS, OEM laser Systems). A cleaved optical fiber with 200 μm diameter was placed directly over the hippocampal slice, and the position of the stimulus area was visually adjusted using the microscope and camera to obtain optimal coverage of the CA3 area. Pulse trains were applied for either 15 s to observe acute effects of optical stimulation.
In the in vivo experiments, the optical fiber was inserted into the brain at a location immediately above the area of 4-AP injection. Optical stimulation was applied with 5 ms pulses at 20 Hz and 50 Hz frequencies. In addition to varying the frequency, 5 different power levels were investigated (15%, 35%, 60%, 80%, and 100% of the maximum laser power) to study the effect of stimulus intensity. Optical stimulation duration was either 5 seconds or 20 seconds for single stimulus trials, and 5 seconds for intermittent stimulation experiments. The interrupted time between 5 sec stimulus bursts was varied from 1 second to 5 seconds with 1 sec increment.
For both in vitro and in vivo experiments, the maximum laser power was used for all stimulation protocols. The average power out of the fiber was measured by a optical power meter (PM100D, Thorlabs) at approximately 80 mW/mm2 during 20 Hz optical pulse trains and 245 mW/mm2 during 50 Hz pulse trains.
Histology
After performing the in vitro recording, brain slices were fixed in 4% paraformaldehyde (PFA) overnight and transferred to glass slides using a mounting media (VECTASHIELD, Vector Lab, Burlingame, CA) for confocal observation. Z-stacked images were captured on a Zeiss LSM 510 META laser scanning microscope. YFP-expressing cells were counted within a 500μm × 500μm fixed area in the CA3 hippocampus and categorized as either pyramidal (PYR) or interneuron (GABA) based on cell location and morphology. Cell numbers were calculated based on area × Z depth. To confirm YFP expression in GABA ergic cells, transgenic mice of same age were perfused with ice-cold 4% paraformaldehyde (PFA) under anesthesia. Brains were then removed, post-fixed in 4% PFA at 4°C overnight, and cryoprotected in 30% sucrose in phosphate-buffered saline (PBS) for 2 days before being flash-frozen in 2-methylbutane on dry ice and stored at −80°C. Brains were then sectioned (40μm) and slices stained for GAD-67 (rabbit, Santa Cruz, 1:1000 dilution) at 4°C overnight. After PBS washing, sections were then incubated with secondary antibodies conjugated to Cy3 (donkey α-rabbit 1:700, Jackson ImmunoResearch, West Grove, PA)
Data analysis and statistical analysis
To quantify the seizure suppression in the in vivo experiments, the seizure suppression ratio (SR) was defined the percentage reduction of neural activity power during stimulation as compared to before stimulation as follows:
where Pbaseline and Pstim were the neural activity power before stimulation and during stimulation, respectively. Therefore, SR of 100 indicates a reduction of activity power to zero during stimulation. The power was calculated by the following equation:
where x[k] is the signal and N is the length of the activity.
To quantify the effects of optical stimulation on in vitro slices, spontaneous burst frequency (number of events/second) was used instead of signal power. The spontaneous burst frequencies before, during, and after optical stimulation were calculated to compare.
One-way ANOVA test was used to compare seizure suppression by optical stimulation with different laser power levels, and the Duncan post-hoc test was used to compare the effect of optical pulse trains on epileptiform activity. A p-value of less than 0.05 was considered statistically significant. All data were represented as mean±SEM.
Results
Optically-evoked potentials in the hippocampus
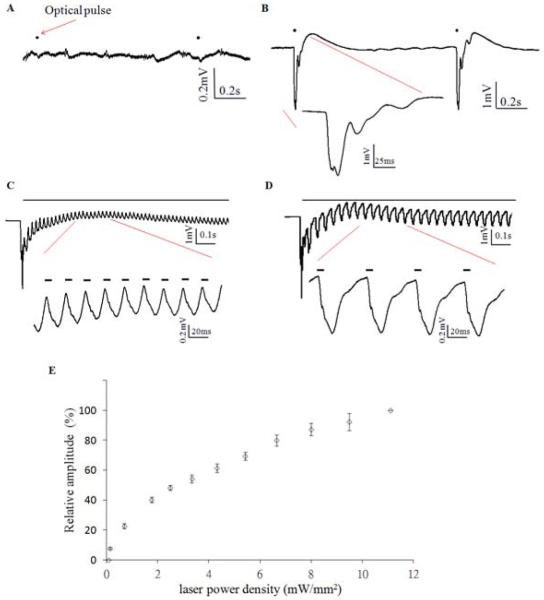
To understand the optical response in the normal condition, the laser light was first applied on wild type and Thy1-ChR2 mice without seizure induction. Optical stimulation in-vivo in wild type mice did not induce any activity (Figure1A). However, stimulation in Thy1-ChR2 mice could elicit a hippocampal evoked potentials in the in vivo preparation for stimulation for 1, 20, and 50 Hz trains (Figure 1B, C, D). The field potential responses to optical stimulation were biphasic, with a steep negative evoked potential corresponding to the 1 Hz optical pulse followed by a delayed positive potential after stimulation. 20 Hz and 50 Hz optical stimulation resulted in a quasi-sinusoidal waveform. While the initial optical pulse elicited a large negative evoked potential at the onset of each pulse train, the amplitude of the tissue response would rapidly decrease with subsequent pulses (Figure 1C,D), stabilizing into a regular and optically-dependent pattern with lower amplitudes. Figure 1E shows the amplitude of optically-evoked potential increased with increasing laser power but no saturation was observed within the power available for the laser.
Figure 1.
Optical response to 473 nm blue laser in wildtype and thy1-ChR2 transgenic mice. A. In vivo neural activity trace in response to 1 Hz optical pulse train (black dot) in wildtype mice. B. Optically evoked potential induced by 1 Hz optical pulse train (black dot) in thy1-ChR2 transgenic mice. C. Optical response to 20 Hz optical stimulation (black line). Magnification shows the trace responding to the optical pulse (bold line). D. Optical response to 50 Hz optical stimulation. E. Relationship optically evoked potential (relative amplitude) and laser power density in 1 Hz stimulation.
Optical HFS can suppress in vivo seizures
Six mice (18 stimulation trials in each stimulation parameters) were used to study the relationship between laser power and seizure suppression. Figure 2A shows an example of 50 Hz optical stimulation suppressing 4-AP induced electrographic seizure activity. To clearly identify the effects of optical stimulation, the optically evoked potentials were removed by means of a filter since the evoked potentials induced by 20 and 50 Hz stimulation were quasi-sinusoidal waveforms. Seizure activity was suppressed bilaterally during the 5-second stimulation trial. A similar phenomenon was observed with 20 Hz optical stimulation (Figure 2B). Five different levels of applied laser power were studied to search for the optimal parameter for seizure suppression. Figure 2C shows the relationship between suppression percentage and laser power during 50 Hz stimulation. The suppression percentage in the ipsilateral site increased with power level but reached a maximum when laser power was 80% of maximum value (p<0.01, one-way ANOVA, n=6). The suppression percentages on the contralateral side were consistently smaller than those in the ipsilateral CA3 but also reached maximum suppression at 80% of the maximum laser power (p<0.05, one way ANOVA, n=6). The maximum suppression percentages from 50 Hz stimulation were 82.4±14.8% in the ipsilateral CA3 and 66.7±22.0% in the contralateral CA3. Suppression from 20 Hz optical stimulation (Figure 2D) showed the similar trend and was maximal at the same applied power levels on the ipsilateral side (p<0.05, one-way ANOVA, n=6), but differences between power levels on the contralateral side were not statistically significant. The maximum suppression percentages for 20 Hz stimulation were 80.2±10.9% in the ipsilateral CA3 and 61.2±22.4% in the contralateral CA3.
Figure 2.
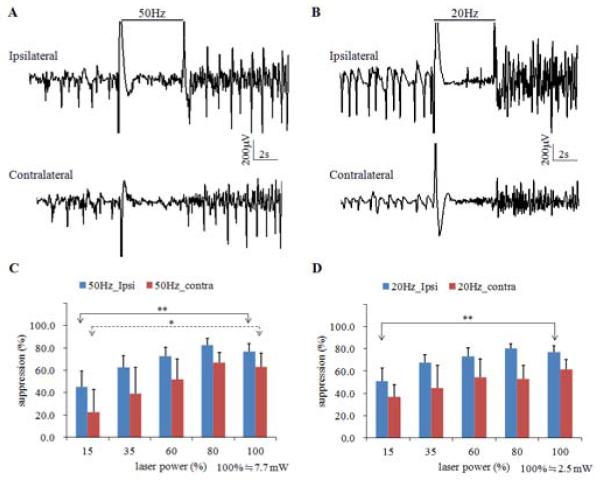
4-AP induced seizure suppressed by optical high frequency stimulation at 50 Hz (A) and 20 Hz (B). A. 50 Hz optical high frequency stimulation with 5-second duration causes bilateral seizure suppression in CA3. B. 20 Hz optical high frequency stimulation with 5-second duration causes bilateral seizure suppression in CA3. C. Suppression percentage versus power level for 50 Hz stimulation. D. Suppression percentage versus power level for 20 Hz stimulation. *, significant difference among power levels, P<0.05. **, p<0.01.
Suppression by optical HFS occurs bilaterally and longitudinal
To determine the spatial extents of the effects of optical high frequency stimulation, 4 mice (8 trials) were stimulated for 5s at 50 Hz at maximum power while simultaneously recording in the ipsilateral temporal CA3 area in addition to the bilaterally septal CA3 areas (Figure 3A). Before stimulation, synchronized seizure activity was present in all three recording sites. Seizure suppression from optical stimulation occurred in all three areas. In addition to the suppression at the seizure focus, stimulation could suppress hyper-activity in the contralateral site and the ipsilateral-longitudinal site, indicating the spatial extent of the optical stimulus was sufficient to prevent the propagation of epileptiform activity. The signal power in all three sites was significantly reduced (Figure 3B, p<0.01, paired t-test). Furthermore, the suppression percentage at the focus was 74.6±4.5%, which was the highest among the three recording sites (suppression percentage was 55.1±10.2% and 49.1±7.6% from the contralateral and ipsilateral-longitudinal sites, respectively). These results show that optical stimulation applied at a single location can affect distal sites both ipsi- and contra-laterally.
Figure 3.
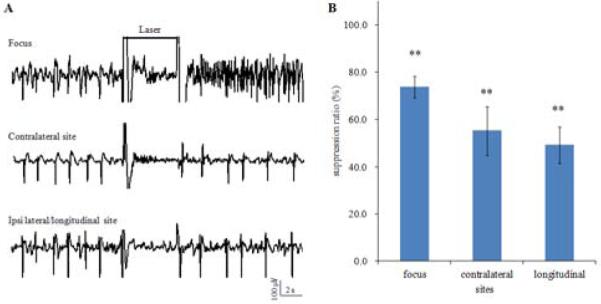
Spatial extent of the optically induced suppression. A. Example of neural activity recordings in the focus, contralateral site, and ipsilateral-longitudinal site showing global suppression by 50 Hz optical stimulation with duration of 5 s(black line). B. Suppression percentages at the focus, contralateral site, and ipsilateral-longitudinal site. **, significant reduction of signal power, p<0.01.
Effects of long-duration HFS on seizures
To study the long-term effects of optical HFS, the stimulation was applied for 20 seconds in six mice (18 trials). There were three typical effects on seizures, depicted in Figure 4A-C. Optical stimulation would always initially cause seizure suppression, which could continue throughout the entire stimulus period (Figure 4A). Often, though breakthrough activity occurred in the latter portion of stimulation period, causing the suppression percentage to decrease (Figure 4B). In some instances, the breakthrough activity was low amplitude but high frequency, causing an increase in the measured signal power compared to baseline that led to the calculation of a negative suppression percentage (Figure 4C). These phenomena were observed with both 50 Hz stimulation and 20 Hz stimulation.
Figure 4.
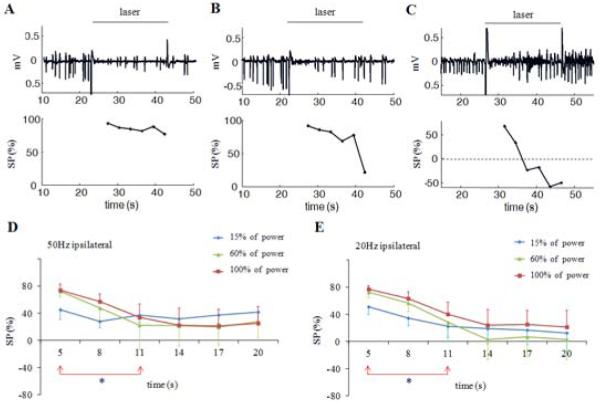
Effects of high frequency stimulation with duration of 20 seconds. A. 50 Hz stimulation causes similar suppression percentages along with time. B. Suppression percentage drops in the latter portion of stimulation period. C. Suppression percentage drops and becomes negative in the latter portion of stimulation because high frequency activity is induced. D and E. Suppression percentages at 50 and 20 Hz stimulation with high and medium power levels drop within 11 seconds and remain low. *, significant difference among different time intervals, p<0.05.
The effect of prolonged stimulation as a function of stimulation power was also investigated (Figure 4D, E). Stimulation at 50 Hz with low power (15% of maximum power) caused approximately 40% suppression that could be sustained throughout the stimulus period. However, stimulation with medium power or high power (60% and 100%) lead to greater seizure suppression (73%), but decreased within 11 seconds and remained low for the duration of the stimulus period (p<0.05, one-way ANOVA). Similarly, 20 Hz stimulation with medium and high power could not sustain suppression for 20 seconds, with suppression rates decreasing with time (p<0.05, one-way ANOVA).
Effects of intermittent HFS on seizures
Given that seizure suppression efficacy was initially high but decreased after 5 s of continuous stimulation, we used an intermittent stimulation paradigm to determine the necessary recovery time to achieve consistently high suppression. Four mice were stimulated with a series of three 5-second bursts at 50 Hz and the interrupted time between bursts was varied (Figure 5A). In contrast to continuous optical stimulation, the suppressive effects in the second and third stimulation periods were increased by the intermittent stimulation (p<0.05, one-way ANOVA). The suppressive effect in second stimulation period was significantly higher with intermittent stimulation compared to continuous stimulation when the interrupted time was at least 5 s in Figure 5B (p<0.05, Duncan test). Similarly, suppressive effects in third stimulation could be improved significantly by intermittent stimulation when the interrupted time was larger than 3 s in Figure 5C (p<0.05, Duncan test).
Figure 5.
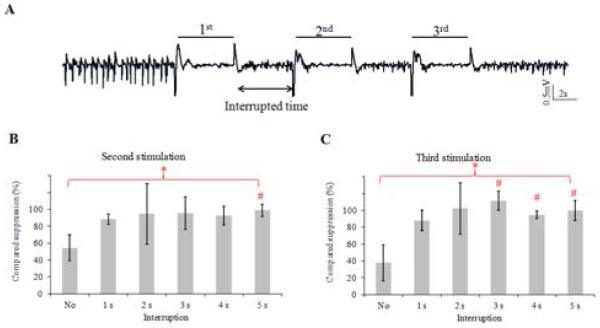
Intermittent stimulation pattern. A. Example of seizure suppression by intermittent stimulation with 50 Hz bursts. Three 50 Hz bursts with 5-second duration were applied to study the effect of second and third burst periods compared to that of the first burst period when the interrupted time increases. B. Suppression percentages calculated from the second burst stimulation period compared to that from the first period with increase of interrupted time. 100 % of compared suppression means that second stimulation induced suppression percentage as the same level as the first stimulation. C. Suppression percentages calculated from the third burst stimulation period. *Overall one way ANOVA, p<0.05. # compared to the no-interruption group, Duncan test, p<0.05.
ChR2-YFP expression in the Thy1-ChR2 transgenic mouse
To understand the mechanisms of the effects of optical stimulation in the hippocampus, we sought to determine which cell type were expressing ChR2 in Thy1-ChR2 mouse brains. Low magnification imaging of the endogenous fluorescence from the ChR2-YFP conjugated protein in a transverse hippocampal section revealed that ChR2-YFP expression was high in the subiculum but low in the CA1 and CA3 pyramidal cell soma and dendritic areas (Figure 6A). Further, we observed no expression in the dentate gyrus at this age. Closer inspection of ChR2-YFP expressing cells in the CA3 region indicated that while some cells appeared to be pyramidal, the majority of YFP-positive cells morphologically appeared to be hippocampal interneurons (Figure 6C, D).
Figure 6.
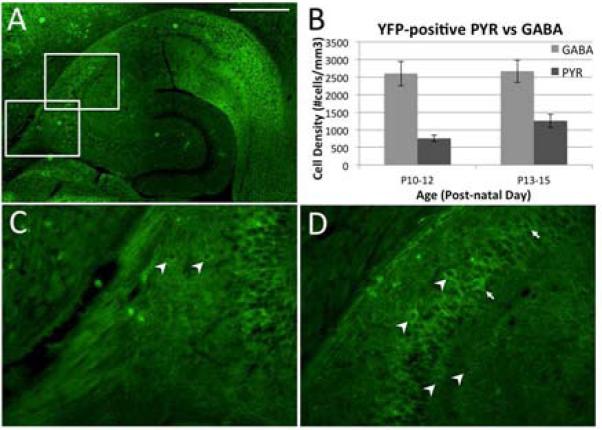
ChR2-YFP distribution in the hippocampus at age P14 in the Thy1-ChR2-YFP transgenic mouse. A. Transverse hippocampal section showing high expression in the subiculum, lower expression in the CA3/CA1 regions, and lack of expression in the dentate gyrus. Higher magnification of the areas indicated in A are shown in panels C and D. Arrowheads identify YFP-expressing cells that appear to be interneurons, while arrows (D only) indicate a minority of cells that appear to be YFP-positive pyramidal neurons. B. Comparison of the number of YFP-positive cells and for the PYR and GABA cell types across the age range used for in vitro studies. While the number of PYR cells expressing ChR2-YFP increased with age, the numbers of YFP positive PYR cells was still smaller compared with that of YFP positive GABA neurons. Similar expression pattern was found in mice even at age P100 that were used for in vivo experiments (data not shown). Scale bar, 500μm.
Using cell position and morphology to classify YFP-expressing cells as either pyramidal cells (PYR) or interneurons (GABA), we used confocal microscopy to analyze 350 μm hippocampal slices from Thy1-ChR-YFP transgenic mice used in in vitro slice experiments. We counted cells and estimated the density of each cell type in the CA3 region (Figure 6B). YFP-positive cells that morphologically appeared to be principal cells were low in number at the earlier ages tested (755±92 cells/mm3 from P10-12, n=5) but roughly doubled only a few days later (1257±191 cells/mm3 from P13-15, n=6). This represented about 23 % at P10-12 and 33 % at P13-15 of the YFP positive total cell numbers. Conversely, the number of YFP positive cells that morphologically appeared to be interneurons was always greater than pyramidal cells (2601±349 cells/mm3 from P10-12, 2669±321 cells/mm3 from P13-15). This represented about 77 % at P10-12 and 67% at P13-15 of the total YFP positive cell numbers. A pattern of expression as the one for P13-15 was observed in older animals (P90-110), indicating that ChR2-YFP was never highly expressed in hippocampal pyramidal cells (data not shown). These data suggest that the suppression effect was dominantly generated by optical stimulation of inhibitory interneurons. This level of expression of YFP by GABA inter-neurons was confirmed using GAD-67 antibodies in hippocampal slices from ChR2-YFP transgenic mice. In these staining, neurons that expressed GABA without expressing YFP was very small (about 5%).
Effects of optical stimulation on cellular integrity of CA3 neurons
During the cell counting procedure, the tissue in the area of stimulation by the optic fiber was examined and found no evidence of cellular damage or reduction of cell number in this area. Similarly, careful observations of the brain slices obtained after the in vivo optical stimulation in 5 animals, showed no signs of cellular damage, inflammation or cell loss around the optic fiber.
Reduction of in vitro epileptiform activity by optical HFS
We then used in vitro hippocampal slices to study the effect of optical stimulation in the Thy1-ChR2 hippocampus in more details, since we could better control the location of the optical stimulus and simultaneously monitor the CA3 and CA1 regions. 20 Hz optical stimulation could reduce the spontaneous spike frequency of in vitro epileptiform activity caused by bath application of 100μM 4-AP (Figure 7A). Blue light was applied to the CA3 area for 15 seconds. The field potential recordings in CA3 show that 20 Hz stimulation initially caused small amplitude, high frequency activity in the baseline but suppression afterwards. Epileptiform activity was simultaneously suppressed in CA1 without the increase in baseline activity. The suppression effect in CA3 and CA1 persisted after stimulation ended. Considering spontaneous burst frequency as the index of suppression, epileptiform activity was significantly suppressed (p<0.01, one-way ANOVA, n=24 trials in 8 mice) during the stimulation compared to before stimulation (p<0.01, post-hoc Tukey HSD) and remained suppressed until 15 seconds after stimulation (p<0.05, post-hoc Tukey HSD). The burst frequency resumed to baseline levels within 45 seconds after stimulation.
Figure 7.
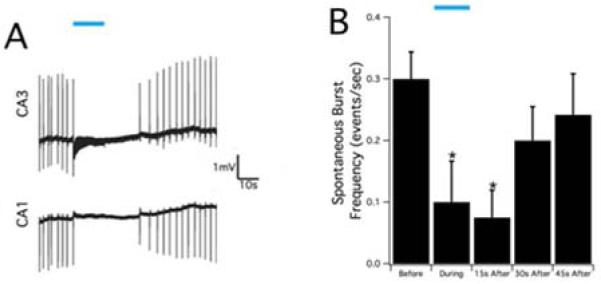
Suppression of epileptiform activity by blue laser in the in-vitro hippocampal slice. A. Optical stimulation, indicated by blue bar, was applied at 20 Hz in the CA3 region of the hippocampal slice and the epileptiform activity was suppressed both in the CA1 and CA3 regions. B. The summary of spontaneous burst frequency in the CA3 region before, during, and after optical stimulation. Optical stimulation could cause significant reduction during and 15s after stimulation (p<0.05) and then the burst frequency gradually return to the baseline level.
Suppression of activity is mediated by GABAA receptors
Since ChR2-YFP appeared to be predominantly expressed in hippocampal interneurons and not pyramidal cells, it is likely that interneuron-mediated mechanisms were responsible for the observed optical suppression effect. We inhibited GABAA signaling to determine if this receptor was involved. Hippocampal slices were superfused with aCSF containing 4-AP and 100μM picrotoxin (PCTXN) to block GABAA channels, producing a spontaneous epileptiform activity that typically had a reduced frequency and longer bursting compared to 4-AP alone. We found that 20 Hz optical stimulation applied to the CA3 region for 5 minutes under these conditions was unable to suppress this epileptiform activity. Spike frequency was calculated before, during, and after optical stimulation, and there were no significant differences between these three intervals (Figure 8, p=0.95, one-way ANOVA, n=8).
Figure 8.
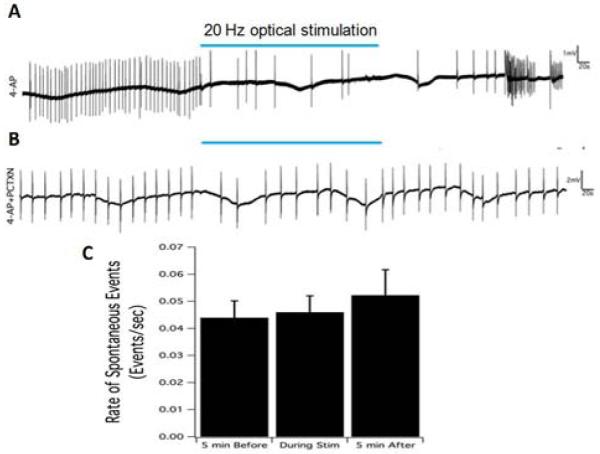
A. Suppression of epileptiform activity by 5-minutes optical stimulation. 20 Hz optical stimulation, indicated by blue bar, could the reduction of burst frequency induced by 100 ⍰M 4-AP solution. B. Optical stimulation had no effect on the spontaneous activity induce by 4-AP plus 100 ⍰M picrotoxin (PCTX). C. The summary of spontaneous activity frequency before, during, and after stimulation. There was no significant change caused by optical stimulation when the GABAA receptors were blocked by picrotoxin solution.
Discussion
Epilepsy has been thought to result from hyper excitability spreading to an increasing number of neurons in the neural network (23). Therefore, optogenetic strategies are commonly aimed at inhibiting the excitatory neurons using a NpHR contruct or at activating inhibitory neurons by means of ChR2 expression. Previous studies have supported these strategies and showed effective seizure suppression in different parts of the brain (18-21). However, a different optogenetic strategy for seizure suppression that mimics electrical HFS protocols by activating neurons can also effective. Electrical HFS has been thought to suppress seizures by generating a depolarization block related to the inactivation of sodium channels (10, 11) or driving GABA release during stimulation (24, 25). In the present study, histological analyses show that mostly interneurons express ChR2 in the Thy1-ChR2 mice and thus GABA release could be enhanced by optical stimulation together with the activation of some pyramidal cells. Therefore, seizure suppression could be due to the recovery of the balance between excitatory and inhibitory circuits known to exist during seizures (26). In addition, it has been estimated that a single GABAergic cell may affect more than a thousand pyramidal cells (27, 28). Therefore, activation of GABAergic neurons may become predominant. This possible outcome is supported by the fact that picrotoxin could abolish seizure suppression caused by high frequency optical stimulation (Figure 8). Therefore, activation of only GABAergic cells could provide an efficient way to suppress seizure activity by the pulse train stimulation. Global activation of various populations of inhibitory interneurons could produce prolonged suppression of epileptiform activity during light stimulation (29). Direct hyperpolarization of the principal cells through chloride channel could be responsible for the suppressive effects (30). However, similar to a previous study (30), longer duration of light exposure for global activation of interneurons reduced the suppressive effects
The present study shows that optical stimulation applied into a discrete area (hippocampus CA3) could affect distal sites both ipsi- and contra-laterally. Because the majority of activated neurons were GABAergic, a possible explanation for distal suppression could be a GABA-mediated propagation block. Excess GABA could reduce excitatory synaptic transmission by decreasing excitatory postsynaptic potentials and glutamate release (31) and even block action potential propagation (32). Suppression of distal seizure could be due to the elimination of activity at the focus preventing from recruitment of new neurons. This could also explain why the suppression index was higher at the focus than other sites (Figure 3B). Another possibility is the existence of long range projection of GABAergic interneurons that could account for distal contralateral inhibition (33) and longitudinal inhibition (34).
Seizure suppression by high frequency optical stimulation (20 or 50 Hz) was not sustained and decreased within 11 seconds and in some case even generate hyperactivity (Figure 4). Since our results suggest that suppression was mediated by GABAA receptors, one possible explanation for the overtime reduction of effect may be that GABAA activation does not result in pyramidal cell inhibition when stimulation was longer than 11 seconds. GABAA receptors mediate synaptic inhibition or activation by shunting the membrane potential to the chloride reversal potential (ECl). Therefore, stimulating GABAA receptors could cause hyperpolarization or depolarization depending on the membrane potential relative to the chloride reversal potential (35). Intense activation of GABAA receptors could induce a shift of ECl and the function of receptors thereby changing from hyperpolarization to depolarization (36-38). This effect has been documented with 10-100 Hz electrical stimulation trains that produce a depolarizing shift in ECl of neurons in the hippocampal CA3 region, due to intracellular chloride accumulation (39). A similar phenomenon was found when the chloride pump NpHR was used to silence neurons. GABAA receptor currents could change from outward currents to strong inward currents following 15-second laser light activation of chloride pump channel (NpHR) (40). On the other hand, GABA depletion might be relevant to ictal onset as it has been suggested that ictal discharge is preceded by exhausted presynaptic GABA release in the hippocampal CA3 region (41) and interneurons would enter long-lasting depolarization block during ictal discharge in the hippocampal CA1 (42). Another possibility is that GABAergic inhibition could be converted into depolarization of principal cells by a change in the reversal potential for chloride thereby reducing the suppressive effects (30, 43). This effect could also explain the evoked potentials generated in response to a single optical pulse.
As the shift of ECl associated with chloride accumulation previously reported was transient with a time constant in the order of seconds for the recovery of chloride concentration to normal level (44), we tested the hypothesis that intermittent stimulation could improve the loss of seizure suppression. With laser pulse train set at 50 Hz and duration of 5 seconds, stimulation needed to be turned off for at least 4 seconds in order to restore the suppressive effect (Figure 7B). However, other researchers have found different time constant for recovery to the baseline after over electrical stimulation or over NpHR activation (39, 40). The variability of recovery time could be due to the levels of chloride accumulation. Similarly, any factor affecting the rate of chloride accumulation would determine how rapidly suppression would be lost. Therefore, intermittent stimulation could improve suppressive effects but the duty cycle must be determined for each experimental condition.
Isoflurane has been shown to depress the excitatory postsynaptic potentials in rats (45) and general anesthesia with 2.5% isoflurane can effectively suppress seizure in high K+ and low Mg2+ models (46). However, 4-AP induced electrographic seizure in our experiment reached a non-stop seizures or status epilepticus stage and, in general, the seizure would be only suppressed during the short period of stimulation to come back quickly after optical pulse trains ended. Status epilepticus was induced by injecting 4-AP until the seizure became continuous. Therefore, under these conditions, anesthesia did not seem to significantly affect the results of suppression.
The light power density associated with 50 Hz stimulation in this study seems high since a previous study showed that there was significant tissue damage around the fiber tip when the sustained stimulation (> 500 ms duration) was at level over 100 mW/mm2 (47). However, the same study also suggests that tissue damage can be minimized using short light pulses rather than continuous illumination (47). The present study used short pulse train with 10 ms duration and tissue damage could be minimized. On the other hand, the light density in this study would attenuate to less than 100 mW/mm2 within 0.1 mm according to Kubelka-Munk model (48). This procedure greatly reduces the likelihood of compromising the integrity of the neural tissue. In support of this idea, careful histological observations of the tissue around the optical fiber from ChR2-YFP transgenic animals that were subject to optical stimulation revealed no signs of inflammation, cell damage or cell loss. In any case, since our results show that the level of seizure suppression at 20 Hz and at 50 Hz were similar, the 20 Hz stimulation frequency could be a better strategy to prevent any potential tissue damage in the procedure.
Conclusion
In this study, HFS was applied through an optogenic construct to suppress epileptiform activity in vivo and in vitro reaching maximum suppression ratios of 70 and 82.4 %, respectively. The local suppressive effect in CA3 spreads contralaterally and longitudinally across the whole hippocampus from a single site of excitation. Histological and electrophysiological experiments show that this suppression was mediated through GABAA receptors. Furthermore, we show that on/off intermittent stimulation could improve the suppression by optical HFS during longer time periods. Overall, these experiments show that optogenetic stimulation is a promising therapeutic technique for fast suppression of seizures and a powerful tool for mechanistic studies associated with epilepsy.
High Frequency optogenetic stimulation induces acute seizure suppression.
Optical stimulation suppresses focal and distal epileptiform activity.
Seizure suppression decreases over time but can be reinstated by intermittent stimulation.
GABA transmission activated by optical stimulation is implicated in seizure suppression.
Acknowledgment
This research was supported by the National Institutes of Health (NINDS grant # : 2R01NS060757-05A1).
Footnotes
Publisher's Disclaimer: This is a PDF file of an unedited manuscript that has been accepted for publication. As a service to our customers we are providing this early version of the manuscript. The manuscript will undergo copyediting, typesetting, and review of the resulting proof before it is published in its final citable form. Please note that during the production process errors may be discovered which could affect the content, and all legal disclaimers that apply to the journal pertain.
References
- 1.Shinnar S, O'Dell C, Berg AT. Distribution of epilepsy syndromes in a cohort of children prospectively monitored from the time of their first unprovoked seizure. Epilepsia. 1999 Oct;40(10):1378–83. doi: 10.1111/j.1528-1157.1999.tb02008.x. [DOI] [PubMed] [Google Scholar]
- 2.Wieser HG. Mesial temporal lobe epilepsy with hippocampal sclerosis: Report of the commission on Neurosurgery. Epilepsia. 2004;45(6):695–714. doi: 10.1111/j.0013-9580.2004.09004.x. [DOI] [PubMed] [Google Scholar]
- 3.Rajdev P, Ward M, Irazoqui P. Effect of Stimulus Parameters in the Treatment of Seizures by Electrical Stimulation in the Kainate Animal Model. Int J Neural Syst. 2011;21(02):151–62. doi: 10.1142/S0129065711002730. [DOI] [PubMed] [Google Scholar]
- 4.Wyckhuys T, Raedt R, Vonck K, Wadman W, Boon P. Comparison of hippocampal deep brain stimulation with high (130Hz) and low frequency (5Hz) on afterdischarges in kindled rats. Epilepsy Res. 2010;88(2-3):239–46. doi: 10.1016/j.eplepsyres.2009.11.014. [DOI] [PubMed] [Google Scholar]
- 5.Chiang C-C, Lin C-CK, Ju M-S, Durand DM. High frequency stimulation can suppress globally seizures induced by 4-AP in the rat hippocampus: An acute in vivo study. Brain Stimulat. 2013;6(2):180–9. doi: 10.1016/j.brs.2012.04.008. [DOI] [PMC free article] [PubMed] [Google Scholar]
- 6.Velasco AL, Velasco F, Velasco M, Trejo D, Castro G, Carrillo-Ruiz JD. Electrical stimulation of the hippocampal epileptic foci for seizure control: a double-blind, long-term follow-up study. Epilepsia. 2007;48(10):1895–903. doi: 10.1111/j.1528-1167.2007.01181.x. [DOI] [PubMed] [Google Scholar]
- 7.Boon P, Vonck K, De Herdt V, Van Dycke A, Goethals M, Goossens L, et al. Deep brain stimulation in patients with refractory temporal lobe epilepsy. Epilepsia. 2007;48(8):1551–60. doi: 10.1111/j.1528-1167.2007.01005.x. [DOI] [PubMed] [Google Scholar]
- 8.Tellez-Zenteno JF, McLachlan RS, Parrent A, Kubu CS, Wiebe S. Hippocampal electrical stimulation in mesial temporal lobe epilepsy. Neurology. 2006 May;66(10):1490–4. doi: 10.1212/01.wnl.0000209300.49308.8f. [DOI] [PubMed] [Google Scholar]
- 9.Lian J, Bikson M, Sciortino C, Stacey WC, Durand DM. Local suppression of epileptiform activity by electrical stimulation in rat hippocampus in vitro. J Physiol. 2003;547:427–34. doi: 10.1113/jphysiol.2002.033209. [DOI] [PMC free article] [PubMed] [Google Scholar]
- 10.McIntyre CC, Grill WM, Sherman DL, Thakor NV. Cellular effects of deep brain stimulation: model-based analysis of activation and inhibition. J Neurophysiol. 2004;91:1457–69. doi: 10.1152/jn.00989.2003. [DOI] [PubMed] [Google Scholar]
- 11.Beurrier C, Bioulac B, Audin J, Hammond C. High-frequency stimulation produces a transient blockade of voltage-gated currents in subthalamic neurons. J Neurophysiol. 2001;85:1351–6. doi: 10.1152/jn.2001.85.4.1351. [DOI] [PubMed] [Google Scholar]
- 12.Schiller Y, Bankirer Y. Cellular Mechanisms Underlying Antiepileptic Effects of Low- and High-Frequency Electrical Stimulation in Acute Epilepsy in Neocortical Brain Slices In Vitro. J Neurophysiol. 2007;97(3):1887–902. doi: 10.1152/jn.00514.2006. [DOI] [PubMed] [Google Scholar]
- 13.Boyden ES, Zhang F, Bamberg E, Nagel G, Deisseroth K. Millisecond-timescale, genetically targeted optical control of neural activity. Nat Neurosci. 2005;8(9):1263–8. doi: 10.1038/nn1525. [DOI] [PubMed] [Google Scholar]
- 14.Nagel G. Channelrhodopsin-2, a directly light-gated cation-selective membrane channel. Proceedings of the National Academy of Sciences. 2003;100(24):13940–5. doi: 10.1073/pnas.1936192100. [DOI] [PMC free article] [PubMed] [Google Scholar]
- 15.Schobert B, Lanyi JK. Halorhodopsin is a light-driven cholride pump. J Biol Chem. 1982;257(17):306–13. [PubMed] [Google Scholar]
- 16.Zhang F, Wang L-P, Brauner M, Liewald JF, Kay K, Watzke N, et al. Multimodal fast optical interrogation of neural circuitry. Nature. 2007;446(7136):633–9. doi: 10.1038/nature05744. [DOI] [PubMed] [Google Scholar]
- 17.Kokaia M, Andersson M, Ledri M. An optogenetic approach in epilepsy. Neuropharmacology. 2013;69:89–95. doi: 10.1016/j.neuropharm.2012.05.049. [DOI] [PubMed] [Google Scholar]
- 18.Tonnesen J, Sorensen AT, Deisseroth K, Lundberg C, Kokaia M. Optogenetic control of epileptiform activity. Proceedings of the National Academy of Sciences. 2009;106(29):12162–7. doi: 10.1073/pnas.0901915106. [DOI] [PMC free article] [PubMed] [Google Scholar]
- 19.Wykes RC, Heeroma JH, Mantoan L, Zheng K, MacDonald DC, Deisseroth K, et al. Optogenetic and Potassium Channel Gene Therapy in a Rodent Model of Focal Neocortical Epilepsy. Sci Transl Med. 2012;4(161):161ra52–ra52. doi: 10.1126/scitranslmed.3004190. [DOI] [PMC free article] [PubMed] [Google Scholar]
- 20.Paz JT, Davidson TJ, Frechette ES, Delord B, Parada I, Peng K, et al. Closed-loop optogenetic control of thalamus as a tool for interrupting seizures after cortical injury. Nat Neurosci. 2012 doi: 10.1038/nn.3269. [DOI] [PMC free article] [PubMed] [Google Scholar]
- 21.Krook-Magnuson E, Armstrong C, Oijala M, Soltesz I. On-demand optogenetic control of spontaneous seizures in temporal lobe epilepsy. Nat Commun. 2013;4:1376. doi: 10.1038/ncomms2376. [DOI] [PMC free article] [PubMed] [Google Scholar]
- 22.Arenkiel BR, Peca J, Davison IG, Feliciano C, Deisseroth K, Augustine George J, et al. In Vivo Light-Induced Activation of Neural Circuitry in Transgenic Mice Expressing Channelrhodopsin-2. Neuron. 2007;54(2):205–18. doi: 10.1016/j.neuron.2007.03.005. [DOI] [PMC free article] [PubMed] [Google Scholar]
- 23.Noebels JL, Avoli M, Rogawski MA, Olsen RW, Delgado-Escueta AV. Jasper's Basic Mechanisms of the Epilepsies. 4. National Center for Biotechnology Information; Bethesda: 2012. [PubMed] [Google Scholar]
- 24.Luna-Munguía H, Meneses A, Peña-Ortega F, Gaona A, Rocha L. Effects of hippocampal high-frequency electrical stimulation in memory formation and their association with amino acid tissue content and release in normal rats. Hippocampus. 2012;22(1):98–105. doi: 10.1002/hipo.20868. [DOI] [PubMed] [Google Scholar]
- 25.Luna-Munguia H, Orozco-Suarez S, Rocha L. Effects of high frequency electrical stimulation and R-verapamil on seizure susceptibility and glutamate and GABA release in a model of phenytoin-resistant seizures. Neuropharmacology. 2011;61(4):807–14. doi: 10.1016/j.neuropharm.2011.05.027. [DOI] [PubMed] [Google Scholar]
- 26.Chang BS, Lowenstein DH. Mechanisms of disease - Epilepsy. N Engl J Med. 2003 Sep;349(13):1257–66. doi: 10.1056/NEJMra022308. [DOI] [PubMed] [Google Scholar]
- 27.Li XG, Somogyi P, Ylinen A, Buzsaki G. The hippocampal CA3 network- an in-vivo intracellular labeling study. J Comp Neurol. 1994 Jan;339(2):181–208. doi: 10.1002/cne.903390204. [DOI] [PubMed] [Google Scholar]
- 28.Sik A, Penttonen M, Ylinen A, Buzsaki G. Hippocampal CA1 interneurons- an in-vivo intracellular labelling study. J Neurosci. 1995 Oct;15(10):6651–65. doi: 10.1523/JNEUROSCI.15-10-06651.1995. [DOI] [PMC free article] [PubMed] [Google Scholar]
- 29.Ledri M, Madsen MG, Nikitidou L, Kirik D, Kokaia M. Global optogenetic activation of inhibitory interneurons during epileptiform activity. J Neurosci. 2014;34(9):3364–77. doi: 10.1523/JNEUROSCI.2734-13.2014. [DOI] [PMC free article] [PubMed] [Google Scholar]
- 30.Berglind F, Ledri M, Sørensen AT, Nikitidou L, Melis M, Bielefeld P, et al. Optogenetic inhibition of chemically induced hypersynchronized bursting in mice. Neurobiol Dis. 2014;65:133–41. doi: 10.1016/j.nbd.2014.01.015. [DOI] [PubMed] [Google Scholar]
- 31.Ruiz A, Fabian-Fine R, Scott R, Walker MC, Rusakov DA, Kullmann DM. GABA(A) receptors at hippocampal mossy fibers. Neuron. 2003 Sep;39(6):961–73. doi: 10.1016/s0896-6273(03)00559-2. [DOI] [PMC free article] [PubMed] [Google Scholar]
- 32.Jackson MB, Zhang SLJ. Action potential propagation and propagation block by GABA in rat posterior pituitary nerve terminals. Journal of Physiology-London. 1995 Mar;483(3):597–611. doi: 10.1113/jphysiol.1995.sp020609. [DOI] [PMC free article] [PubMed] [Google Scholar]
- 33.Zappone CA, Sloviter RS. Commissurally projecting inhibitory interneurons of the rat hippocampal dentate gyrus: A colocalization study of neuronal markers and the retrograde tracer fluoro-gold. The Journal of Comparative Neurology. 2001;441(4):324–44. doi: 10.1002/cne.1415. [DOI] [PubMed] [Google Scholar]
- 34.Gloveli T, Dugladze T, Rotstein HG, Traub RD, Monyer H, Heinemann U, et al. Orthogonal arrangement of rhythm-generating microcircuits in the hippocampus. Proceedings of the National Academy of Sciences. 2005;102(37):13295–300. doi: 10.1073/pnas.0506259102. [DOI] [PMC free article] [PubMed] [Google Scholar]
- 35.Wright R, Raimondo JV, Akerman CJ. Spatial and Temporal Dynamics in the Ionic Driving Force for GABAA Receptors. Neural Plast. 2011:1–10. doi: 10.1155/2011/728395. 2011. [DOI] [PMC free article] [PubMed] [Google Scholar]
- 36.Andersen P, Dingledine R, Gjerstad L, Langmoen IA, Laursen AM. 2 DIFFERENT RESPONSES OF HIPPOCAMPAL PYRAMIDAL CELLS TO APPLICATION OF GAMMA-AMINO BUTYRIC-ACID. Journal of Physiology-London. 1980 Aug;305:279–96. doi: 10.1113/jphysiol.1980.sp013363. [DOI] [PMC free article] [PubMed] [Google Scholar]
- 37.Alger BE, Nicoll RA. GABA-MEDIATED BIPHASIC INHIBITORY RESPONSES IN HIPPOCAMPUS. Nature. 1979;281(5729):315–7. doi: 10.1038/281315a0. [DOI] [PubMed] [Google Scholar]
- 38.Thompson SM, Gahwiler BH. Activity-dependent disinhibition. II. effects of extracellular potassium, furosemide, and membrane potential on ECL- in hippocampal CA3 neurons. J Neurophysiol. 1989 Mar;61(3):512–23. doi: 10.1152/jn.1989.61.3.512. [DOI] [PubMed] [Google Scholar]
- 39.Lamsa K, Taira T. Use-dependent shift from inhibitory to excitatory GABA(A) receptor action in SP-O interneurons in the rat hippocampal CA3 area. J Neurophysiol. 2003 Sep;90(3):1983–95. doi: 10.1152/jn.00060.2003. [DOI] [PubMed] [Google Scholar]
- 40.Raimondo JV, Kay L, Ellender TJ, Akerman CJ. Optogenetic silencing strategies differ in their effects on inhibitory synaptic transmission. Nat Neurosci. 2012;15(8):1102–4. doi: 10.1038/nn.3143. [DOI] [PMC free article] [PubMed] [Google Scholar]
- 41.Zhang ZJ, Koifman J, Shin DS, Ye H, Florez CM, Zhang L, et al. Transition to Seizure: Ictal Discharge Is Preceded by Exhausted Presynaptic GABA Release in the Hippocampal CA3 Region. J Neurosci. 2012;32(7):2499–512. doi: 10.1523/JNEUROSCI.4247-11.2012. [DOI] [PMC free article] [PubMed] [Google Scholar]
- 42.Ziburkus J. Interneuron and Pyramidal Cell Interplay During In Vitro Seizure-Like Events. J Neurophysiol. 2006;95(6):3948–54. doi: 10.1152/jn.01378.2005. [DOI] [PMC free article] [PubMed] [Google Scholar]
- 43.Ladas TP, Chiang CC, Gonzalez-Reyes LE, Durand DM. Low frequency optical stimulation reduces seizure activity by entrainment through GABA-ergic system. Exp Neurol. 2014 doi: 10.1016/j.expneurol.2015.04.001. submitted. [DOI] [PMC free article] [PubMed] [Google Scholar]
- 44.Staley KJ, Proctor WR. Modulation of mammalian dendritic GABA(A) receptor function by the kinetics of Cl- and HCO3- transport. Journal of Physiology-London. 1999 Sep;519(3):693–712. doi: 10.1111/j.1469-7793.1999.0693n.x. [DOI] [PMC free article] [PubMed] [Google Scholar]
- 45.Ouanounou A, Carlen PL, El-Beheiry H. Enhanced isoflurane suppression of excitatory synaptic transmission in the aged rat hippocampus. Br J Pharmacol. 1998 Jul;124(6):1075–82. doi: 10.1038/sj.bjp.0701911. [DOI] [PMC free article] [PubMed] [Google Scholar]
- 46.Isaeva EV. Effects of isoflurane on hippocampal seizures at immature rats in vivo. Fiziol Zh. 2008;54:40–5. [PubMed] [Google Scholar]
- 47.Cardin JA, Carlén M, Meletis K, Knoblich U, Zhang F, Deisseroth K, et al. Targeted optogenetic stimulation and recording of neurons in vivo using cell-type-specific expression of Channelrhodopsin-2. Nat Protoc. 2010;5(2):247–54. doi: 10.1038/nprot.2009.228. [DOI] [PMC free article] [PubMed] [Google Scholar]
- 48.Yizhar O, Fenno Lief E, Davidson Thomas J, Mogri M, Deisseroth K. Optogenetics in Neural Systems. Neuron. 2011;71(1):9–34. doi: 10.1016/j.neuron.2011.06.004. [DOI] [PubMed] [Google Scholar]


