

Abstract
Drug targets and disease genes may work as driver factors at the transcriptional level, which propagate signals through gene regulatory network and cause the downstream genes' differential expression. How to analyze transcriptional response data to identify meaningful gene modules shared by both drugs and diseases is still a critical issue for drug-disease associations and molecular mechanism. In this article, we propose the drug-gene-disease coherent subnetwork concept to group the biological function related drugs, diseases, and genes. It was defined as the subnetwork with drug, gene, and disease as nodes and their interactions coherently crossing three data layers as edges. Integrating differential expression profiles of 418 drugs and 84 diseases, we develop a computational framework and identify 13 coherent subnetworks such as inflammatory bowel disease and melanoma relevant subnetwork. The results demonstrate that our coherent subnetwork approach is able to identify novel drug indications and highlight their molecular basis.
Drugs exert their function through binding to one or more protein targets. Early “one gene, one drug, one disease” paradigm considers the role of individual genes or proteins and their changes in drug-perturbed states or disease states. These drug target-centric approaches largely ignore a target's cellular and physiological context, making it difficult to address efficacy and safety problems in early stages of the drug discovery process.1 Meanwhile, disease gene-centric methods largely ignore the multi-factor-driven attribute of complex human diseases, which are accompanied by disruption of processes and networks at the cellular level.2 With the generation of rich and heterogeneous data resources for drug description and disease-induced perturbations, data integrative approaches and network techniques try to provide systemic insights into mechanisms of drugs and diseases.3
With this in mind, it is of great importance to investigate how drugs achieve their therapeutic functions via those gene modules, how pathophenotypes are influenced by the abnormality of gene modules, and most notably, how drugs and disease phenotypes are associated on the basis of gene modules. Gottlieb et al.4 developed an efficient computational method PREDICT, to identify drug-disease associations and predict new drug indications. Wang et al.5 proposed NetPredATC to introduce drug-target network to computationally predict drug's anatomical therapeutic chemical codes. However, their methods are machine learning-based, and cannot reveal the molecular basis for the association between drugs and diseases. Sirota et al.6 combined disease and drug-induced gene expression profiles for rational drug repositioning via anticorrelated links. In our group, we identified meaningful “drug-gene-disease co-modules” from the neuro-endocrine-immune system7 and traditional Chinese medicine such as a famous Liu-wei-di-huang herb formula.8,9 Recently, after establishing a disease gene prediction method CIPHER10 and a drug target prediction method drugCIPHER,11 we further developed a Bayesian partition method named comCIPHER12 to identify drug-gene-disease co-modules underlying the gene closeness data. Nevertheless, few existing studies attempt to identify gene modules important in associating drugs and diseases via transcriptional response analysis.
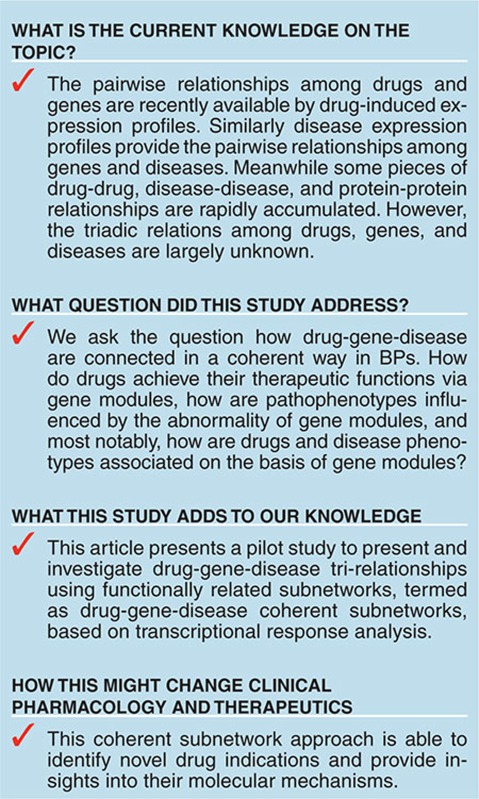
Here, we obtain drug-induced expression profiles and disease expression profiles from Connectivity Map13 and GEO,14 respectively. Interestingly, we find that drug targets and disease genes are not generally differentially expressed between case samples and control samples (Figure 1).
Figure 1.

The pie charts for P values to assess if the gene is differentially expressed. (a) The pie plot of P values for evaluating the differential expression of drug targets. (b) The pie plot of P values for evaluating the differential expression of disease genes.
In this work, we try to shed light on the puzzle of nondifferential expression of drug target or disease gene by proposing a novel drug-gene-disease coherent subnetwork concept. Here, a coherent subnetwork concept is to naturally extend the existing co-module concept. It was defined as the subnetwork with drug, gene, and disease as nodes and their interactions coherently crossing three data layers as edges. Integrating disease and drug-induced expression profiles, we develop a multiple nonnegative matrix factorization method, named DGPsubNet (here DGP denotes Drug, Gene and disease Phenotype, respectively), to identify drug-gene-disease coherent subnetworks, and additional heterogeneous data, including drug network, disease network, known therapeutic indications, and protein interaction network, are simultaneous integrated in a regularized manner. Meanwhile, the sparsity penalties are employed to achieve modular solutions (Figure 2). In our new method, we explicitly integrate the drug–drug, drug–gene, drug–disease, protein–protein, gene–disease, and disease–disease interactions to find the drug-gene-disease coherent subnetwork (see Methods). As a result, our output is no longer a set of drug, gene, and disease nodes. Instead, we obtain a connected subnetwork among a set of drug, gene, and disease nodes. In addition, the coherent subnetwork is beyond the usual subnetwork which is limited with single node type in one biomolecular data layer, such as subnetwork in protein interaction network. Coherent network emphasizes the crossing interactions among three types of nodes, i.e., drug, gene, and disease from chemical, protein, and phenotype levels. They perform their biological function coherently by tightly connection across biomolecular levels.
Figure 2.

The flowchart of identifying drug-gene-disease coherent subnetworks. The multiple nonnegative matrix factorization framework decomposes the two expression profile matrices (X1 and X2) into a common basis matrix W and different coefficient matrices (H1 and H2). Furthermore, additional heterogeneous data are simultaneously integrated in a regularized manner, and sparsity penalties to the variables (W, H1, and H2) are employed to achieve modular solutions. Based on the column of W and the row of H1 and H2, the shared gene elements, drug elements, and disease elements can be assigned to a certain coherent subnetwork, respectively. The crossing interactions among these three type elements are determined by the differential gene expression.
We apply the proposed method to 418 drugs and 84 diseases, and identified 13 coherent subnetworks. Then, we assessed the statistical significance of (anti-)correlation between drugs and diseases within a coherent subnetwork. Eleven subnetworks are statistically significant. Furthermore, we studied the biological significance of the coherent subnetworks, including known therapeutic indication enrichment and Gene Ontology (GO) enrichment analysis. Eleven subnetworks each have at least a known therapeutic role in a disease for a drug. After multiple testing corrections, eleven subnetworks are enriched in GO biological process (BP) terms. Case studies show that our coherent subnetwork approach is able to identify novel drug indications and highlight their molecular mechanisms. The data and Matlab code for our subnetwork detection algorithm are freely available from http://bioinfo.au.tsinghua.edu.cn/software/DGPsubNet and http://doc.aporc.org/wiki/DGPsubNet.
Results
Drug targets and disease genes are not generally differentially expressed
The gene expression profiles of drugs and diseases were extracted from Connectivity Map and GEO, respectively. To investigate the differential expression state of drug targets and disease genes, the drug targets and disease genes information were extracted from DrugBank15 and OMIM,16 respectively. It is noted that some drugs in Connectivity Map were tested with multiple dosages on different cell lines. Here, we treated them as different drug cases. Similarly, some diseases were studied by different GEO data sets with different tissue types or cell types, and we treated them as different disease cases. We obtained drug targets of 871 drug cases (275 distinct drugs) from DrugBank, and disease genes of 83 disease cases (57 distinct diseases) from OMIM. To determine if the differential expression for drug targets or disease genes between case samples and control samples is statistically significant, we calculated P values for drug targets and disease genes by comparing each to the distribution of differential expression values for all genes.
Figure 1 shows the pie plots of P values for drug targets and disease genes, in which drug targets and disease genes are not generally differentially expressed between case samples and control samples. Whereas, we noticed that their interacting subnetwork genes are differentially expressed. Thus, drug targets or disease genes may work as driver factors in transcriptional level, which propagate signals through gene regulatory network and cause the downstream genes' differential expression. Meanwhile, some works on driver genes and differential expression of their cascade genes can further support our explanation. Li et al.17 identified several modules in which each module contained the genes of a signature and their direct interacting partners that are cancer driver-mutating genes. Akavia et al.18 postulated that driver mutations coincide with a “genomic footprint” in the form of a gene expression signature, and developed an integrative approach to identify drivers of cancer. Here, we employ drug-gene-disease coherent subnetwork to understand the puzzle of nondifferential expression of drug target or disease gene.
Drug-gene-disease coherent subnetwork analysis
We ran DGPsubNet on the heterogeneous data, and 13 nonempty subnetworks across all three data layers, i.e., drug, disease, and the shared genes, were identified. There were seven empty subnetworks left, suggesting the number of K (predefined subnetwork number) is sufficient. The 13 drug-gene-disease subnetworks identified in this study have an average of 22 drug cases, 141 genes and 4 disease cases per subnetwork, and each subnetwork is described in detail on our website. In the following, we assess the statistical and biological significance of the selected subnetworks.
Assessing the statistical significance of (anti-)correlations between drugs and diseases within a coherent subnetwork. We expect that within a coherent subnetwork, drugs and diseases are highly (anti-) correlated based on differential expression profiles. In order to determine whether such relations are statistically significant, we performed the following assessment. First, to reduce the bias caused by genes which received differential expression values with small variations across drugs (diseases), we filter out those that had a standard deviation smaller than 1 both in drug and disease expression data, leaving r = 3460 genes and resulting in reduced drug and disease expression matrices rX1 and rX2 with dimensions r × n1 and r × n2, respectively. Second, we define the correlation S between the drugs and diseases within a subnetwork (correspond to expression submatrices sX1 from rX1 and sX2 from rX2, and their dimensions are r ×  and r ×
  , respectively) as the sum of the absolute values of Pearson's correlations between any two columns, one from each matrix, i.e.,
  , where
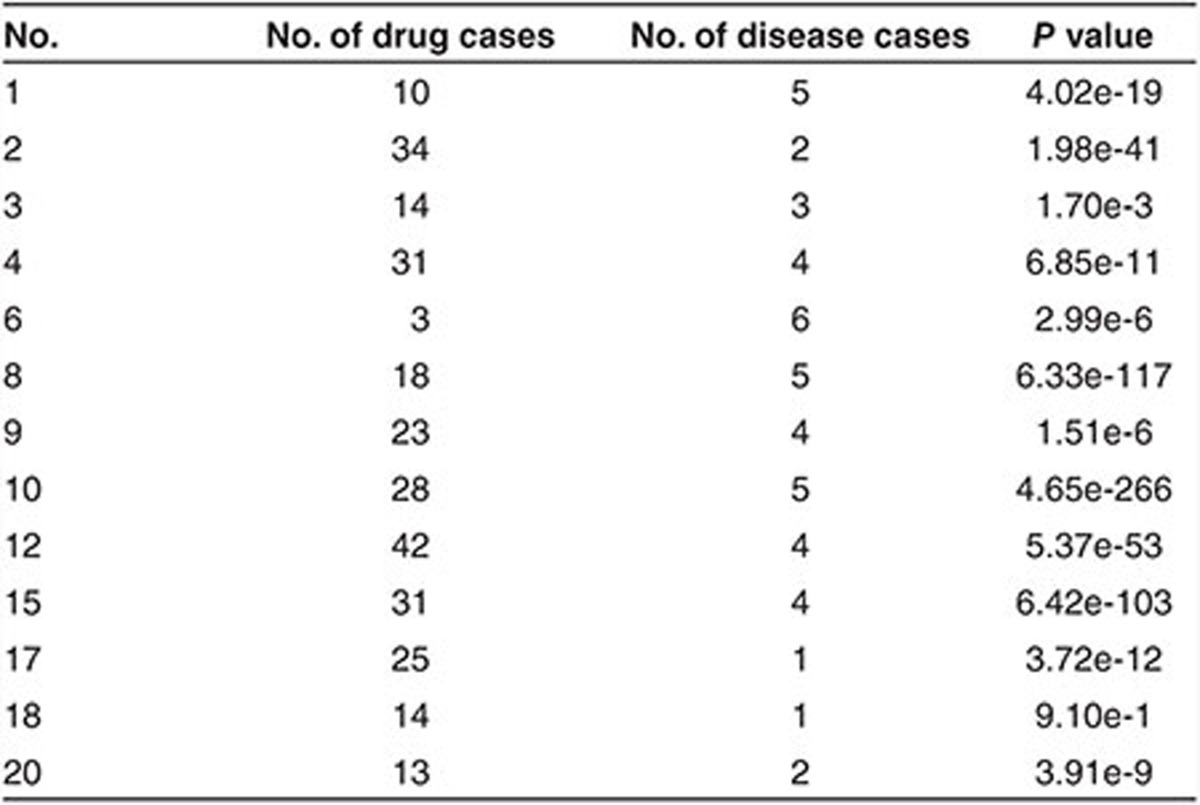
  , “corr” represents the Pearson's correlation coefficients. We derive the statistical significance (P value) of the correlation between sX1 and sX2 by comparing it to the distribution of correlations between 1,000 random matrix pairs. Each pair is composed of two matrices with dimensions identical to sX1 and sX2, whose elements are extracted from randomly permuted drug and disease expression matrices based on reduced drug and disease expression matrices rX1 and rX2. The drug-gene-disease coherent subnetworks with P values smaller than 0.01/20 were considered significant. Results show that the (anti-)correlations between drugs and diseases are statistically significant in 11 of the 13 coherent subnetworks (permutation test with P < 0.01/20) (Table 1).
Table 1. Statistical significance of (anti)-correlations between drugs and diseases within a coherent subnetwork.
Biological significance of the coherent subnetworks. We analyzed the known therapeutic indications in each coherent subnetwork based on CTD database19 and literature reference. There are 11 coherent subnetworks each having at least one known therapeutic role in a disease for a drug (Supplementary Table S1).
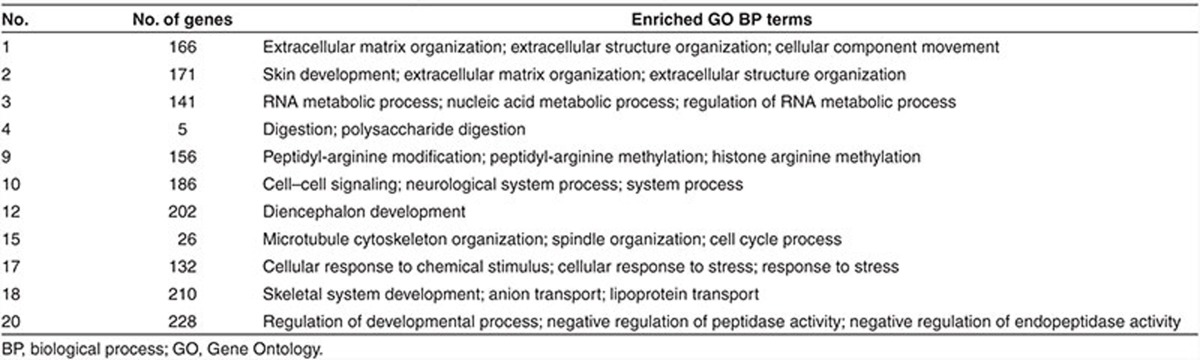
We also performed functional enrichment analysis for genes in the identified subnetworks by g:Profiler.20 For the identified 13 nonempty subnetworks, 11 subnetworks have at least one overrepresented GO BP term with a 0.01 false discovery rate (FDR) control (Benjamini-Hochberg correction). Table 2 lists the top three enriched GO BP terms for selected subnetworks. Furthermore, we sampled equivalent gene module number and their gene module size with the real gene modules from the genes in subnetworks for 100 rounds. The mean number of gene modules with at least one overrepresented GO BP term (FDR < 0.01) is 4.91, which is much less than 11 significant subnetworks found by our algorithm. These observations demonstrate the power of our method in categorizing genes that participate in the same processes or pathways.
Table 2. The enriched GO BP terms within each of 11 significant subnetworks identified by DGPsubNet.
It is noted that we integrated additional heterogeneous data and employed sparsity penalties in our multiple nonnegative matrix factorization framework. To show the importance of these operations to find functionally related coherent subnetworks, we set all weight parameters in Eq. 1 (see Methods) as zero and ran the model. As a result, 18 nonempty coherent subnetworks were found, and among them the number of coherent subnetworks with at least one overrepresented GO BP term (FDR < 0.01) is 6, which is less than 11 significant subnetworks found by our integrative framework. This demonstrates the utility of this integrative framework for grouping genes that participate in the same processes or pathways. See Supplementary Material for more details about advantages of considering network information in our approach.
Case studies
A coherent subnetwork relevant to inflammatory bowel disease and melanoma. The permutation test for (anti-)correlations between drugs and diseases within the subnetwork no. 9 is P = 1.51e-6. There are 23 drugs, 4 diseases, and 156 subnetwork genes. Inflammatory bowel disease (IBD) consists of Crohn's disease (CD) and ulcerative colitis. Figure 3a shows the coherent expression patterns of subnetwork genes from the diseases in the subnetwork. The expression profiles of IBD are anti-correlated with those of melanoma. Long et al.21 pointed out the risk of melanoma among patients with IBD, which validate the strong associations among diseases in our subnetwork. We map the subnetwork genes, drug targets (extracted from DrugBank), and disease genes (extracted from OMIM) onto the PPI network, and consider the functional significance for the major component (67 remaining genes) (Figure 4a). The differentially expressed genes are defined with the statistical significance (P < 0.05). We analyze the enriched Kyoto Encyclopedia of Genes and Genomes pathways and GO BP terms for the major component using g:Profiler. Melanoma pathway is significant for the major component (FDR = 3.14e-4). Deregulation of multiple elements of the mammalian target of rapamycin pathway (FDR = 2.38e-4) has been reported in many types of cancers, particularly in melanoma, where alterations in major elements of the mammalian target of rapamycin pathway were reported to have significant effects on tumor progression.22 Patients with IBD are at increased risk of colon carcinogenesis.23 The colorectal cancer pathway (FDR = 2.51e-3) is significant for the coherent subnetwork's major component. Chemokine signaling pathway (FDR = 5.61e-3) plays central roles in the pathogenesis of IBD24 and melanoma.25 AKT/PI3K pathway (FDR = 7.41e-03) implicated in both IBD and melanoma regulate cell growth, proliferation and cell death. The five most significantly enriched GO BP terms are negative regulation of protein binding (FDR = 2.66e-7), intracellular signal transduction (FDR = 1.07e-6), regulation of organelle organization (FDR = 1.12e-6), programmed cell death (FDR = 7.22e-6) and regulation of apoptotic process (FDR = 8.61e-6). Furthermore, we analyze the competence of identifying novel drug indications. As shown in Figure 3a, the differential expression extents of different diseases in the subnetwork genes are obviously distinct. For each disease, here we simply use the mean of differential expression values of subnetwork genes to evaluate the fold change of the disease in the subnetwork genes. The fold change values of ulcerative colitis, Crohn's disease, melanoma and melanocytic nevi are −2.83, −1.72, 3.47, and 2.93, respectively. Then we consider that the larger the fold change of one disease is, the more likely the drugs in the same subnetwork could treat it. For the 23 drugs in the subnetwork, besides 5 known therapeutic indications recorded in CTD (Figure 4a), 13 drugs were validated by literature references to treat at least one disease in the subnetwork, and especially 12 drugs can treat melanoma (Table 3 and Supplementary Table S2). For instance, Capsaicin, a main natural product extracted from chili peppers, is found to have the potential to treat both Ulcerative colitis and melanoma, which is in agreement with CTD and validated by literature. Interestingly, we also found that some promising drugs for melanoma were validated to induce IBD, and these cases are coincidence with the anti-correlation between expression profiles of melanoma and IBD. For example, the nonsteroidal anti-inflammatory drug diclofenac induces apoptosis in melanoma cell lines,26 but induces clinical relapse in patients with IBD.27 Conversely, the drug azathioprine used for treating IBD21 increases the risk of melanoma in immunosuppressed patients.28 Based on this anti-correlation between melanoma and IBD, some drugs inducing one disease may be used to treat the other disease. For example, drug hesperetin may be hypothesized to treat IBD which originally induces melanogenesis of murine melanoma cells.29 This is supported in part by the antiproliferative efficacy of hesperetin in colon cancer.30
Figure 3.

The coherent expression patterns of subnetwork genes (top area) from the diseases in three subnetworks: (a) the subnetwork no. 9, (b) the subnetwork no. 1, and (c) the subnetwork no. 15.
Figure 4.

The drug-gene-disease coherent subnetworks. (a) The subnetwork no. 9 is relevant to inflammatory bowel disease and melanoma. (b) The subnetwork no. 1 is relevant to gliomas, renal cell carcinoma, and actinic keratosis.
Table 3. The therapeutic indications of three subnetworks validated via CTD database or literature reference.
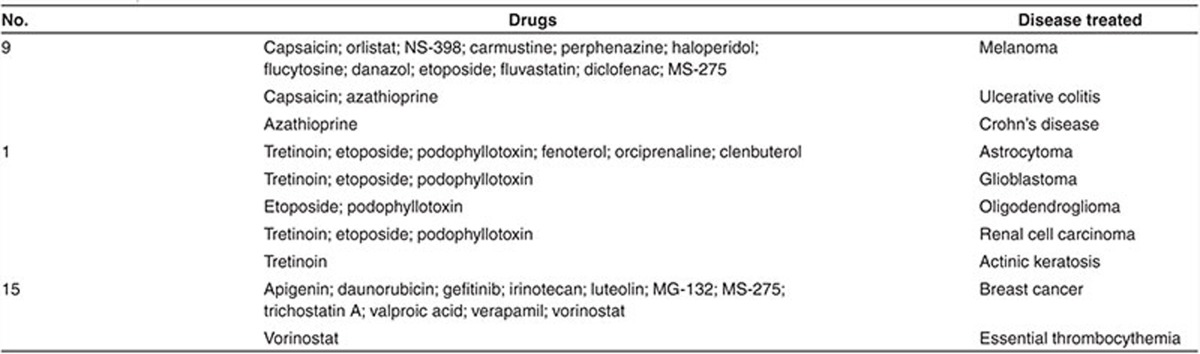
A coherent subnetwork relevant to gliomas, renal cell carcinoma, and actinic keratosis. The permutation test for (anti)-correlations between drugs and diseases within the subnetwork no. 1 gives P = 4.02e-19. The subnetwork diseases include gliomas, renal cell carcinoma, and actinic keratosis. According to different grades of gliomas, gliomas are further classified as glioblastoma, astrocytoma, and oligodendroglioma. In total, there are 9 drugs (10 drug cases), 5 diseases, and 166 subnetwork genes. Figure 3b shows the coherent expression patterns of subnetwork genes from the diseases in the subnetwork. We map the subnetwork genes, drug targets, and disease genes onto the PPI network, and consider the functional significance for the major component (55 remaining genes) (Figure 4b). We found that pathways enriched in the major component include focal adhesion (FDR = 9.65e-9), extracellular matrix (ECM)-receptor interaction (FDR = 5.18e-9), HIF-1 signaling pathway (FDR = 6.56e-4), p53 signaling pathway (FDR = 2.01e-2), proteoglycans in cancer (FDR = 4.68e-4), PI3K-Akt signaling pathway (FDR = 1.82e-6), transcriptional misregulation in cancer (FDR = 9.58e-3), and pathways in cancer (FDR = 7.98e-6). Among these pathways significantly enriched, focal adhesion and ECM-receptor interaction are the two most significant pathways. Focal adhesion plays a critical role in the pathogenesis of gliomas.31 The enrichment of the ECM-receptor interaction detected in this study has been reported in gliomas.32 Furthermore, focal adhesion and ECM-receptor interaction pathways which control cell communication were found to be significantly more likely to be disrupted in renal cell carcinoma.33 The two most significantly enriched GO BP terms are extracellular matrix organization (FDR = 2.05e-13) and extracellular structure organization (FDR = 2.16e-13). ECM components control many aspects of cell behavior, such as differentiation, proliferation, cell morphology and attachment. The fold change values of glioblastoma, renal cell carcinoma, astrocytoma, oligodendroglioma, and actinic keratosis are 3.29, 2.31, 2.80, 1.88, and 1.88, respectively. For the nine drugs in the subnetwork, six drugs were validated to treat at least one disease in the subnetwork via CTD database or literature reference (Table 3 and Supplementary Table S2), and especially six drugs can treat astrocytoma and three drugs can treat glioblastoma. Among the nine drugs, fenoterol, clenbuterol, and orciprenaline are β2-adrenergic receptor agonists, and were validated to inhibit the proliferation of astrocytoma cells.34
A coherent subnetwork relevant to breast cancer and essential thrombocythemia. The permutation test for (anti)-correlations between drugs and diseases within the subnetwork no. 15 gives P = 6.42e-103. There are 20 distinct drugs (31 drug cases), 4 distinct diseases (4 disease cases), and 26 subnetwork genes. Ductal carcinoma and lobular carcinoma are two main types of breast cancer. Figure 3c shows the coherent expression patterns of subnetwork genes from the diseases in the subnetwork. The 25 of the 26 subnetwork genes are differentially expressed in ductal carcinoma (P < 0.05). Although these subnetwork genes are isolated in the PPI network, the enriched GO BP terms are detected among them using g:Profiler (FDR < 0.01). The five most significantly enriched GO BP terms are microtubule cytoskeleton organization (FDR = 4.57e-9), spindle organization (FDR = 8.49e-9), cell cycle process (FDR = 1.77e-7), cell cycle (FDR = 9.83e-7), and microtubule-based process (FDR = 2.16e-6). The aberrations of microtubule cytoskeleton organization have been found to be common phenotype in human breast carcinoma cells, and the drugs that suppress the microtubule dynamic instability were found to be effective for the treatment of metastatic breast cancer.35 The fold change values of essential thrombocythemia, melanocytic nevi, ductal carcinoma, and lobular carcinoma are 1.85, −1.50, 4.89, and 4.07, respectively. For the 20 distinct drugs in the subnetwork, 11 drugs were validated to treat at least one disease in the subnetwork via literature reference (Table 3 and Supplementary Table S2), and especially these 11 drugs can treat breast cancer.
Discussion
In this study, we elucidate drug-disease relationships and seek to decipher their molecular basis by exploring the drug-gene-disease coherent subnetwork using optimization model. To the best of our knowledge, this is the first study to present and investigate drug-gene-disease relationships using functionally related subnetworks based on transcriptional response analysis. Then, we develop a multiple nonnegative matrix factorization method to identify drug-gene-disease subnetworks from heterogeneous data. The approach used in the current study possesses several merits. First, we map the subnetwork genes, drug targets, and disease genes onto the PPI network, and the network analysis can be employed to illustrate the drug mechanisms or disease pathology. Second, we find that drugs and diseases in each subnetwork tend to share differentially expressed genes and may therefore serve as another way to identify novel drug indications. Third, the multiple nonnegative matrix factorization framework can be expanded to integrate other heterogeneous data such as the multiple level data produced by current omics and high throughput sequencing technologies.36
It is noted that our coherent subnetwork approach and result analysis hypothesize that drugs tested in some cell lines have therapeutic indications on diseases in different cell types or tissue types. Although computationally derived drug indications of one cell line cannot exactly represent the actual actions of drugs in another cell type, the result can provide guidance. Kutalik et al.37 designed scheme to identify subsets of genes and drugs for which some cell lines exhibit similar profiles in both the gene-expression data and drug-response data. It supports our hypothesis of the conservation of drug actions in different cell lines.
In summary, we proposed a novel coherent subnetwork approach to discover drug-gene-disease relationships based on transcriptional response analysis, and demonstrated its utility by identifying new therapeutic indications and highlighting their molecular connections in the subnetworks. The integrative scheme of multiple nonnegative matrix factorization can efficiently uncover drug-gene-disease coherent subnetworks. Our analysis may provide novel insights into possible drug mechanisms or disease pathology, suggest new drug indications for drug repositioning, and benefit the methodology development of network pharmacology and systems pharmacology.
Methods
Data preprocess
The .cel files of drugs from Connectivity Map were processed used MAS 5.0 suit,38 and the gene expression profiles of diseases were obtained directly from GEO with soft format. The details of preprocessing gene expression profiles are shown in Supplementary Material. In summary, there were 1,284 drug cases and 131 disease cases which contained 418 distinct drugs and 84 distinct diseases, respectively. For each drug (disease) case and its transcriptional response profile, we evaluated the differential expression of each probe by using ratio of the expression level in drug induced (disease) sample against that in control sample. Then, the differential expression value for a particular gene was estimated using base 2 logarithm of the average differential expression value of all probe sets that map to the gene. Using the log-scale is to highlight the variation in the small values for the ratio. As a result, we obtained drug and disease expression matrices (X1 and X2).
The other heterogeneous data used in the subnetwork detection framework, including drug network, disease network, known therapeutic indications, and protein-protein interaction network, are introduced in the following. To construct drug network and disease network, the drug interacting genes and disease-associated genes were extracted from CTD database. Then we constructed drug network (A) and disease network (B) with weighted edges based on the shared drug interacting genes and shared disease-associated genes, respectively. It is noted that drug interacting genes and disease-associated genes curated by CTD are broader than drug targets from DrugBank and disease genes from OMIM, respectively. Because drug targets and disease genes are available only for a limited number of drugs and diseases, respectively, we replaced them with drug interacting genes and disease-associated genes here. The known therapeutic indications (C) were also obtained from CTD database. The protein interaction data (D) was integrated from five databases (see Supplementary Material).
Problem formulation
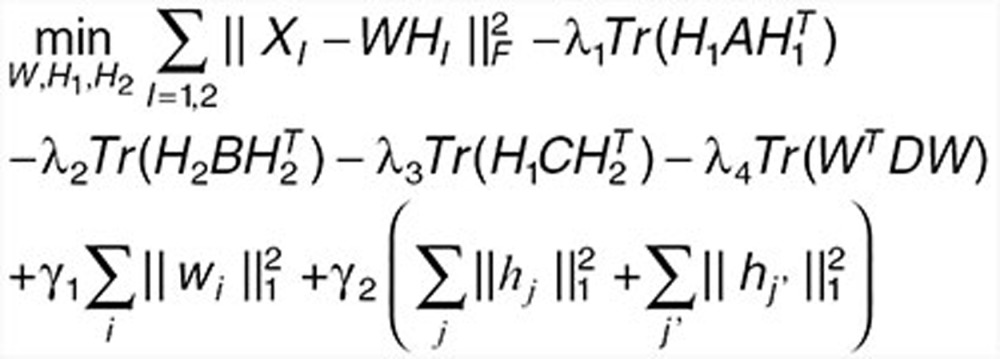
Here, we propose an effective data integration framework to identify drug-gene-disease coherent subnetworks, and the flowchart is shown in Figure 2. The differential expression profiles of drugs and diseases (X1 and X2) are jointly analyzed in a multiple nonnegative matrix factorization framework, and additional data (including drug network A, disease network B, therapeutic indications of drugs C, and protein interaction network D) are simultaneously integrated in a regularized manner. Meanwhile, the sparsity penalties are employed to achieve modular solutions. The integrative model of our multiple nonnegative matrix factorization method is designed as
 |
 |
where ||•||F means the Frobenius norm of a matrix, Tr() is the trace of a matrix. wi is the ith row of W, hj, and hj' are the jth and j'th columns of H1 and H2 respectively (Supplementary Table S3).
The multiple nonnegative matrix factorization framework decomposes the two data matrices (X1 and X2) into a common basis matrix W and different coefficient matrices (H1 and H2), where XI (I = 1,2) is an m × nI matrix, W is an m × K matrix containing the basis vectors, and HI is a K × nI matrix containing the coefficient vectors. The fact that W and HI (I = 1,2) are nonnegative guarantees to identify nonsubtractive patterns that together explain the data (XI) as a linear combinations of the basis vectors in W. The K basis vectors in W can be regarded as the “building blocks” of the data, and the K coefficient vectors in HI describe how strongly each “building block” is present in the data.
Let A denote the adjacent matrix of the drug network. We enforce “must-link” constraints by maximizing the following objective function:  , where
  and
and  are the ith and jth columns of H1, respectively. This term ensures that drugs with known interactions have similar coefficient profiles. The other network-regularized terms such as
  ,
,  , and
, and  are similarly considered. To control the degree of sparseness in the W and HI (I = 1,2), we impose L1-norm constraints in Eq. 1 as suggested by Kim and Park.39
As to the selections of reduced vertical dimension of basis matrix W (i.e., K) and weight parameters λ1, λ2, λ3, λ4, γ1, and γ2 (Supplementary Figure S1), we detailed them in Supplementary Material. It is noted that the multiple nonnegative matrix factorization framework necessitates transforming the two expression matrices into nonnegative matrices. The transformation is executed by the approach proposed by Kim and Tidor40 and is detailed in Supplementary Material.
Drug-gene-disease subnetwork algorithm
We expand the popular multiplicative updating algorithm developed for nonnegative matrix factorization and its variants to our subnetwork detection method DGPsubNet. We have developed an algorithm that efficiently converges to a local minimum by iteratively updating the matrix decomposition. This behavior can be proved in the same way as for the classical nonnegative matrix factorization algorithm.41 Derivations of the multiplicative updating rules and proof are provided in the Supplementary Material. Below we detail the multiplicative updating algorithm for DGPsubNet to identify the local minimum. The dimensions of X1 and X2 are denoted as m × n1 and m × n2, respectively. The time complexity of the proposed algorithm is O(tK(m + n1 + n2)2), where t is the number of iterations.
Algorithm for DGPsubNet
Initialize W, H1, and H2 with nonnegative values, and set the iteration index t = 0, the maximum number of iterations to run maxiter = 500.
while(t ≤ maxiter)
Fix H1 and H2, update W with
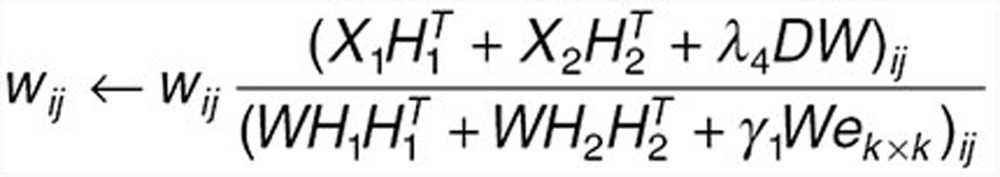 |
to find Wt + 1 such that objective function decreases. Among the above equation, ek × k is a matrix of all 1s with dimension k × k.
Fix W, update H1 and H2 with
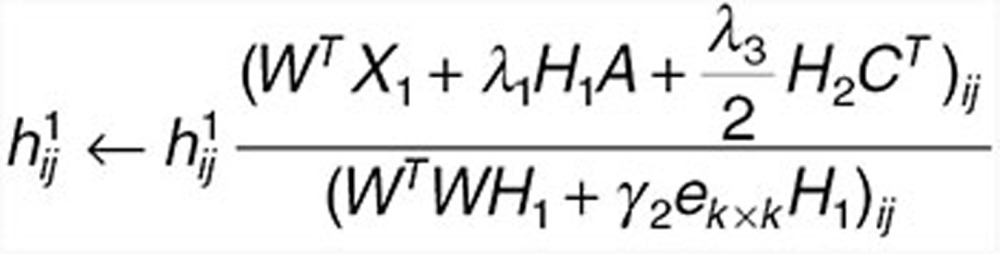 |
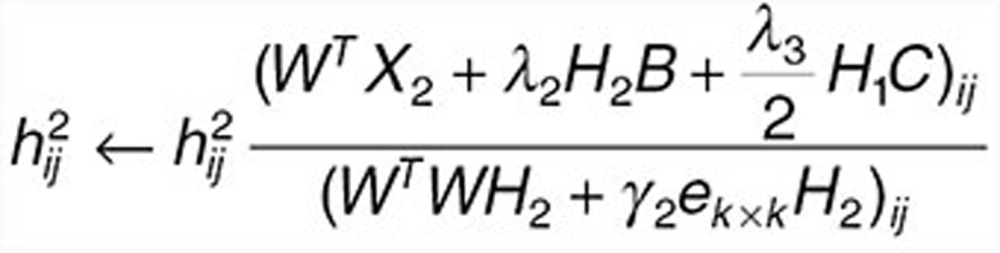 |
to find  and
and  such that objective function decreases.
Let t ← t + 1.
Drug-gene-disease subnetwork algorithm
We calculate a z-score for each element of the factorization based on the rows of H1 and H2:
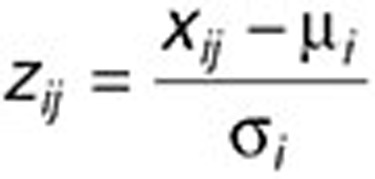 |
where µi is the average value of drug j (or disease j') in H1 (or H2), and σi is the standard deviation. We assign drug j (disease j') to subnetwork i if zij (zij‘) is greater than a given threshold T. Note that in our approach, each drug/disease may be assigned to multiple subnetworks, permitting the identification of drug repositioning.
Similarly, we calculate a z-score for each element of the factorization based on the columns of W, and assign gene i to subnetwork j if zij is greater than the threshold T. Then we determine the crossing interactions among the three type elements, i.e., drug, gene and disease, by the differential gene expression. The selection of proper threshold T (Supplementary Figure S2) is detailed in Supplementary Material.
Conflict of interest
The authors declared no conflict of interest.
Author contributions
S.L. and L.W. designed the research. L.W. and S.L. performed the research. L.W., Y.W., Q.H., and S.L. analyzed the data. L.W., Y.W., Q.H., and S.L. wrote the manuscript.
Study Highlights
Acknowledgments
This work was supported by the National Natural Science Foundation of China (91229201, 81225025, 61222210, 61171007, and 11131009).
Supplementary Material
References
- Iskar M., Zeller G., Zhao X.M., van Noort V., Bork P. Drug discovery in the age of systems biology: the rise of computational approaches for data integration. Curr. Opin. Biotechnol. 2012;23:609–616. doi: 10.1016/j.copbio.2011.11.010. [DOI] [PubMed] [Google Scholar]
- Goh K.I., Cusick M.E., Valle D., Childs B., Vidal M., Barabási A.L. The human disease network. Proc. Natl. Acad. Sci. U.S.A. 2007;104:8685–8690. doi: 10.1073/pnas.0701361104. [DOI] [PMC free article] [PubMed] [Google Scholar]
- Csermely P., Korcsmáros T., Kiss H.J., London G., Nussinov R. Structure and dynamics of molecular networks: a novel paradigm of drug discovery: a comprehensive review. Pharmacol. Ther. 2013;138:333–408. doi: 10.1016/j.pharmthera.2013.01.016. [DOI] [PMC free article] [PubMed] [Google Scholar]
- Gottlieb A., Stein G.Y., Ruppin E., Sharan R. PREDICT: a method for inferring novel drug indications with application to personalized medicine. Mol. Syst. Biol. 2011;7:496. doi: 10.1038/msb.2011.26. [DOI] [PMC free article] [PubMed] [Google Scholar]
- Wang Y.C., Chen S.L., Deng N.Y., Wang Y. Network predicting drug's anatomical therapeutic chemical code. Bioinformatics. 2013;29:1317–1324. doi: 10.1093/bioinformatics/btt158. [DOI] [PubMed] [Google Scholar]
- Sirota M., et al. Discovery and preclinical validation of drug indications using compendia of public gene expression data. Sci. Transl. Med. 2011;3:96ra77. doi: 10.1126/scitranslmed.3001318. [DOI] [PMC free article] [PubMed] [Google Scholar]
- Zhang J., Ma T., Li Y., Li S. dbNEI2.0: building multilayer network for drug-NEI-disease. Bioinformatics. 2008;24:2409–2411. doi: 10.1093/bioinformatics/btn388. [DOI] [PubMed] [Google Scholar]
- Li S., Zhang B., Jiang D., Wei Y., Zhang N. Herb network construction and co-module analysis for uncovering the combination rule of traditional Chinese herbal formulae. BMC Bioinformatics. 2010;11 (suppl. 11):S6. doi: 10.1186/1471-2105-11-S11-S6. [DOI] [PMC free article] [PubMed] [Google Scholar]
- Liang X., Li H., Li S. A novel network pharmacology approach to analyse traditional herbal formulae: the Liu-Wei-Di-Huang pill as a case study. Mol. Biosyst. 2014;10:1014–1022. doi: 10.1039/c3mb70507b. [DOI] [PubMed] [Google Scholar]
- Wu X., Jiang R., Zhang M.Q., Li S. Network-based global inference of human disease genes. Mol. Syst. Biol. 2008;4:189. doi: 10.1038/msb.2008.27. [DOI] [PMC free article] [PubMed] [Google Scholar]
- Zhao S., Li S. Network-based relating pharmacological and genomic spaces for drug target identification. PLoS ONE. 2010;5:e11764. doi: 10.1371/journal.pone.0011764. [DOI] [PMC free article] [PubMed] [Google Scholar]
- Zhao S., Li S. A co-module approach for elucidating drug-disease associations and revealing their molecular basis. Bioinformatics. 2012;28:955–961. doi: 10.1093/bioinformatics/bts057. [DOI] [PubMed] [Google Scholar]
- Lamb J., et al. The Connectivity Map: using gene-expression signatures to connect small molecules, genes, and disease. Science. 2006;313:1929–1935. doi: 10.1126/science.1132939. [DOI] [PubMed] [Google Scholar]
- Barrett T., et al. NCBI GEO: archive for functional genomics data sets–10 years on. Nucleic Acids Res. 2011;39:D1005–D1010. doi: 10.1093/nar/gkq1184. [DOI] [PMC free article] [PubMed] [Google Scholar]
- Knox C., et al. DrugBank 3.0: a comprehensive resource for ‘omics' research on drugs. Nucleic Acids Res. 2011;39:D1035–D1041. doi: 10.1093/nar/gkq1126. [DOI] [PMC free article] [PubMed] [Google Scholar]
- Hamosh A., Scott A.F., Amberger J.S., Bocchini C.A., McKusick V.A. Online Mendelian Inheritance in Man (OMIM), a knowledgebase of human genes and genetic disorders. Nucleic Acids Res. 2005;33:D514–D517. doi: 10.1093/nar/gki033. [DOI] [PMC free article] [PubMed] [Google Scholar]
- Li J., et al. Identification of high-quality cancer prognostic markers and metastasis network modules. Nat. Commun. 2010;1:34. doi: 10.1038/ncomms1033. [DOI] [PMC free article] [PubMed] [Google Scholar]
- Akavia U.D., et al. An integrated approach to uncover drivers of cancer. Cell. 2010;143:1005–1017. doi: 10.1016/j.cell.2010.11.013. [DOI] [PMC free article] [PubMed] [Google Scholar]
- Davis A.P., Murphy C.G., Saraceni-Richards C.A., Rosenstein M.C., Wiegers T.C., Mattingly C.J. Comparative Toxicogenomics Database: a knowledgebase and discovery tool for chemical-gene-disease networks. Nucleic Acids Res. 2009;37:D786–D792. doi: 10.1093/nar/gkn580. [DOI] [PMC free article] [PubMed] [Google Scholar]
- Reimand J., Kull M., Peterson H., Hansen J., Vilo J. g:Profiler–a web-based toolset for functional profiling of gene lists from large-scale experiments. Nucleic Acids Res. 2007;35:W193–W200. doi: 10.1093/nar/gkm226. [DOI] [PMC free article] [PubMed] [Google Scholar]
- Long M.D., Martin C.F., Pipkin C.A., Herfarth H.H., Sandler R.S., Kappelman M.D. Risk of melanoma and nonmelanoma skin cancer among patients with inflammatory bowel disease. Gastroenterology. 2012;143:390–399.e1. doi: 10.1053/j.gastro.2012.05.004. [DOI] [PMC free article] [PubMed] [Google Scholar]
- Pópulo H., Lopes J.M., Soares P. The mTOR Signalling Pathway in Human Cancer. Int. J. Mol. Sci. 2012;13:1886–1918. doi: 10.3390/ijms13021886. [DOI] [PMC free article] [PubMed] [Google Scholar]
- Triantafillidis J.K., Nasioulas G., Kosmidis P.A. Colorectal cancer and inflammatory bowel disease: epidemiology, risk factors, mechanisms of carcinogenesis and prevention strategies. Anticancer Res. 2009;29:2727–2737. [PubMed] [Google Scholar]
- Nishimura M., Kuboi Y., Muramoto K., Kawano T., Imai T. Chemokines as novel therapeutic targets for inflammatory bowel disease. Ann. N. Y. Acad. Sci. 2009;1173:350–356. doi: 10.1111/j.1749-6632.2009.04738.x. [DOI] [PubMed] [Google Scholar]
- Payne A.S., Cornelius L.A. The role of chemokines in melanoma tumor growth and metastasis. J. Invest. Dermatol. 2002;118:915–922. doi: 10.1046/j.1523-1747.2002.01725.x. [DOI] [PubMed] [Google Scholar]
- Albano F., et al. Markers of mitochondrial dysfunction during the diclofenac-induced apoptosis in melanoma cell lines. Biochimie. 2013;95:934–945. doi: 10.1016/j.biochi.2012.12.012. [DOI] [PubMed] [Google Scholar]
- Takeuchi K., et al. Prevalence and mechanism of nonsteroidal anti-inflammatory drug-induced clinical relapse in patients with inflammatory bowel disease. Clin. Gastroenterol. Hepatol. 2006;4:196–202. doi: 10.1016/s1542-3565(05)00980-8. [DOI] [PubMed] [Google Scholar]
- Guenova E., et al. Nodular malignant melanoma and multiple cutaneous neoplasms under immunosuppression with azathioprine. Melanoma Res. 2009;19:271–273. doi: 10.1097/CMR.0b013e32831bc44a. [DOI] [PubMed] [Google Scholar]
- Huang Y.C., Liu K.C., Chiou Y.L. Melanogenesis of murine melanoma cells induced by hesperetin, a Citrus hydrolysate-derived flavonoid. Food Chem. Toxicol. 2012;50:653–659. doi: 10.1016/j.fct.2012.01.012. [DOI] [PubMed] [Google Scholar]
- Aranganathan S., Nalini N. Antiproliferative efficacy of hesperetin (citrus flavanoid) in 1,2-dimethylhydrazine-induced colon cancer. Phytother. Res. 2013;27:999–1005. doi: 10.1002/ptr.4826. [DOI] [PubMed] [Google Scholar]
- Garzon-Muvdi T., et al. Regulation of brain tumor dispersal by NKCC1 through a novel role in focal adhesion regulation. PLoS Biol. 2012;10:e1001320. doi: 10.1371/journal.pbio.1001320. [DOI] [PMC free article] [PubMed] [Google Scholar]
- Sadeque A., Serão N.V., Southey B.R., Delfino K.R., Rodriguez-Zas S.L. Identification and characterization of alternative exon usage linked glioblastoma multiforme survival. BMC Med. Genomics. 2012;5:59. doi: 10.1186/1755-8794-5-59. [DOI] [PMC free article] [PubMed] [Google Scholar]
- Zhou L., et al. Integrated profiling of microRNAs and mRNAs: microRNAs located on Xq27.3 associate with clear cell renal cell carcinoma. PLoS ONE. 2010;5:e15224. doi: 10.1371/journal.pone.0015224. [DOI] [PMC free article] [PubMed] [Google Scholar]
- Toll L., et al. {Beta}2-adrenergic receptor agonists inhibit the proliferation of 1321N1 astrocytoma cells. J. Pharmacol. Exp. Ther. 2011;336:524–532. doi: 10.1124/jpet.110.173971. [DOI] [PMC free article] [PubMed] [Google Scholar]
- Azarenko O., Okouneva T., Singletary K.W., Jordan M.A., Wilson L. Suppression of microtubule dynamic instability and turnover in MCF7 breast cancer cells by sulforaphane. Carcinogenesis. 2008;29:2360–2368. doi: 10.1093/carcin/bgn241. [DOI] [PMC free article] [PubMed] [Google Scholar]
- Zhang S., Liu C.C., Li W., Shen H., Laird P.W., Zhou X.J. Discovery of multi-dimensional modules by integrative analysis of cancer genomic data. Nucleic Acids Res. 2012;40:9379–9391. doi: 10.1093/nar/gks725. [DOI] [PMC free article] [PubMed] [Google Scholar]
- Kutalik Z., Beckmann J.S., Bergmann S. A modular approach for integrative analysis of large-scale gene-expression and drug-response data. Nat. Biotechnol. 2008;26:531–539. doi: 10.1038/nbt1397. [DOI] [PubMed] [Google Scholar]
- Hubbell E., Liu W.M., Mei R. Robust estimators for expression analysis. Bioinformatics. 2002;18:1585–1592. doi: 10.1093/bioinformatics/18.12.1585. [DOI] [PubMed] [Google Scholar]
- Kim H., Park H. Sparse non-negative matrix factorizations via alternating non-negativity-constrained least squares for microarray data analysis. Bioinformatics. 2007;23:1495–1502. doi: 10.1093/bioinformatics/btm134. [DOI] [PubMed] [Google Scholar]
- Kim P.M., Tidor B. Subsystem identification through dimensionality reduction of large-scale gene expression data. Genome Res. 2003;13:1706–1718. doi: 10.1101/gr.903503. [DOI] [PMC free article] [PubMed] [Google Scholar]
- Zhang S., Li Q., Liu J., Zhou X.J. A novel computational framework for simultaneous integration of multiple types of genomic data to identify microRNA-gene regulatory modules. Bioinformatics. 2011;27:i401–i409. doi: 10.1093/bioinformatics/btr206. [DOI] [PMC free article] [PubMed] [Google Scholar]
Associated Data
This section collects any data citations, data availability statements, or supplementary materials included in this article.