

Abstract
Microenvironmental regulation of cancer stem cells (CSCs) strongly influences the onset and spread of cancer. The way in which glioma cells interact with their microenvironment and acquire the phenotypes of CSCs remains elusive. We investigated how communication between vascular endothelial cells and glioma cells promoted the properties of glioma stem cells (GSCs). We observed that CD133+ GSCs were located closely to Shh+ endothelial cells in specimens of human glioblastoma multiforme (GBM). In both in vitro and in vivo studies, we found that endothelial cells promoted the appearance of CSC-like glioma cells, as demonstrated by increases in tumourigenicity and expression of stemness genes such as Sox2, Olig2, Bmi1 and CD133 in glioma cells that were co-cultured with endothelial cells. Knockdown of Smo in glioma cells led to a significant reduction of their CSC-like phenotype formation in vitro and in vivo. Endothelial cells with Shh knockdown failed to promote Hedgehog (HH) pathway activation and CSC-like phenotype formation in co-cultured glioma cells. By examination of glioma tissue specimens from 65 patients, we found that the survival of glioma patients was closely correlated with the expression of both Shh by endothelial cells and Gli1 by perivascular glioma cells. Taken together, our study demonstrates that endothelial cells in the tumour microenvironment provide Shh to activate the HH signalling pathway in glioma cells, thereby promoting GSC properties and glioma propagation. © 2014 The Authors. The Journal of Pathology published by John Wiley & Sons Ltd on behalf of Pathological Society of Great Britain and Ireland.
Keywords: glioma stem cell, niche, endothelial cell, hedgehog pathway
Introduction
Glioblastoma multiforme (GBM) is the most common intracranial malignancy in adults, and is associated with poor outcomes 1. Emerging evidence suggests that there is a rare population of tumour cells, called glioma stem cells (GSCs), responsible for GBM initiation, propagation, resistance to radiotherapy and recurrence of disease. Although the origin of cancer stem cells (CSCs) remains controversial, it has been suggested that cancer cells may acquire CSC phenotype through reprogramming or dedifferentiation under certain conditions, known as cell plasticity 2–4.
The stem cell niche is composed of stem cells, neighbouring supportive cells, inflammatory cells, microvessels, extracellular matrix and soluble factors such as chemokines and cytokines, which assist stem cells in maintaining their stemness and in avoiding apoptosis 5. The perivascular 6,7, hypoxic 4,8 and metastatic niches 9,10 are the three most-studied areas in the field of GSCs 11, and our previous study demonstrated that CD133+ GSCs were associated with tumour vasculature and promoted angiogenesis through the production of VEGF 12. Endothelial cells (ECs) functioned as an important player in the perivascular niche to promote the self-renewal of CSCs in medulloblastoma and GBM 13. However, the underlying mechanism is still unclear.
The Hedgehog (HH) pathway is known to direct embryonic growth and cell fate determination in embryonic development. Recently, this pathway has been found to participate in maintaining the self-renewal of somatic stem cells, which is also dysregulated in many types of tumours 14,15. The canonical HH pathway is activated by three kinds of HH ligands (Shh, Ihh and Dhh) that bind to the multi-component receptor complex, including the trans-membrane protein Patched (PTCH) and the G-protein coupled protein Smoothened (Smo). The binding of Shh to PTCH releases Smo, thereby altering the activity of Glioma-associated oncogene homologue 1 (Gli1) protein to initiate the transcription of downstream genes 16. Importantly, the HH pathway is highly activated in many brain tumours, including glioma 17,18. Thus, we postulated that the HH pathway might participate in the regulation of the interaction between ECs and GSCs.
In this study, we demonstrated that ECs functioned as a part of the GSC niche to promote GSC-like phenotype by providing Shh to activate HH pathway. Our study highlights the importance of the HH pathway in the CSC niche to regulate GSC phenotype.
Materials and methods
Primary glioma samples
Glioma specimens were obtained from 65 patients who underwent surgery in Southwest Hospital, Third Military Medical University, Chongqing, from 2004 to 2009 (see supplementary material, Table S1). The tumour specimens were independently classified by at least two pathologists according to the 2007 WHO classification of central nervous system tumours. All patients were followed for at least 3 years. All experiments were approved by the Institutional Ethics Committee of Southwest Hospital, Third Military Medical University. Written informed consent for the biological studies was obtained from the patients or their guardians.
Immunofluorescence staining
For tissue experiments, human GBM samples and mouse allografts were frozen and fixed in cold acetone. Primary rabbit anti-human CD31 (1:100; Anbo Biotechnology, San Francisco, CA, USA), mouse anti-human CD45 (1:50; BD Falcon, Franklin Lakes, NJ, USA), rabbit anti-human VE-cadherin (1:100; Cell Signaling Technology, Danvers, MA, USA), mouse anti-human CD133 (1:100; Miltenyi Biotec, Germany), rabbit anti-mouse CD133 (1:100; Miltenyi Biotec), rat anti-human Shh (1:200; R&D Systems, Minneapolis, MN, USA) and rat anti-human Gli1 (1:200; R&D Systems) were used. For immunofluorescence experiments, cultured cells were fixed in 4% paraformaldehyde. Primary rabbit anti-mouse β-catenin (1:200; Abcam, Cambridge, UK), rabbit anti-mouse Hes1 (1:1000; Novus Biologicals, Littleton, CO, USA), mouse anti-mouse Bmi1 (1:100; Abcam), rat anti-mouse Gli1 (1:100; R&D Systems), rabbit anti-mouse Olig2 (1:200; Novus Biologicals) and rabbit anti-mouse Sox2 (1:200; Novus Biologicals) were used. After being labelled with the corresponding secondary antibodies, all samples were then examined under a laser confocal scanning microscope (SP-5, Leica, Germany).
Cell culture
GL261 (mouse glioma cell line) and b.END3 (mouse brain microvessel endothelial cell line) cells were purchased from the Cell Bank of Shanghai Institute of Cell Biology and Biochemistry, Chinese Academy of Sciences (Shanghai, China). U251 cells (human GBM cell line) and human umbilical vein endothelial cells (HUVECs) were purchased from ATCC (Manassas, VA, USA). Mouse cells were cultured as previously described 19. Human cells were cultured using Dulbecco's modified Eagle's medium (DMEM) containing 10% fetal bovine serum (FBS). Tumour spheres were cultured in serum-free DMEM/F12 medium with 10 ng/ml epidermal growth factor (EGF, PeproTech), 10 ng/ml bFGF (PeproTech) and 2 mg/ml B27 (Sigma) (stem cell medium). For co-culture experiments, transwell cell culture inserts (0.4 µm pore size; Millipore, USA) were used. Briefly, 2 × 10⁵ tumour cells with 2.6 ml medium were seeded in the lower chamber of six-well plates, and 1 × 10⁵ ECs with 1.4 ml medium were seeded in the upper chamber of the insert. After 24 h of culture, the media were changed and the insert was transferred into the well with tumour cells. After co-culture for an additional 48 h, the cells were harvested.
Tumour sphere initiation assays
The cells were trypsinized and seeded in stem cell medium to form primary tumour spheres, which were then disaggregated and reseeded for evaluation of the self-renewal of GSCs by formation of secondary tumour spheres. After co-culture with ECs for 24 h, the tumour cells were harvested and seeded into 96-well plates with cell concentrations of 5–20 cells/well. Each well received 20 µl fresh medium every 2 days. After culture for 14 days, culture wells with spheres were marked and spheres were counted 20.
Allografts
Both subcutaneous and orthotopic allograft models were generated by transplantation of 3 × 10⁵ GL261 cells, with or without 3 × 10⁴ b.END3 cells, into 4 week-old C57 mice (Laboratory Animal Centre, Third Military Medical University). The allografts were observed and measured and the mice were weighed every 2 days. Allograft-bearing mice were sacrificed and the allografts were obtained and measured at the end of week 3 (subcutaneous transplantation) or week 2 (orthotopic allograft). The brain of each allografted mouse was sliced into several coronal sections; the section with the largest tumour diameter was measured using ImageJ (http://rsbweb.nih.gov/ij/; NIH, Bethesda, MD, USA) 21. Tumour volume (Tv) was calculated using the formula: Tv = L (length) × W2 (width)/2 22. The animal experiments were approved by the Institutional Ethics Committee.
Immunohistochemistry
Immunohistochemistry (IHC) was performed using an IHC kit (Zsbio, Beijing, China). Primary rabbit anti-human CD34 (1:100; Maxim, Fuzhou, China), rabbit anti-human Shh (1:100; Novus Biologicals), rabbit anti-human/mouse PTCH (1:100; Novus Biologicals) and rabbit anti-human Gli1 (1:100; Novus Biologicals) were used. Secondary antibodies included HRP-conjugated goat anti-rat IgG and goat anti-rabbit IgG. The specimens were independently scored by two pathologists who were blinded to the clinicopathological data. An area ratio (AR) was derived from the division of the IHC-positive area by the blank area under microscopic fields, and was applied for calculation of average levels of expression: AR = 0, 0–10% positive area; AR = 1, 10–50% positive area; AR = 2, 50–80% positive area; and AR = 3, > 80% positive area. The relative expression (RE) level was the immunostaining intensity of each sample: RE = 0, negative; RE = 1, yellow staining; RE = 2, brown staining; and RE = 3, dark brown staining. The final scores were the sum of AR and RE: scores of 0–2 were negative, 3–4 were moderate and 5–6 were high 23.
Statistical analysis
For pathological analysis, perivascular glioma cells were defined as those closer than 50 µm to the nearest ECs, which was about twice the average diameter of a glioma cell. ECs were referred to serial section specimens of haematoxylin and eosin (H&E) and CD34 staining 24. Kaplan–Meier analysis was used for survival analysis, which was counted from the date of initial diagnosis. All in vitro experiments were conducted at least three times and the results are presented from representative experiments. Data are expressed as mean ± standard deviation (SD). The statistical significance between testing and control groups was analysed with SPSS 16.0 statistical software (SPSS Inc., Chicago, IL, USA). When two groups were compared, the unpaired Student's t-test was used; p < 0.05 was considered statistically significant.
FACS analysis and sorting, RT–PCR, gene knockdown, Shh expression stimulated by VEGF or SDF1α, ELISA and western blot
See supplementary material, Supplementary materials and methods. The sequences of each primer pair are presented in Table S2.
Results
CD133-expressed GSCs localize close to Shh-expressing endothelial cells
Immunofluorescence experiments on human GBM samples were conducted to investigate the role of the HH pathway in mediating the interaction of ECs with GSCs. As shown in Figure 1, CD31+ ECs were located close to CD133+ GSCs (Figure 1A), which is in agreement with our previous study 12. These CD31+ ECs appeared to be immature microvessels that were diffuse and/or lined and not completely intact. Furthermore, most CD31+ ECs expressed and secreted Shh in human GBM samples, although some tumour cells were surrounded with Shh (Figure 1B), indicating that ECs were an important source of Shh. We then observed that in the primary samples, Shh was detected in the area close to CD133+ cells, indicating that CD133+ GSCs were located next to Shh-expressing cells or surrounded by Shh (Figure 1C). Further, we found that glioma cells closer to CD31+ ECs had a significantly higher expression of Gli1 in the nuclei (Figure 1D). After quantitatively analysing Gli1+ GBM cells and their correlations to ECs, we found that most of Gli1-expressed GBM cells were perivascular cells (pGCs; 65.99 ± 7.11%) and some were distant cells (dGCs; 34.00 ± 7.12%; see supplementary material, Figure S1A, B). Additionally, we confirmed that these CD31+ cells also expressed VE-cadherin (Figure 1E) but not CD45 (Figure 1F), indicating that they were not haematopoietic. Our data suggest that the HH pathway may participate in the interaction between GSCs and ECs.
Figure 1.
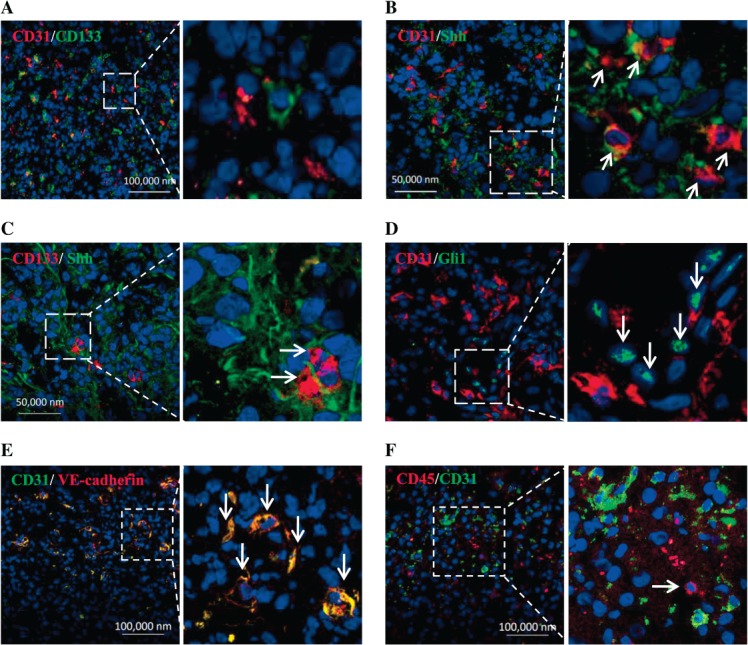
CD133-expressing GSCs locate closely to Shh-expressed endothelial cells in human GBM samples. (A) CD133+ tumour cells (green) located close to CD31+ endothelial cells (red). (B) CD31+ endothelial cells expressed Shh (orange, arrow). (C) CD133+ tumour cells (red, arrow) located next to Shh-expressed cells (green). (D) Gli1-expressed tumour cells (green, arrow) closely located to CD31+ endothelial cells (red). (E) CD31 and VE-cadherin were co-expressed in endothelial cells (yellow). (F) CD31+ endothelial cells (green) were not CD45+ (red, arrow). Right panels are partial enlargements of the corresponding left panels.
Endothelial cells promote tumour sphere formation and CD133 expression by glioma cells in vitro and tumour growth in vivo
To explore the mechanism underlying the interaction between GSCs and ECs, we utilized transwell co-culture. Both GL261 and U251 cells were tested for their ability to form tumour spheres after being cultured with corresponding ECs. As shown in Figure 2, tumour spheres generated from both cells cultured with ECs were much larger than those generated from both cells in the absence of ECs (Figure 2A). Meanwhile, proliferation of GL261 cells was not affected by their interaction with b.END3 cells (see supplementary material, Figure S2A). A limiting dilution assay revealed that the sphere-forming capacity of GL261 and U251 cells precultured with ECs was higher than that of glioma cells alone (Figure 2B). FACS analysis demonstrated that CD133+ glioma cells were significantly enriched after being co-cultured with corresponding ECs (Figure 2C). In order to verify the effect of ECs on glioma cells in vivo, we performed grafted tumour experiments, using both subcutaneous and orthotopic transplantation. Our orthotopic transplanted tumour model revealed that co-injection of GL261 and b.END3 cells led to earlier deaths of mice (Figure 2D) with larger allografts (Figure 2E) than GL261 cells alone, which was also confirmed by subcutaneous transplantation experiments (see supplementary material, Figure S2B). Further investigation revealed that allografts generated by co-injection of GL261 and b.END3 cells contained more CD133+ GSCs (see supplementary material, Figure S2C), higher microvessel density (MVD; see supplementary material, Figure S2D) and Ki-67 index (see supplementary material, Figure S2E), as compared to the allografts generated from GL261 cells alone. Although the cell cycle of GL261 cells was not changed after co-culture with b.END3 cells, which is inconsistent with previous findings by others 25,26, the higher Ki67 index indicated that endothelial cells could enhance not only the CSC phenotype but also proliferation in glioma cells. Our data suggest that ECs enhance tumour initiation and growth, possibly through promoting CSC-like phenotype of glioma cells.
Figure 2.
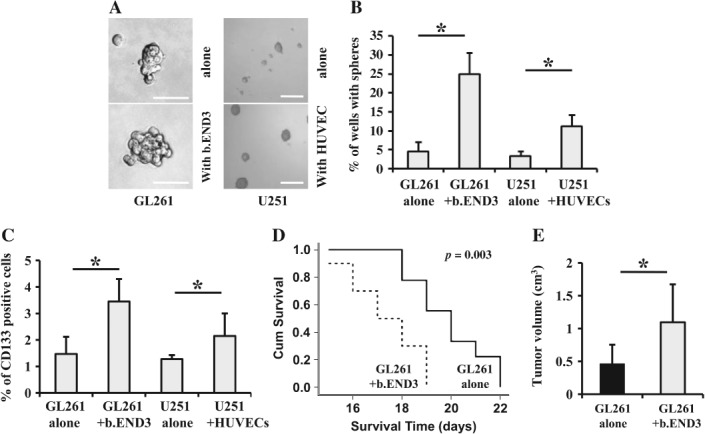
Endothelial cells promote tumour sphere formation and CD133 expression by glioma cells in vitro and tumour growth in vivo. (A) Tumour spheres formed by GL261 cells cultured with b.END3 cells (left; scale bar = 100 µm) or by U251 cells cultured with HUVECs (right; scale bar = 300 µm) were larger in size than those formed by GL261, or U251 cells alone, respectively. (B) Efficiency of tumour sphere formation by GL261 cells cultured with b.END3 cells or by U251 cells cultured with HUVECs was higher than that by GL261 or U251 cells alone, respectively (*p < 0.05). (C) The numbers of CD133+ GL261 (left) or U251 cells (right) were significantly increased after co-culture with b.END3 cells or HUVECs, respectively (*p < 0.05). (D) Survival times of mice that were orthotopically co-injected with GL261 and b.END3 cells were shorter than those of mice orthotopically injected with GL261 cells alone (*p < 0.05). (E) Tumour volume of orthotopic allografts generated by co-injection of GL261 with b.END3 cells was significantly larger than that of orthotopic allografts generated by injection of GL261 cells alone (*p < 0.05).
Endothelial cells up-regulate the expression of CSC-associated genes in glioma cells
Olig2, Sox2 and Bmi1, key genes in maintaining the stemness of GSCs 18,27,28, could be detected in both GL261 and U251 cells. As shown in Figure 3, Olig2, Bmi1 and Sox2 were all over-expressed in GL261 cells co-cultured with b.END3 cells, and the expression change of Olig2 was most obvious among them (Figure 3A), which was also in parallel with their corresponding protein levels, as demonstrated by western blot analysis (Figure 3B). In the U251 cells cultured with HUVECs, Olig2, Bmi1 and Sox2 were also over-expressed at the levels of both mRNA (Figure 3C) and protein (Figure 3D). Immunofluorescence confocal microscopy not only revealed increased intensities of Olig2, Bmi1 and Sox2 but also that Olig2 was translocated from the cytoplasm to the nuclei in GL261 cells after co-culture with ECs (Figure 3E). These data demonstrate that ECs are able to up-regulate the expression of stemness-related genes in glioma cells upon their interaction with each other.
Figure 3.
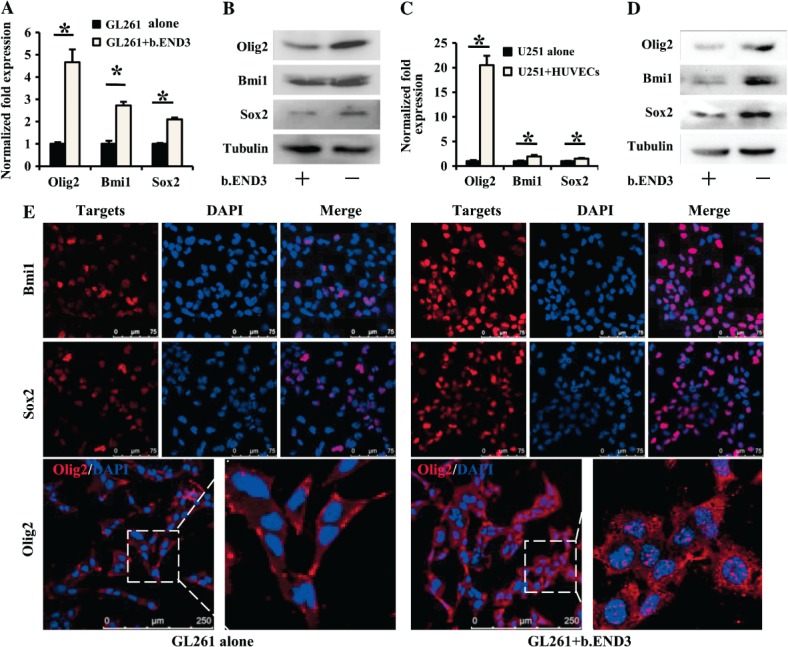
Endothelial cells up-regulate expression of CSC-associated genes in glioma cells. As compared to GL261 alone, expression of GSC-associated genes Olig2, Bmi1 and Sox2 were elevated in GL261 cells co-cultured with b.END3 cells: (A) real-time RT–PCR, *p < 0.05; (B) western blot, tubulin was used as control. As compared to U251 cells alone, expressions of Olig2, Bmi1 and Sox2 were elevated in U251 cells co-cultured with HUVECs; (C) real-time RT–PCR, *p < 0.05; (D) western blot, tubulin was used as control. (E) Immunofluorescence staining revealed that expressions of Bmi1 (upper), Sox2 (middle) and Olig2 (lower) were increased in GL261 cells co-cultured with b.END3 cells. Right panels are partial enlargements of the corresponding left panels.
HH pathway is significantly activated in the glioma cells co-cultured with endothelial cells
To determine whether HH pathway activation plays any role in glioma cells co-cultured with ECs, we examined the expression of Gli1 together with Hes1 and β-catenin, since they have all been reported as crucial to CSC self-renewal and proliferation 29–31. As shown in Figure 4A, Gli1 expression was significantly increased in GL261 cells co-cultured with ECs, but the expressions of both Hes1 and β-catenin remained unchanged. Meanwhile, increased Gli1 expression positively correlated with co-culture time (Figure 4A). Furthermore, Gli1 was over-expressed in the U251 cells co-cultured with HUVECs (Figure 4B). We then performed immunofluorescence confocal microscopic analysis to examine the translocation of Gli1, one of the critical indicators to demonstrate HH pathway activation. As shown in Figure 4C, Gli1 moved completely from the cytoplasm compartment to the nuclei in GL261 cells co-cultured with b.END3 cells, indicating that the HH pathway was functionally activated. However, the locations of both β-catenin and Hes1 were not affected by b.END3 cells (Figure 4C). Taken together, these results indicate that the HH pathway is activated in glioma cells when cultured with ECs.
Figure 4.
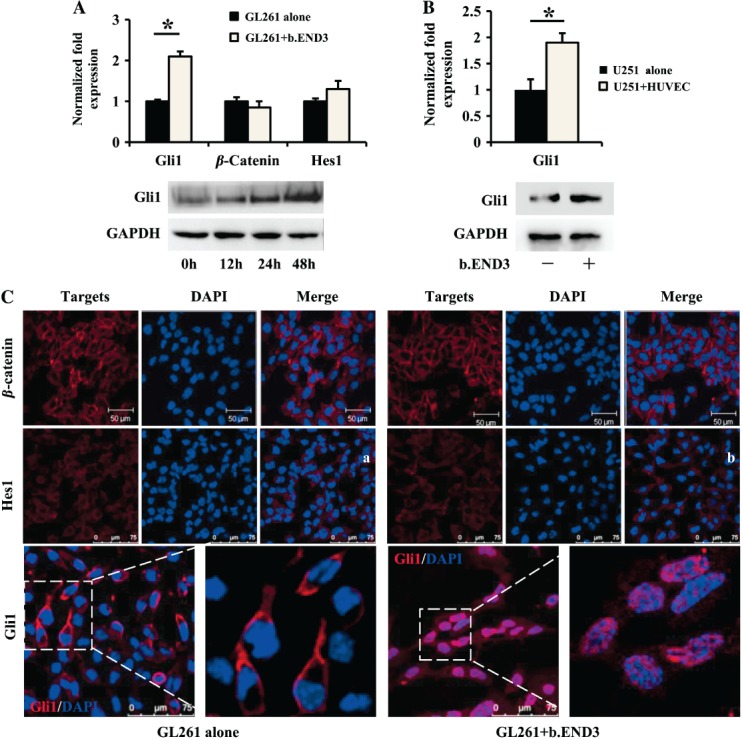
The HH pathway is significantly activated in glioma cells co-cultured with endothelial cells. (A) Gli1 expression was induced in GL261 cells co-cultured with b.END3, while Hes1 and β-catenin were not affected (*p < 0.05; upper panel, RT–PCR; lower panel, western blot). (B) Gli1 expression was induced in U251 cells co-cultured with HUVECs (*p < 0.05; upper panel, RT–PCR; lower panel, western blot). (C) Location and fluorescence intensity of both β-catenin (upper panel) and Hes1 (middle panel) were not significantly changed. Gli1 (red) was up-regulated and translocated to the nuclei of GL261 cells co-cultured with b.END3 (lower right panel). Right panels are partial enlargements of the corresponding left panels.
Inhibition of the Hedgehog pathway hampers the appearance of GSC-like phenotype of glioma cells
To determine whether HH pathway activation mediated the promotion of a GSC-like phenotype, we generated Smo-knockdown GL261 cells (shSmo–GL261; see supplementary material, Figure S3A), because Smo is the important intermediary factor in the canonical HH pathway. Tumour spheres formed by shSmo–GL261 cells were not only smaller in size (Figure 5A) but also fewer in number (Figure 5B) than those formed by mock-GL261 cells. Furthermore, ECs had less effect on formation of tumour spheres by shSmo–GL261 cells (Figure 5A, B). Additionally, CD133 was down-regulated in shSmo–GL261 cells, and the level of CD133 in the shSmo–GL261 co-cultured with ECs could not increase to that in the mock-GL261 cells co-cultured with ECs (Figure 5C; see also supplementary material, Figure S3B). Moreover, the expressions of Sox2, Olig2 and Bmi1 were all reduced in shSmo–GL261 cells, on which ECs had no effect (Figure 5D). Allografts were generated from shSmo–GL261 cells and mock-GL261 cells that were injected with or without ECs. ShSmo–GL261 cells generated significantly smaller tumours than mock-GL261 cells, regardless of the presence or not of ECs (Figure 5E; see also supplementary material, Figure S3C). Collectively, these results indicate that the stemness of GL261 is enhanced upon HH pathway activation and suggest that the promotion of GSC-like phenotype by ECs is mediated through the HH pathway.
Figure 5.
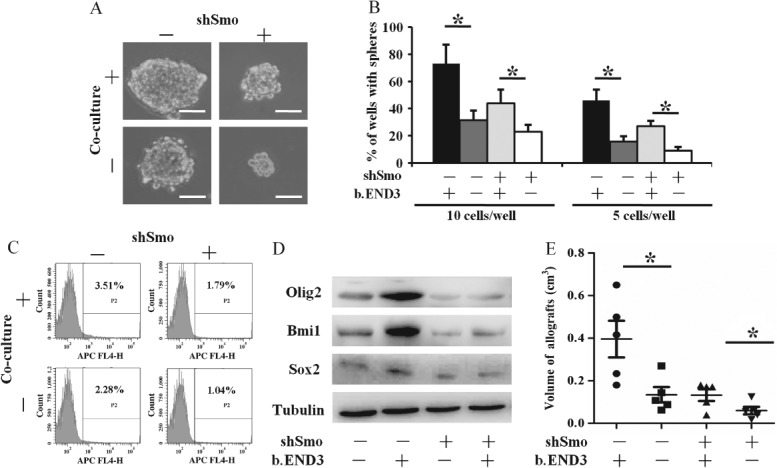
Inhibition of Hedgehog pathway hampers the appearance of GSC-like phenotype of glioma cells. As compared to mock-GL261 alone or mock-GL261 cells co-cultured with b.END3, shSmo–GL261 alone or shSmo–GL261 cells co-cultured with b.END3 cells formed smaller tumour spheres (A; scale bar = 100 µm) and fewer tumour spheres (B; *p < 0.05), respectively. CD133 expression of shSmo–GL261 cells was reduced (C) and expressions of Sox2, Olig2 and Bmi1 were significantly reduced (D), respectively, tubulin was used as control. Subcutaneous allografts generated by shSmo–GL261 cells, with or without b.END3 cells, were significantly smaller in volume as compared to mock GL261 cells with or without b.END3 cells (E; *p < 0.05), respectively; −, wild-type GL261 cells; +, Smo-knockdown GL261 cells.
Shh secreted from endothelial cells is important in both activating HH pathway and promoting CSC-like phenotype in glioma cells
Expression of Shh was detected in ECs. RT–PCR analysis showed that expression of Shh was dramatically up-regulated in the b.END3 cells co-cultured with GL261 cells (Figure 6A), and the concentration of Shh in the supernatant collected from co-cultured cells was much higher than that of b.END3 cells or GL261 cells alone, as determined by ELISA assay (Figure 6B). To determine whether Shh secreted from ECs had a significant influence on glioma cells, we generated Shh-knockdown b.END3 cells (siShh-b.END3; see supplementary material, Figure S4D). As shown in Figure 6C, D, both mRNA expression and protein abundance of Gli1 were significantly decreased in GL261 cells co-cultured with siShh-b.END3 cells as compared to wild-type b.END3 cells. Moreover, the expressions of Olig2, Bmi1 and Sox2 (Figure 6D) and the portion of CD133+ GL261 cells (Figure 6E) were also reduced in GL261 cells co-cultured with siShh-b.END3 cells. Furthermore, the size and number of tumour spheres formed by GL261 cells co-cultured with siShh-b.END3 cells were significantly smaller and reduced, respectively (Figure 6F). To examine how Shh in b.END3 cells was up-regulated, we detected CXCR4 and VEGF in our co-culture model. Both CXCR4 and VEGF in co-cultured b.END3 cells (Figure 6G) and SDF1 in co-cultured GL261 cells (Figure 6H) were significantly induced. Treatment with VEGF, but not SDF1 (see supplementary material, Figure S3F), could increase Shh expression in both b.END3 cells and HUVECs (Figure 6I). Thus, our data imply that GL261 cells may stimulate Shh secretion from b.END3 cells, and that Shh secreted from ECs activates the HH pathway to promote a CSC-like phenotype, possibly through the VEGF stimulation.
Figure 6.

Shh secreted from endothelial cells is important in both activating HH pathway and promoting CSC-like phenotype in glioma cells. As compared to b.END3 cells alone, mRNA expression of Shh in b.END3 (A, *p < 0.05) and secretion of Shh protein in supernatant (B, *p < 0.05) were significantly up-regulated when b.END3 was co-cultured with GL261 cells. By comparison with GL261 cells that were co-cultured with wild-type b.END3 cells, Shh knockdown in b.END3 cells (siShh-b.END3) inhibited expression of Gli1, Olig2, Sox2 and Bmi1 in GL261 cells (C; RT–PCR; D; western blot; *p < 0.05). The CD133 expression (E; *p < 0.05) and tumour spheres (F; *p < 0.05; scale bar = 50 µm) of GL261 cells cultured with siShh-b.END3 cells were significantly less than those co-cultured with wild-type b.END3 cells. Both CXCR4 and VEGF in b.END3 cells (G; *p < 0.05) and SDF1 in GL261 cells (H; *p < 0.05) were induced after co-culture of GL261 cells and b.END3 cells, respectively. VEGF protein treatment induced Shh expression in both b.END3 cells and HUVECs (I; *p < 0.05); −, GL261 cells cultured with wild-type b.END3 cells; +, GL261 cells cultured with Shh-knockdown b.END3 cells.
Prognosis of glioma patients is associated with expression of Shh from endothelial cells and Gli1 from glioma cells
CD34+ ECs, arranged in linear fashion, clustered and in microvessels, were observed in glioma specimens. Gli1 expression was much stronger in glioma cells near ECs (see supplementary material, Figure S4). The expressions of Shh on ECs and Gli1 on pGCs were 72% (24/33) and 61% (20/33), respectively, in low-grade glioma (WHO grade II). In high-grade glioma (WHO grades III–IV), the positive rates of Shh on ECs and Gli1 on pGCs were 81% (26/32) and 84% (27/32), respectively. Higher expression of Shh on ECs was observed in 18% (6/33) of low-grade glioma and 44% (14/32) of high-grade glioma, while the higher expression of Gli1 on pGCs was 24% (8/33) in low-grade glioma and 47% (15/32) in high-grade glioma. Expressions of both Shh and Gli1 were significantly related to WHO grades of glioma but not to gender, age, KPS and tumour location (Table 1). Based on Shh/Gli1 expression, patients were divided into two groups, a negative or moderate group and a high-expression group. Kaplan–Meier analysis revealed that expressions of Shh on ECs (Figure 7A) and Gli1 on pGCs (Figure 7B) were all related to the length of patient survival, with high expression implying worse prognosis. Taken together, our results indicate that Shh on ECs and Gli1 on pGCs may be useful indicators of prognosis in glioma patients.
Table 1.
Correlation between HH pathway factors and pathological parameters in glioma patients
| Feature | Shh on ECs | Gli1 on pGCs | ||||||
|---|---|---|---|---|---|---|---|---|
| Negative (n) | Moderate (n) | High (n) | p | Negative (n) | Moderate (n) | High (n) | p | |
| WHO grade | ||||||||
| II | 9 | 18 | 6 | 0.041* | 13 | 12 | 8 | 0.022* |
| III | 4 | 5 | 7 | 2 | 5 | 9 | ||
| IV | 2 | 7 | 7 | 0.112** | 3 | 7 | 6 | 0.068** |
| Gender | ||||||||
| Male | 10 | 21 | 16 | 0.231 | 5 | 7 | 6 | 0.635 |
| Female | 5 | 9 | 4 | 13 | 17 | 17 | ||
| Age | ||||||||
| ≥ 60 years | 0 | 2 | 3 | 0.095 | 0 | 2 | 3 | 0.152 |
| < 60 years | 15 | 28 | 17 | 18 | 22 | 20 | ||
| KPS | ||||||||
| ≥ 80 | 13 | 21 | 13 | 0.363 | 11 | 16 | 17 | 0.839 |
| < 80 | 7 | 9 | 5 | 7 | 8 | 6 | ||
| Tumour location | ||||||||
| Frontal | 13 | 15 | 8 | 0.971 | 8 | 16 | 9 | 0.671 |
| Non-frontal | 7 | 15 | 10 | 10 | 8 | 14 | ||
Unpaired Student's t-test was used for comparison between low-grade (grade II) and high-grade (grade III and IV) gliomas.
Kruskal–Wallis analysis was used for comparison of Shh on ECs and Gli1 on pGCs in the three grades of glioma.
KPS, Karnofsky Performance Scale.
Figure 7.
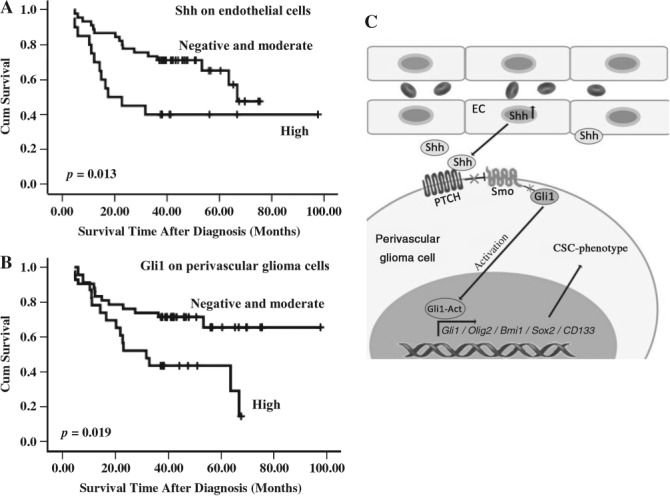
Prognosis of glioma patients is associated with Shh expression by endothelial cells and Gli1 by glioma cells. (A) Kaplan–Meier curve showing higher expression of Shh by endothelial cells significantly relates to worse prognosis. (B) Kaplan–Meier curve showing that higher expression of Gli1 by perivascular glioma cells significantly relates to worse prognosis. (C) Schematic presentation for summarization.
Discussion
GSCs are responsible for glioma initiation, propagation, resistance to radiotherapy and recurrence, although the definition and existence of CSCs remain debatable. Emerging experimental evidence suggests the possibility that a more differentiated cancer cell might dedifferentiate into a CSC 32. A dynamic equilibrium may exist between CSCs and non-CSCs within tumours, with tumour cells continually shifting from one type to another, or in between 33. The tumour niche appears to push the equilibrium toward CSCs 11,34,35. Moreover, the perivascular niche is enriched with CSCs 7,36,37, suggesting that ECs may be reprogrammed to support tumourigenesis 38–40. However, the exact interaction between a CSC and its perivascular niche is still unclear. Our data demonstrate that ECs regulate GSCs via the HH pathway, as evidenced by observations that GSCs are located close to ECs, and that the HH pathway in perivascular glioma cells was activated. ECs promoted a GSC-like phenotype in vitro and enhanced tumour formation in vivo by activating the HH pathway of glioma cells. Both Shh over-expression by ECs and Gli1 up-regulation in glioma cells were important in enrichment of the cells with GSC phenotype. Clinically, we found that specific Shh and Gli1 expressions were associated with patient survival, highlighting the potential clinical significance of our findings. Taken together, our findings reveal a clear HH network in the niche of GSCs: glioma cells induce Shh in ECs, probably via VEGF pathway, then Shh secreted from ECs activates HH pathway in glioma cells. This HH network may play a critical role in glioma propagation.
The perivascular niche promotes a GSC-like phenotype through multiple ways 35. Recent studies have shown that nitric oxide and NOTCH ligands released from tumour ECs activated the NOTCH pathway and promoted stem-like characters in GBM and colorectal cancer 37,41–43. Moreover, one recent study has reported that activation of the HIF2a and PI3K pathway is also required for the growth of cancer stem-like cells within the endothelial niche in GBM and medulloblastoma 44. Here, we innovatively demonstrate that the HH pathway is an important mediator of the GSC niche.
The HH pathway is activated in various tumours, including glioma 45. It has also been reported that the HH pathway is characteristically activated in the subtypes of medulloblastoma 46,47 and PTCH mutation persistently activates the HH pathway and promotes medulloblastoma 48. Bmi1 is also important in HH-driven medulloblastoma 49. In glioma, the HH pathway, IDH mutation and Bmi1 participate in tumour growth, GSC self-renewal and tumourigenicity 50,51. Inhibition of the HH pathway in GSCs produces significant but incomplete tumour regression 52–54. Ehtesham et al 55 found that the HH pathway was not activated in primary GBM, but only in grade II and III gliomas, which is partially contradicted by a report by Bar et al 53. The latter found that the HH pathway was also highly activated in grade IV gliomas. Our results are consistent with the report by Bar et al, since we also detected PTCH expression in 12 of 15 primary GBMs and 8 of 10 grade II glioma samples (see supplementary material, Figure S5A, B). We reason that the discrepancy may be due to extreme heterogeneity of glioma cells and sample location within the tumour.
Shh is expressed by tumour ECs in human gliomas and PDGF-driven gliomas 56. We observed that Shh was increased in ECs when cultured with glioma cells, indicating that Shh expression by ECs could be regulated by glioma cells. NF-κB also induces Shh expression 57. Further, the CXCL12–CXCR4–NF-κB axis also induces Shh over-expression in tumour cells 58. The VEGF pathway interacts with the HH pathway 59. GSCs indeed secrete VEGF and SDF1 to promote angiogenesis 60, and both VEGF and CXCR4 pathways are activated in GBM and GSCs 12,61–63. We demonstrated that VEGF, but not SDF-1, induced Shh expression in ECs, although the VEGF and CXCR4 pathways were activated in the ECs and glioma cells co-culture model.
In summary, we have explored the mechanism underlying the interaction between GSC and its niche, where ECs promote CSC-like phenotype of glioma cells by activating the HH pathway. Treatment targeting on ECs by inhibiting Shh secretion may be an innovative way to improve prognosis in glioma patients.
Acknowledgments
This research was supported by the National Natural and Science Foundation of China (NSFC; Grant Nos 30870965, 2010CB529403, 30800421 and 81230062). We thank Ms Qing-Hua Ma and Mr Zeng-Tian Sun for their assistance in FACS techniques, Ms Yu Zhang for her assistance in IHC techniques, Ms Fang-Fang Li for her assistance in laser confocal microscopy techniques, and Ms Jiao Fan for her assistance in collection of tumour samples (Institute of Pathology and Southwest Cancer Center, Southwest Hospital, Third Military Medical University).
Author contributions
DYG and XWB conceived this research; GNY and LY developed the methodology and carried out major experiments; YFL, YS and LLS carried out experiments; XHY, QNG, YHC, XZ, XWB and DYG provided advice and support; GNY, LY, YHC, XZ, XWB and DYG analysed and interpreted data; GNY, LY and DYG wrote the draft manuscript; and PZ, YHC, XZ, XWB and DYG reviewed, edited and/or revised the manuscript. All authors were involved in paper writing and had final approval of the submitted version.
Supporting Information
The following supplementary material may be found in the online version of this article:
Supplementary materials and methods
Gli1 expression of perivascular glioma cells were significantly higher than those far from microvessels in human GBM samples
Endothelial cells promote the CSC phenotype in murine and human glioma cells
Knockdown of HH pathway inhibits endothelial cell-mediated regulation of glioma cells
Representative H&E-stained and IHC images of human glioma samples used in the prognostic study
IHC analysis of PTCH expression in human glioma samples
Clinical features of patients with glioma
Sequences of each primer pair used in this study
References
- Li J, Di C, Mattox AK, et al. The future role of personalized medicine in the treatment of glioblastoma multiforme. Pharmgenom Pers Med. 2010;3:111–127. doi: 10.2147/PGPM.S6852. [DOI] [PMC free article] [PubMed] [Google Scholar]
- Welte Y, Adjaye J, Lehrach HR, et al. Cancer stem cells in solid tumors: elusive or illusive? Cell Commun Signal. 2010;8(1):6. doi: 10.1186/1478-811X-8-6. [DOI] [PMC free article] [PubMed] [Google Scholar]
- Rapp UR, Ceteci F. Schreck R. Oncogene-induced plasticity and cancer stem cells. Cell Cycle. 2008;7(1):45–51. doi: 10.4161/cc.7.1.5203. [DOI] [PubMed] [Google Scholar]
- Heddleston JM, Li Z, McLendon RE, et al. The hypoxic microenvironment maintains glioblastoma stem cells and promotes reprogramming towards a cancer stem cell phenotype. Cell Cycle. 2009;8(20):3274–3284. doi: 10.4161/cc.8.20.9701. [DOI] [PMC free article] [PubMed] [Google Scholar]
- Moore KA. Stem cells and their niches. Science. 2006;311:1880–1885. doi: 10.1126/science.1110542. [DOI] [PubMed] [Google Scholar]
- Ghajar CM, Peinado H, Mori H, et al. The perivascular niche regulates breast tumour dormancy. Nat Cell Biol. 2013;15(7):807–817. doi: 10.1038/ncb2767. [DOI] [PMC free article] [PubMed] [Google Scholar]
- Ritchie KE, Nör JE. Perivascular stem cell niche in head and neck cancer. Cancer Lett. 2012;338(1):41–46. doi: 10.1016/j.canlet.2012.07.025. [DOI] [PMC free article] [PubMed] [Google Scholar]
- Seidel S, Garvalov BK, Wirta V, et al. A hypoxic niche regulates glioblastoma stem cells through hypoxia inducible factor 2. Brain. 2010;133(4):983–995. doi: 10.1093/brain/awq042. [DOI] [PubMed] [Google Scholar]
- Sleeman JP. The metastatic niche and stromal progression. Cancer Metast Rev. 2012;31(3–4):429–440. doi: 10.1007/s10555-012-9373-9. [DOI] [PMC free article] [PubMed] [Google Scholar]
- Pienta KJ, Robertson B, Coffey D, et al. The cancer diaspora: metastasis beyond the seed and soil hypothesis. Clin Cancer Res. 2013;19(21):5849–5855. doi: 10.1158/1078-0432.CCR-13-2158. [DOI] [PMC free article] [PubMed] [Google Scholar]
- Borovski T, De Sousa E, Melo F, et al. Cancer stem cell niche: the place to be. Cancer Res. 2011;71(3):634–639. doi: 10.1158/0008-5472.CAN-10-3220. [DOI] [PubMed] [Google Scholar]
- Ping YF, Yao XH, Jiang JY, et al. The chemokine CXCL12 and its receptor CXCR4 promote glioma stem cell-mediated VEGF production and tumour angiogenesis via PI3K–AKT signalling. J Pathol. 2011;224(3):344–354. doi: 10.1002/path.2908. [DOI] [PubMed] [Google Scholar]
- Calabrese C, Poppleton H, Kocak M, et al. A perivascular niche for brain tumor stem cells. Cancer Cell. 2007;11(1):69–82. doi: 10.1016/j.ccr.2006.11.020. [DOI] [PubMed] [Google Scholar]
- Chen MH, Wilson CW, Chuang PT. Snapshot: hedgehog signaling pathway. Cell. 2007;130(2):386. doi: 10.1016/j.cell.2007.07.017. [DOI] [PubMed] [Google Scholar]
- Suling L, Gabriela D, Ilia DM, et al. Hedgehog signaling and bmi-1 regulate self-renewal of normal and malignant human mammary stem cells. Cancer Res. 2006;66(12):6063–6071. doi: 10.1158/0008-5472.CAN-06-0054. [DOI] [PMC free article] [PubMed] [Google Scholar]
- Shahi MH, Afzal M, Sinha S, et al. Regulation of sonic hedgehog–GLI1 downstream target genes PTCH1, Cyclin D2, Plakoglobin, PAX6 and NKX2.2 and their epigenetic status in medulloblastoma and astrocytoma. BMC Cancer. 2010;10(1):614. doi: 10.1186/1471-2407-10-614. [DOI] [PMC free article] [PubMed] [Google Scholar]
- O'Brien CA, Kreso A, Jamieson CHM. Cancer stem cells and self-renewal. Clin Cancer Res. 2010;16(12):3113–3120. doi: 10.1158/1078-0432.CCR-09-2824. [DOI] [PubMed] [Google Scholar]
- Wang X, Venugopal C, Manoranjan B, et al. Sonic hedgehog regulates Bmi1 in human medulloblastoma brain tumor-initiating cells. Oncogene. 2011;31(2):187–199. doi: 10.1038/onc.2011.232. [DOI] [PubMed] [Google Scholar]
- Yan GN, Lv YF, Yang L, et al. Glioma stem cells enhance endothelial cell migration and proliferation via the Hedgehog pathway. Oncol Lett. 2013;6(5):1524–1530. doi: 10.3892/ol.2013.1569. [DOI] [PMC free article] [PubMed] [Google Scholar]
- Rota LM, Lazzarino DA, Ziegler AN, et al. Determining mammosphere-forming potential: application of the limiting dilution analysis. J Mamm Gland Biol Neoplasia. 2012;17(2):119–123. doi: 10.1007/s10911-012-9258-0. [DOI] [PMC free article] [PubMed] [Google Scholar]
- Setti M, Savalli N, Osti D, et al. Functional role of CLIC1 ion channel in glioblastoma-derived stem/progenitor cells. J Natl Cancer Inst. 2013;105(21):1644–1655. doi: 10.1093/jnci/djt278. [DOI] [PMC free article] [PubMed] [Google Scholar]
- Naito S, von Eschenbach AC, Giavazzi R, et al. Growth and metastasis of tumor cells isolated from a human renal cell carcinoma implanted into different organs of nude mice. Cancer Res. 1986;46(8):4109–4115. [PubMed] [Google Scholar]
- Wang H, Zhang D, Wu W, et al. Overexpression and gender-specific differences of SRC-3 (SRC-3/AIB1) immunoreactivity in human non-small cell lung cancer: an in vivo study. J Histochem Cytochem. 2010;58(12):1121–1127. doi: 10.1369/jhc.2010.956979. [DOI] [PMC free article] [PubMed] [Google Scholar]
- Korkolopoulou P, Konstantinidou AE, Kavantzas N, et al. Morphometric microvascular characteristics predict prognosis in superficial and invasive bladder cancer. Virchows Arch. 2001;438(6):603–611. doi: 10.1007/s004280100400. [DOI] [PubMed] [Google Scholar]
- Kenney AM, Cole MD, Rowitch DH. Nmyc upregulation by sonic hedgehog signaling promotes proliferation in developing cerebellar granule neuron precursors. Development. 2003;130(1):15–28. doi: 10.1242/dev.00182. [DOI] [PubMed] [Google Scholar]
- Oliver TG, Grasfeder LL, Carroll AL, et al. Transcriptional profiling of the Sonic hedgehog response: a critical role for N-myc in proliferation of neuronal precursors. Proc Natl Acad Sci USA. 2003;100(12):7331–7336. doi: 10.1073/pnas.0832317100. [DOI] [PMC free article] [PubMed] [Google Scholar]
- Ligon KL, Huillard E, Mehta S, et al. Olig2-regulated lineage-restricted pathway controls replication competence in neural stem cells and malignant glioma. Neuron. 2007;53(4):503–517. doi: 10.1016/j.neuron.2007.01.009. [DOI] [PMC free article] [PubMed] [Google Scholar]
- Nagata S, Hirano K, Kanemori M, et al. Self-renewal and pluripotency acquired through somatic reprogramming to human cancer stem cells. PLoS One. 2012;7(11):e48699. doi: 10.1371/journal.pone.0048699. [DOI] [PMC free article] [PubMed] [Google Scholar]
- Takezaki T, Hide T, Takanaga H, et al. Essential role of the Hedgehog signaling pathway in human glioma-initiating cells. Cancer Sci. 2011;102(7):1306–1312. doi: 10.1111/j.1349-7006.2011.01943.x. [DOI] [PMC free article] [PubMed] [Google Scholar]
- Hu YY, Zheng MH, Cheng G, et al. Notch signaling contributes to the maintenance of both normal neural stem cells and patient-derived glioma stem cells. BMC Cancer. 2011;11(1):82. doi: 10.1186/1471-2407-11-82. [DOI] [PMC free article] [PubMed] [Google Scholar]
- Nager M, Bhardwaj D, Cantí C, et al. β-catenin signalling in glioblastoma multiforme and glioma-initiating cells. Chemother Res Pract. 2012;2012:1–7. doi: 10.1155/2012/192362. [DOI] [PMC free article] [PubMed] [Google Scholar]
- Santisteban M, Reiman JM, Asiedu MK, et al. Immune-induced epithelial to mesenchymal transition in vivo generates breast cancer stem cells. Cancer Res. 2009;69(7):2887–2895. doi: 10.1158/0008-5472.CAN-08-3343. [DOI] [PMC free article] [PubMed] [Google Scholar]
- Gupta PB, Chaffer CL, Weinberg RA. Cancer stem cells: mirage or reality? Nat Med. 2009;15(9):1010–1012. doi: 10.1038/nm0909-1010. [DOI] [PubMed] [Google Scholar]
- Iwasaki H, Suda T. Cancer stem cells and their niche. Cancer Sci. 2009;100(7):1166–1172. doi: 10.1111/j.1349-7006.2009.01177.x. [DOI] [PMC free article] [PubMed] [Google Scholar]
- Barami K. Relationship of neural stem cells with their vascular niche: implications in the malignant progression of gliomas. J Clin Neurosci. 2008;15(11):1193–1197. doi: 10.1016/j.jocn.2008.01.002. [DOI] [PubMed] [Google Scholar]
- Christensen K, Schrøder HD, Kristensen BW. CD133+ niches and single cells in glioblastoma have different phenotypes. J Neurooncol. 2010;104(1):129–143. doi: 10.1007/s11060-010-0488-y. [DOI] [PubMed] [Google Scholar]
- Charles N, Ozawa T, Squatrito M, et al. Perivascular nitric oxide activates notch signaling and promotes stem-like character in PDGF-induced glioma cells. Cell Stem Cell. 2010;6(2):141–152. doi: 10.1016/j.stem.2010.01.001. [DOI] [PMC free article] [PubMed] [Google Scholar]
- Butler JM, Kobayashi H, Rafii S. Instructive role of the vascular niche in promoting tumour growth and tissue repair by angiocrine factors. Nat Rev Cancer. 2010;10(2):138–146. doi: 10.1038/nrc2791. [DOI] [PMC free article] [PubMed] [Google Scholar]
- Charalambous C, Virrey J, Kardosh A, et al. Glioma-associated endothelial cells show evidence of replicative senescence. Exp Cell Res. 2007;313(6):1192–1202. doi: 10.1016/j.yexcr.2006.12.027. [DOI] [PubMed] [Google Scholar]
- Charalambous C, Chen TC, Hofman FM. Characteristics of tumor-associated endothelial cells derived from glioblastoma multiforme. Neurosurg Focus. 2006;20(4):E22. doi: 10.3171/foc.2006.20.4.e22. [DOI] [PubMed] [Google Scholar]
- Hovinga KE, Shimizu F, Wang R, et al. Inhibition of notch signaling in glioblastoma targets cancer stem cells via an endothelial cell intermediate. Stem Cells. 2010;28(6):1019–1029. doi: 10.1002/stem.429. [DOI] [PMC free article] [PubMed] [Google Scholar]
- Zhu TS, Costello MA, Talsma CE, et al. Endothelial cells create a stem cell niche in glioblastoma by providing NOTCH ligands that nurture self-renewal of cancer stem-like cells. Cancer Res. 2011;71(18):6061–6072. doi: 10.1158/0008-5472.CAN-10-4269. [DOI] [PMC free article] [PubMed] [Google Scholar]
- Lu J, Ye XC, Fan F, et al. Endothelial cells promote the colorectal cancer stem cell phenotype through a soluble form of Jagged-1. Cancer Cell. 2013;23(2):171–185. doi: 10.1016/j.ccr.2012.12.021. [DOI] [PMC free article] [PubMed] [Google Scholar]
- Hambardzumyan D, Becher OJ, Rosenblum MK, et al. PI3K pathway regulates survival of cancer stem cells residing in the perivascular niche following radiation in medulloblastoma in vivo. Genes Dev. 2008;22(4):436–448. doi: 10.1101/gad.1627008. [DOI] [PMC free article] [PubMed] [Google Scholar]
- Xu Q, Yuan XP, Liu GT, et al. Hedgehog signaling regulates brain tumor-initiating cell proliferation and portends shorter survival for patients with PTEN-coexpressing glioblastomas. Stem Cells. 2008;26(12):3018–3026. doi: 10.1634/stemcells.2008-0459. [DOI] [PubMed] [Google Scholar]
- Kool M, Korshunov A, Remke M, et al. Molecular subgroups of medulloblastoma: an international meta-analysis of transcriptome, genetic aberrations, and clinical data of WNT, SHH, Group 3, and Group 4 medulloblastomas. Acta Neuropathol. 2012;123(4):473–484. doi: 10.1007/s00401-012-0958-8. [DOI] [PMC free article] [PubMed] [Google Scholar]
- Pugh TJ, Weeraratne SD, Archer TC, et al. Medulloblastoma exome sequencing uncovers subtype-specific somatic mutations. Nature. 2012;488(7409):106–110. doi: 10.1038/nature11329. [DOI] [PMC free article] [PubMed] [Google Scholar]
- Goodrich LV, Milenkovic L, Higgins KM, et al. Altered neural cell fates and medulloblastoma in mouse patched mutants. Science. 1997;277(5329):1109–1113. doi: 10.1126/science.277.5329.1109. [DOI] [PubMed] [Google Scholar]
- Michael LE, Westerman BA, Ermilov AN, et al. Bmi1 is required for hedgehog pathway-driven medulloblastoma expansion. Neoplasia. 2008;10(12):1343–1349. doi: 10.1593/neo.81078. [DOI] [PMC free article] [PubMed] [Google Scholar]
- Gerardo Valadez J, Grover VK, Carter MD, et al. Identification of Hedgehog pathway responsive glioblastomas by isocitrate dehydrogenase mutation. Cancer Lett. 2013;328(2):297–306. doi: 10.1016/j.canlet.2012.10.002. [DOI] [PMC free article] [PubMed] [Google Scholar]
- Clement V, Sanchez P, de Tribolet N, et al. HEDGEHOG–GLI1 signaling regulates human glioma growth, cancer stem cell self-renewal, and tumorigenicity. Curr Biol. 2007;17(2):165–172. doi: 10.1016/j.cub.2006.11.033. [DOI] [PMC free article] [PubMed] [Google Scholar]
- Sarangi A, Valadez JG, Rush S, et al. Targeted inhibition of the Hedgehog pathway in established malignant glioma xenografts enhances survival. Oncogene. 2009;28(39):3468–3476. doi: 10.1038/onc.2009.208. [DOI] [PMC free article] [PubMed] [Google Scholar]
- Bar EE, Chaudhry A, Lin A, et al. Cyclopamine-mediated hedgehog pathway inhibition depletes stem-like cancer cells in glioblastoma. Stem Cells. 2007;25(10):2524–2533. doi: 10.1634/stemcells.2007-0166. [DOI] [PMC free article] [PubMed] [Google Scholar]
- Yauch RL, Gould SE, Scales SJ, et al. A paracrine requirement for hedgehog signalling in cancer. Nature. 2008;455(7211):406–410. doi: 10.1038/nature07275. [DOI] [PubMed] [Google Scholar]
- Ehtesham M, Sarangi A, Valadez JG, et al. Ligand-dependent activation of the hedgehog pathway in glioma progenitor cells. Oncogene. 2007;26(39):5752–5761. doi: 10.1038/sj.onc.1210359. [DOI] [PubMed] [Google Scholar]
- Becher OJ, Hambardzumyan D, Fomchenko EI, et al. Gli activity correlates with tumor grade in platelet-derived growth factor-induced gliomas. Cancer Res. 2008;68(7):2241–2249. doi: 10.1158/0008-5472.CAN-07-6350. [DOI] [PubMed] [Google Scholar]
- Kasperczyk H, Baumann B, Debatin KM, et al. Characterization of sonic hedgehog as a novel NF-κB target gene that promotes NF-κB-mediated apoptosis resistance and tumor growth in vivo. FASEB J. 2009;23(1):21–33. doi: 10.1096/fj.08-111096. [DOI] [PubMed] [Google Scholar]
- Singh AP, Arora S, Bhardwaj A, et al. CXCL12/CXCR4 protein signaling axis induces sonic hedgehog expression in pancreatic cancer cells via extracellular regulated kinase- and Akt kinase-mediated activation of nuclear factor B: implications for bidirectional tumor-stromal interactions. J Biol Chem. 2012;287(46):39115–391. doi: 10.1074/jbc.M112.409581. [DOI] [PMC free article] [PubMed] [Google Scholar]
- Moran CM, Myers CT, Lewis CM, et al. Hedgehog regulates angiogenesis of intersegmental vessels through the VEGF signaling pathway. Dev Dyn. 2012;241(6):1034–1042. doi: 10.1002/dvdy.23795. [DOI] [PMC free article] [PubMed] [Google Scholar]
- Folkins C, Shaked Y, Man S, et al. Glioma tumor stem-like cells promote tumor angiogenesis and vasculogenesis via vascular endothelial growth factor and stromal-derived factor 1. Cancer Res. 2009;69(18):7243–7251. doi: 10.1158/0008-5472.CAN-09-0167. [DOI] [PMC free article] [PubMed] [Google Scholar]
- Kenig S, Alonso MB, Mueller MM, et al. Glioblastoma and endothelial cells cross-talk, mediated by SDF-1, enhances tumour invasion and endothelial proliferation by increasing expression of cathepsins B, S, and MMP-9. Cancer Lett. 2010;289(1):53–61. doi: 10.1016/j.canlet.2009.07.014. [DOI] [PubMed] [Google Scholar]
- Robles Irizarry L, Hambardzumyan D, Nakano I, et al. Therapeutic targeting of VEGF in the treatment of glioblastoma. Expert Opin Ther Targets. 2012;16(10):973–984. doi: 10.1517/14728222.2012.711817. [DOI] [PubMed] [Google Scholar]
- Huang Z, Cheng L, Guryanova OA, et al. Cancer stem cells in glioblastoma – molecular signaling and therapeutic targeting. Protein Cell. 2010;1(7):638–655. doi: 10.1007/s13238-010-0078-y. [DOI] [PMC free article] [PubMed] [Google Scholar]
Associated Data
This section collects any data citations, data availability statements, or supplementary materials included in this article.
Supplementary Materials
Supplementary materials and methods
Gli1 expression of perivascular glioma cells were significantly higher than those far from microvessels in human GBM samples
Endothelial cells promote the CSC phenotype in murine and human glioma cells
Knockdown of HH pathway inhibits endothelial cell-mediated regulation of glioma cells
Representative H&E-stained and IHC images of human glioma samples used in the prognostic study
IHC analysis of PTCH expression in human glioma samples
Clinical features of patients with glioma
Sequences of each primer pair used in this study