

Abstract
Abstract
Proteaceae species in south-western Australia occur on phosphorus- (P) impoverished soils. Their leaves contain very low P levels, but have relatively high rates of photosynthesis. We measured ribosomal RNA (rRNA) abundance, soluble protein, activities of several enzymes and glucose 6-phosphate (Glc6P) levels in expanding and mature leaves of six Proteaceae species in their natural habitat. The results were compared with those for Arabidopsis thaliana. Compared with A. thaliana, immature leaves of Proteaceae species contained very low levels of rRNA, especially plastidic rRNA. Proteaceae species showed slow development of the photosynthetic apparatus (‘delayed greening’), with young leaves having very low levels of chlorophyll and Calvin–Benson cycle enzymes. In mature leaves, soluble protein and Calvin–Benson cycle enzyme activities were low, but Glc6P levels were similar to those in A. thaliana. We propose that low ribosome abundance contributes to the high P efficiency of these Proteaceae species in three ways: (1) less P is invested in ribosomes; (2) the rate of growth and, hence, demand for P is low; and (3) the especially low plastidic ribosome abundance in young leaves delays formation of the photosynthetic machinery, spreading investment of P in rRNA. Although Calvin–Benson cycle enzyme activities are low, Glc6P levels are maintained, allowing their effective use.
Keywords: Banksia, carbon metabolism, delayed greening, glucose 6-phosphate, Hakea, PPUE, Rubisco, shikimate dehydrogenase
Introduction
Australia in general (Beadle 1962), and south-western Australia in particular (McArthur 1991; Wyrwoll et al. 2014), is known for its severely nutrient-impoverished soils. Among the macronutrients, phosphorus (P) is the least available nutrient because of prolonged soil weathering and the low P content of the parent material (Lambers et al. 2010; Laliberté et al. 2012). Non-mycorrhizal Proteaceae are an important component of the vegetation on the most severely P-impoverished soils (Lambers et al. 2010, 2013; Hayes et al. 2014). Species in this family typically form cluster roots that effectively mine P by releasing large amounts of low-molecular weight carboxylates to release sorbed P from soil particles (Lambers et al. 2008b). It is also striking that mature leaves of Proteaceae species from south-western Australia exhibit relatively high rates of photosynthesis, despite their extremely low leaf P concentrations ([P]) (Wright et al. 2005; Denton et al. 2007; Lambers et al. 2012b). This contrasts with most other species, where P deficiency usually results in low rates of photosynthesis per unit leaf area (Brooks et al. 1988; Fredeen et al. 1990; Kirschbaum & Tompkins 1990). Because phosphate rock is a non-renewable resource (Gilbert 2009; Elser 2012), our aim was to enhance our understanding of the biochemical basis for the high photosynthetic P-use efficiency (PPUE) of Proteaceae species and explore if this trait is worth pursuing towards developing more P-efficient crops (Lambers et al. 2011; Veneklaas et al. 2012).
Studies on barley, Arabidopsis thaliana, spinach and other species that typically grow on relatively fertile soils have shown that the major organic P fractions in leaves are nucleic acids (40–60%), phospholipids (26–39%) and P-containing metabolites (20–30%) (Veneklaas et al. 2012). Ribosomal RNA (rRNA) comprises the major component of the nucleic acid fraction (Dyer et al. 1971; Raven 2012). The major P-containing metabolites include phosphorylated intermediates of glycolysis and the Calvin–Benson cycle, and free nucleotides and nucleotide sugars (Arrivault et al. 2009). Phospholipids are major membrane components (Jouhet et al. 2004; Andersson et al. 2005). In these species, a limiting P supply leads to a general decrease in the level of RNA (Hewitt et al. 2005), a decrease in the levels of sugar phosphates and nucleotides (Brooks et al. 1988; Hurry et al. 2000; Zrenner et al. 2006; Morcuende et al. 2007), and partial replacement of phospholipids by galactolipids (Dörmann & Benning 2002; Kelly et al. 2003). Phosphorus limitation also leads to the induction of specialised glycolytic enzymes that do not require nucleotides (Theodorou & Plaxton 1993; Plaxton & Tran 2011) and the induction of extracellular phosphatases (Del Pozo et al. 1999; Li et al. 2002; Plaxton & Tran 2011).
High rates of photosynthesis require a fine balance between the levels of free orthophosphate (Pi) and phosphorylated intermediates, with photosynthesis being inhibited when free Pi is depleted (Heldt et al. 1977, see Stitt et al. 2010 for a recent review, Stitt & Quick 1989). Orthophosphate is incorporated by the thylakoid ATPase into ATP, transferred to phosphorylated intermediates via the ATP-consuming reactions of the Calvin–Benson cycle, and released again during the synthesis of end-products like sucrose and starch (Heldt 2005; Stitt et al. 2010). In principle, a lower level of Pi, adenine nucleotides and phosphorylated intermediates might be compensated by having higher levels of enzymes. This would be analogous to the increase in enzyme activities that occurs at low temperature, and which partly compensates for the decrease in Kcat at low temperature (Stitt & Hurry 2002; Usadel et al. 2008). The levels of enzymes involved in sucrose synthesis increase markedly when A. thaliana is grown at a low P supply (Hurry et al. 2000; Ciereszko et al. 2001; Morcuende et al. 2007). Enzymes for sucrose synthesis also increase markedly, and the levels of Calvin–Benson cycle enzymes remain high or increase slightly in the pho1 mutant, which is defective in transport of P to the shoot (Hurry et al. 2000). However, it should be noted that the synthesis and maintenance of high levels of enzymes will require investment of P in the protein synthesis machinery, which itself represents a major fraction of P in low-P leaves (Veneklaas et al. 2012).
None of the studies of acclimations to low P cited earlier addressed species that are adapted to extremely low P conditions. In a previous paper, we showed that following leaf expansion in six Proteaceae species growing in the field on severely P-impoverished soils in south-western Australia, phospholipids are much more extensively replaced by galactolipids and sulfolipids than in other species studied to date (Lambers et al. 2012b). For the same species, here, we present results on the abundance of rRNA, representative metabolites [starch, glucose 6-phosphate (Glc6P) ], and a set of enzymes involved in carbon fixation and central metabolism, which represent a major component of the protein pool in leaves. We compare the results for Proteaceae species growing in the field with those obtained on the model dicot A. thaliana grown at a range of controlled conditions in a growth room and in a greenhouse under P-sufficient or P-limited conditions. Previous research on A. thaliana prompted the hypothesis that P-efficient Proteaceae invest relatively little P in intermediates of carbon metabolism, and compensate by maintaining high levels of enzymes. However, we also consider the alternative possibility that the maintenance of high levels of enzymes may not be P-neutral, because this will require high rates of protein synthesis, and, hence, a larger investment of P in rRNA (Veneklaas et al. 2012).
Materials and Methods
Field site and Proteaceae species description
As before, we chose to test our hypotheses using plants growing at a location that is well-known for its high plant biodiversity (particularly of Proteaceae) and its ancient, nutrient-impoverished soils, Lesueur National Park in south-western Australia (Hopper & Gioia 2004; Mucina et al. 2014). The sites chosen were the same as those used for our recent study on replacement of phospholipids by other lipids during leaf development (Lambers et al. 2012b), with the exception of the site for Hakea prostrata, which had been burned since our previous measurements. For determination of leaf [N] in H. prostrata, we sampled both at the original site and at a nearby site that was not burned, finding no significant difference. Data on leaf morphological and chemical traits were collected for both young expanding and mature one-year-old leaves.
Growth of A. thaliana
Arabidopsis thaliana plants (Col-0 accession) were grown under a range of controlled conditions at the Max Planck Institute of Molecular Plant Physiology (Potsdam, Germany), including conditions that decrease growth of P-replete plants and conditions that decrease growth because of low P supply. To decrease growth rates in P-replete plants, we used a short photoperiod. Seeds of the Col-0 accession were germinated and seedlings grown for one week in a 16 h light [150 μmol photons m−2s−1, 20 °C, 75% relative humidity (RH) ] 8 h dark (6 °C, 75% RH) regime in a standard peat-vermiculite-sand (6:3:1) substrate (Stender AG, 15926 Luckau, Germany). After another week in an 8 h light (160 μmol photons m−2s−1, 20 °C, 60% RH), 16 h dark (16 °C, 75% RH) regime, individual plants were transferred to pots (6 cm diameter) filled with either standard substrate, and placed for another nine days in a Percival AR-36 L2 growth chamber (Percival-Scientific, Perry, IA, USA) set to the different photoperiods tested. The pots were irrigated twice a week with deionized water. All analysed leaf samples were harvested on the same day and within one hour at the beginning and the end of the light period, by snap-freezing in liquid nitrogen (N). Plants were grown at a range of day lengths; the longer day lengths were used for comparison with Proteaceae species growing in their natural habitat, whereas the shorter ones were used to impose conditions where A. thaliana grows very slowly, which is typical for the investigated Proteaceae species. In one experiment, we also harvested leaves at four stages of leaf development from 33-day-old plants growing in an 8 h photoperiod.
To investigate the response of A. thaliana to a decrease in P supply, plants were grown under normal greenhouse conditions with average light intensity of 160 μmol photons m−2s−1, 16 h light and 8 h dark regime (at the Max Planck Institute of Molecular Plant Physiology). Plants were divided into two sets: one set was supplied with a full-nutrient soil, using Osmocote® fertilizer, containing sufficient P (Pi = 15.5 mM), and the other one was supplied with less Osmocote® fertilizer (Pi = 1.1 mM). All analysed leaf samples were harvested between 6 and 8.5 h into the light period by snap-freezing in liquid N. Also, in the P-replete and P-deficient treatments, sets of leaves were harvested along the developmental gradient, in this case in three groups: young leaves (<1–9 mm length), mid-stage (9 mm to second largest), and mature leaves (largest to oldest leaves).
Leaf N analyses
Mature leaves were harvested from plants of similar age and health condition as in Lambers et al. (2012b) from each of the six species (Banksia attenuata R.Br., B. candolleana Meisn., B. menziesii R.Br., H. flabellifolia Meisn., H. neurophylla Meisn., H. prostrata R.Br.). We collected 10 healthy mature leaves per plant from the top third of the crown from three replicate plants within a 100 m radius. Fresh weight (FW) was determined immediately after collecting, and then leaves were dried at 70 °C for 48 h, ground using a ball mill, and 100 mg analysed for total N following the Dumas method (Buckee 1994). N was quantified with an Elementar Vario Macro (Hanau, Germany) directly after combustion and analysis of the evolved gases.
Enzyme and metabolite analyses
Leaves collected from the same plants as those previously used for gas-exchange measurements (Lambers et al. 2012b) were snap-frozen in liquid N immediately after field collection, with the exception of leaves used to assess variation in starch concentration from dawn till midday, which were collected in December 2012. Fresh weights were determined and the samples were transferred on dry ice to the Max Planck Institute of Molecular Plant Physiology. Approximately 200 mg of fresh material was ground to a fine powder and aliquoted (samples ca. 20 mg FW) with a cryorobot (Labman Automation, Stokeley, UK) for use in enzyme and metabolite analyses. The aliquots were stored at −80 °C until use. Enzyme extractions took around 1 min per sample, and enzyme activities were measured as in Gibon et al. (2004, 2009) and Sulpice et al. 2010, 2007) using the dilutions and incubation times indicated in the Supporting Information Table S1.
For measurements of metabolites and structural components, assays were performed following ethanol extraction at high tissue dilution, using 0.08, 0.2, 0.06 and 0.08 mg FW per assay for soluble proteins, starch, amino acids and the major P-containing small metabolite Glc6P, respectively (Gibon et al. 2009; Sulpice et al. 2009). Glc6P occupies a central position in metabolism, being involved in the pathways of sucrose and starch synthesis, sucrose and starch degradation, cell wall synthesis, and glycolysis. Recoveries were determined as described for enzyme activities (see Supporting Information Table S1) and for proteins, starch, amino acids and Glc6P were 86, 107, 88 and 81%, respectively. Measurements were only possible for abundant metabolites that could be detected with great sensitivity, because of interfering substances in the extracts. This problem could not be circumvented by preparation of extracts with trichloroacetic acid for measurement in dual wavelength photometers.
We measured a set of enzymes from the Calvin–Benson cycle, starch synthesis, sucrose metabolism, glycolysis, organic acid metabolism (fumarase) and amino acid biosynthesis in immature and mature leaf material from the six Proteaceae species (see Supporting Information Table S1 for information on the enzymes and abbreviations). The reliability of the extraction and assay was checked by preparing a powder from six Banksia and Hakea species, and a standard powder prepared from greenhouse-grown A. thaliana, extracting the powders separately or after mixing them in a 1:1 ratio, and determining enzyme activities in each extract. Recoveries of enzyme activities were 78–130% (Supporting Information Table S1). This effective recovery of enzyme activity is remarkable, because the Proteaceae leaves contain large amounts of gums and other secondary metabolites that complicate many biochemical and molecular analyses. The good recovery of enzyme activities is probably due to the high sensitivity of the enzyme assays used in this study (Gibon et al. 2004). This allows extracts to be prepared at high dilution and used at even higher dilution in the enzyme assays. Rubisco was assayed immediately after extraction, and after incubation with a high CO2 concentration at pH 8 to fully carbamylate the lysine in the active site.
Extraction of RNA, cDNA synthesis and quantification of rRNA
Ribosomal RNA represents a major pool of P in organic compounds (see Introduction). Therefore, we used methods that were previously developed to quantify ribosome abundance in A. thaliana (Piques et al. 2009; Pal et al. 2013) to determine ribosome abundance in immature and mature leaves of the Proteaceae species. Briefly, RNA is extracted, a mixture of oligo (dT)20 primers and random hexamers are used to generate cDNA, and qRT-PCR is then used to measure the levels of cytosolic 18SrRNA and plastidic 16SrRNA, using specific primer pairs for each RNA species. To allow reliable quantification, a set of six external RNA species were added at different concentrations to the powdered plant material before extraction. These external standards were used to control for differential RNA loss during extraction and differential efficacy of amplification of RNA to cDNA in different plant material. Ribosome number was calculated by determining the amounts of the small subunits of cytosolic and plastidic rRNAs by qRT-PCR, and we used these to calculate plastidic and cytosolic ribosome abundance, assuming that each ribosomal RNA corresponds to one ribosome (Piques et al. 2009; Pal et al. 2013). Absolute quantification of total rRNA species was performed as in Piques et al. (2009), with some modifications.
One milligram FW aliquots of Proteaceae leaf material were homogenized with 800 μL of RNA extraction buffer [1 M Tris/HCl, 1% (v/v) SDS, 10 mM ethylenediaminetetraacetic acid, 2% (w/v) PVP, 2% (w/v) PVPP, and 0.5% (v/v) β-mercaptoethanol] and spiked with a mix of the six artificial Poly(A) + RNAs (Ambion/Life Technologies GmbH, Darmstadt, Germany) in the dynamic range 9.6 × 10¹² to 3.75 × 10¹⁰ copy number per gram FW. After centrifugation at 12 000 g for 2 min, the supernatant was transferred, mixed with an equal volume of phenol/chloroform/isoamylalcohol (25/24/1) and then centrifuged at 12 000 g for 15 min. The aqueous phase was transferred to a new tube and was again mixed with phenol/chloroform/isoamylalcohol (25/24/1). This step was repeated until the interface appeared clear. The aqueous phase was then transferred to a new tube and mixed with chloroform/isoamylalcohol (24:1, v/v) and centrifuged at 12 000 g for 15 min. The aqueous phase was transferred and mixed with 3 M Na acetate (10/1, v/v) and 100% ethanol (1/2.5, v/v), and then incubated at −80 °C for 30 min. The RNA was then pelleted by centrifugation at 12 000 g for 30 min and the pellet dissolved in 200–400 μL water. A solution of LiCl (4 M) was added (v/v) and the mix stored at −4 °C overnight. The mix was then centrifuged at 4 °C for 10 min at 15 682 g, the supernatant discarded and the pellet washed with 500 μL of 2 M LiCl. Finally, the pellet was rinsed with 500 μL of 70% (v/v) ethanol, air dried and dissolved in 30 μL of RNAse-free water. The cDNA was synthesized with 5–50 ng of total DNase I-treated RNAs, a mixture of oligo-d(T)20 primers (100 ng) and random hexamers (0.1 nmol) using the SuperScript III First-Strand Synthesis System (Invitrogen/Life Technologies GmbH, Darmstadt, Germany), according to the manufacturer's instructions. qRT-PCR reactions were performed in a volume of 10 μL with 1/500, 1/50 and 1/5 dilutions of the cDNAs and 200 nM of each gene-specific primer. Power SYBR Green PCR Master Mix (Applied Biosystems/Life Technologies GmbH, Darmstadt, Germany) was used to monitor double-strand DNA synthesis. Standard curves for the six spike-in controls always had R2 values > 0.98. The threshold cycle (CT) values and slopes were similar in the various Proteaceae species to those obtained with A. thaliana (Supporting Information Table S2), confirming that the RNA extraction, cDNA synthesis and qRT-PCR reactions were not inhibited in extracts from the Proteaceae species, and validating the quantification of rRNA copy number. The external standards also provided an internal calibration, which was used to convert CT units into rRNA copy number. Standard curves were used to calculate the abundance (copy per gram FW) of the cytosolic and plastidic ribosomes. The primers used to amplify the genes for the cytosolic, and plastidic small subunit rRNAs were designed using Hakea rRNA sequence, as in Piques et al. (2009) and Pyl et al. (2012). All primers are listed in Supporting Information Table S3.
For comparison, we analysed cytosolic and plastidic rRNA at four stages of leaf development in 33-day-old P-replete A. thaliana growing in an 8 h light/16 h dark cycle (irradiance 150 μmol m−2s−1). Four groups of leaves were harvested corresponding to the oldest four leaves (group a), all other leaves with a length >9 mm (group b), all leaves between 4 and 9 mm (group c) and all leaves with a length <4 mm (group d). It is difficult to specify a maximum size for A. thaliana leaves, as there is a strong tendency for successive leaves to attain a larger final size. The largest leaves in these rosettes at the time of harvest were about 17 mm long, indicating that leaves <9 and <4 mm have attained less than 53 and 23% of their final length, respectively. Physiologically, these sets of leaves approximately correspond to (1) mature leaves; (2) leaves that are still slowly expanding; (3) rapidly expanding leaves; and (4) leaves in the early stage of expansion growth or the cell division stage (Baerenfaller et al. 2012). The average size of leaves in groups c and d is about 20 and 4% of the final leaf size, respectively. Estimates of leaf expansion rates in comparable plants were 0.012, 0.114, 0.362 and 0.528 mm2 mm−2 day−1 (Supporting Information Table S4).
Statistical analysis
Differences between young and mature leaves of Proteaceae for different metabolites and enzyme activities were tested using linear mixed-effect models (Pinheiro & Bates 2000), with random intercepts per species. To test for differences between mature leaves of Proteaceae and A. thaliana leaves, we firstly averaged the data for each Proteaceae species as well as for each photoperiod level (for A. thaliana), and then used linear models (Pinheiro & Bates 2000) on these averaged data. Residuals were visually inspected for heteroscedasticity and particular error structures were specified if they significantly improved the models, as evaluated via likelihood ratio tests (Pinheiro & Bates 2000). Analyses were conducted in the R Environment (R Development Core Team 2012), using the ‘nlme’ package (Pinheiro & Bates 2000).
Results
Leaf structure
Leaves of all six Proteaceae species showed very high values for leaf mass per unit area (LMA) and leaf dry matter content (LDMC) compared with those of A. thaliana (Table 1). This is accounted for by the large proportion of sclerenchymatic tissue in the leaf blade as well as a very thick midrib (Fig. 1). The leaf of B. menziesii had a double epidermis (Fig. 1), which is common for this genus (Swart 1988; Edwards et al. 2000; Mast & Givnish 2002; Jordan et al. 2005). Leaf thickness was calculated from these primary data, showing values for young leaves of 222–600 μm and for mature leaves of 504–780 μm, in the same range as described based on microscopic observations (Hassiotou et al. 2009; Lambers et al. 2012b) or using digital callipers (Hassiotou et al. 2010).
Table 1.
LMA, LDMC and information on chemical composition of young, expanding leaves and fully expanded, mature leaves of Banksia and Hakea species growing in their natural habitat
| Species | Leaf developmental stage | LMA (g DW m−2) | LDMC (g DW g−1 FW) | Leaf thickness (μm) | Leaf [N] (mg g−1 DW) | Leaf [P] (mg g−1 DW) | Leaf N:P | Chlorophyll a/b ratio |
|---|---|---|---|---|---|---|---|---|
| B. attenuata | Young | 195 ± 3 | 0.40 ± 0.01 | 488 | ND | 0.43 ± 0.013 | ND | 0.9 |
| B. attenuata | Mature | 310 ± 3 | 0.60 ± 0.01 | 517 | 9.2 ± 0.08 | 0.15 ± 0.020 | 60.5 | 1.8 |
| B. candolleana | Young | 240 ± 8 | 0.40 ± 0.01 | 600 | ND | 0.48 ± 0.032 | ND | 1.1 |
| B. candolleana | Mature | 468 ± 15 | 0.60 ± 0.02 | 780 | 7.5 ± 0.04 | 0.20 ± 0.013 | 38.2 | 2.0 |
| B. menziesii | Young | 224 ± 4 | 0.38 ± 0.01 | 589 | ND | 0.37 ± 0.039 | ND | 1.1 |
| B. menziesii | Mature | 345 ± 4 | 0.55 ± 0.02 | 627 | 8.3 ± 0.06 | 0.20 ± 0.008 | 40.6 | 2.3 |
| H. flabellifolia | Young | 181 ± 12 | 0.41 ± 0.06 | 441 | ND | 0.48 ± 0.101 | ND | 1.3 |
| H. flabellifolia | Mature | 315 ± 152 | 0.45 ± 0.04 | 700 | 11.8 ± 0.05 | 0.12 ± 0.018 | 32.3 | 2.3 |
| H. neurophylla | Young | 168 ± 12 | 0.38 ± 0.01 | 442 | ND | 0.38 ± 0.052 | ND | 1.2 |
| H. neurophylla | Mature | 371 ± 10 | 0.59 ± 0.00 | 629 | 8.0 ± 0.11 | 0.15 ± 0.014 | 53.3 | 2.7 |
| H. prostrata | Young | 100 ± 2 | 0.45 ± 0.04 | 222 | ND | 0.86 ± 0.046 | ND | 1.5 |
| H. prostrata | Mature | 272 ± 10 | 0.54 ± 0.01 | 504 | 12.7 ± 0.12 | 0.29 ± 0.005 | 44.4 | 2.7 |
| Arabidopsis thaliana | Mature leaves | 17.4 ± 0.4 | 0.08 ± 0.00 | 212 | 75 ± 0.26 | 4.7 ± 0.3 | 16 | 3.9 |
Mature leaves were produced in the preceding year, but were not senescent, because leaves of the investigated species continue to function for two years or more. Values are means ± SE (n = 6; or n = 3 for leaf [N] ). Leaf thickness was calculated from the values of LMA and LDMC (Lambers et al. 2008a). Data on leaf [P] in Proteaceae species are from Lambers et al. (2012b). Data for A. thaliana on LMA, LMA and leaf thickness are for plants grown at a 12 h day length under conditions identical to those used for the present plants; data on leaf [N] are from the literature (Tschoep et al. 2009). In a separate study where Arabidopsis plants were grown in long days (14 h/10 h) in a glasshouse, leaf protein was measured for both young (19.2 ± 0.4 mg g−1 FW) and old (14.9 ± 0.9 mg g−1 FW) leaves; for further data on leaf developmental stage-dependent changes in protein concentration in Arabidopsis, see Supporting Information Table S4. DW, dry weight; FW, fresh weight; LMA, leaf mass per unit area; LDMC, leaf dry matter content; N, nitrogen; ND, not determined; P, phosphorus.
Figure 1.

Anatomy and morphology of selected Proteaceae species used in this study. Top left: Cross section of a mature leaf of Banksia menziesii, showing a double epidermis, stomatal crypts, mesophyll (fluorescing red), sclerenchyma and a thick midrib. Top right: Cross section of an old leaf of B. menziesii, showing a double epidermis, stomatal crypts that are covered with trichomes, mesophyll, sclerenchymatic fibres and vascular tissue. Bottom left: Habitat photo of Hakea flabellifolia, showing dark green previous years’ foliage and yellow young expanding leaves (photo: Marion L. Cambridge). Bottom right: Habitat photo of Banksia attenuata, showing dark green previous years’ foliage and yellow young expanding leaves; both were used for gas-exchange measurements presented in Lambers et al. (2012b) (photo: Marion L. Cambridge).
Morphological features like metabolically inactive sclerenchymatic tissues and large epidermal cells (Fig. 1) areimportant to take into account when expressing metabolic parameters on a dry or FW basis. We therefore expressed many of the measured metabolites, processes or activities on an area or protein basis. Information about the rates of photosynthesis in this material was published in Lambers et al. (2012b). Briefly, the average rates of photosynthesis of Proteaceae species in ambient conditions in the field are very low in young expanding leaves (average 3.3 and range −4.1 to +12.8 μmol CO2 m−2s−1), and high in mature leaves (10–23 μmol CO2 m−2s−1). The rates of mature leaves are approximately 7 μmol CO2 m−2s−1 in A. thaliana (Eckardt et al. 1997). Thus, all Proteaceae species photosynthesize more rapidly than A. thaliana on an area basis. Comparison with the leaf structural information (Table 1) indicates that the mature leaves of the Banksia and Hakea species have, on average, similar rates of photosynthesis on a FW basis (29 nmol CO2 g−1s−1 compared with 33 nmol CO2 g−1s−1 in A. thaliana).
Ribosome abundance
Ribosomal RNA represents a major pool of P in organic compounds in plant leaves (see Introduction), with about half being in cytosolic and half in plastidic ribosomes (Piques et al. 2009; Pal et al. 2013). We investigated the levels of ribosomes, using methods that allowed us to distinguish between cytosolic and plastidic ribosomes. rRNA abundance was analysed in the same immature and mature leaves of the Proteaceae species that were used to measure metabolites, protein and enzyme activities (see later). For comparison, we analysed cytosolic and plastidic rRNA at four stages of leaf development in 33-day-old P-replete A. thaliana growing in an 8 h photoperiod. The sampled immature leaves of the Proteaceae species were approximately 50% of the final size. The groups a, b, c and d leaves of A. thaliana were 60% (fully expanded leaves, note that the size of the first fully expanded leaves is smaller than that of subsequent leaves; data not shown) 78, 20 and 4% of the area of the largest leaf in the rosette; this leaf being among group b leaves (see below for further discussion).
Ribosome abundance (on a FW basis) was much lower in the Proteaceae species than in A. thaliana (Fig. 2a, Supporting Information Table S5. The Proteaceae species contained two to four times less ribosomes than A. thaliana did in mature leaves: 2.96 × 10¹³ to 6.15 × 10¹³ ribosome g−1 FW (or 29.6–61.5 ribosomes pg−1 FW), compared with 11 × 1013 ribosomes g−1 FW (or 110 ribosomes pg−1 FW), respectively (Fig. 2a,b). The difference in ribosome abundance between the Proteaceae species and A. thaliana were strikingly larger in immature leaves (10–40 times).
Figure 2.

Ribosome copy number of young, expanding (red bars) and fully mature (>1 year old; green bars) leaves of six Proteaceae species growing in their natural habitat and of leaves at three stages of leaf development of Arabidopsis thaliana grown in a growth room at a day length of 8 h. Data for leaves of A. thaliana are arranged from youngest (palest green, d) to oldest (darkest green, a), representing: group d, leaves with a length < 4 mm; group c, leaves with a length between 4 and 9 mm; group b, leaves with a length > 9 mm, with the exception of the four oldest leaves; group a, oldest four leaves. Different leaf developmental stages are indicated along the x-axis. Values are means± SE (2 ≤ n ≤ 6). Leaves of the Proteaceae species were harvested during mid-morning; those of A. thaliana one hour before the end of the light period (a) cytosolic ribosome copy number per unit FW; (b) plastidic ribosome copy number per unit FW; (c) cytosolic ribosome copy number per unit soluble protein (d) plastidic ribosome copy number per unit soluble protein.
Ribosome abundance showed a different developmental gradient in the Proteaceae species than in A. thaliana. Total ribosome abundance was the same (H. prostrata, B. candolleana) or only slightly higher (1.4- to 1.5-fold in H. neurophylla, B. menziesii and H. flabellifolia, and twofold in B. attenuata) in young expanding leaves than in mature leaves (Fig. 2a). This contrasts with A. thaliana leaves (Fig. 2a), which showed much higher ribosome numbers in younger leaves. When the oldest five leaves (stage a) are taken as the basis for comparison, ribosome abundance increased by 2.6-, 9.3- and 10.9-fold in leaf groups b, c and d, respectively (corresponding to leaves that are expanding slowly, expanding rapidly or are in the cell division or early expansion stages). The increase in ribosomes in leaf groups c and d is still more than three times and more than four times higher, when they are normalized on leaf group b.
There were also differences in the developmental gradients of cytosolic and plastidic ribosome abundance between A. thaliana and the Proteaceae species (Fig. 2a,b). In mature leaves, the ratio between plastidic and cytosolic ribosomes was close to unity in all of the Proteaceae species and in A. thaliana (see also Piques et al. 2009; Pal et al. 2013). In A. thaliana, a ratio close to unity was also found for group b and group c leaves, decreasing to about 0.3 in the youngest leaf stage (group a). The abundance of plastidic ribosomes per g FW was highest in the rapidly expanding leaves (group c), which contained eight times more plastidic ribosomes on a FW basis than mature leaves. Even the very young leaves of group d contained four times more plastidic ribosomes per unit FW than mature A. thaliana leaves. Based on their size relative to mature leaves, the immature Proteaceae leaves that we sampled in the field are best compared with the group b and c leaves of A. thaliana.
In most of the Proteaceae species the plastidic ribosome:cytosolic ribosome ratio decreased in immature leaves (to ∼0.5 in H. flabellifolia and H. neurophylla; ∼0.25 in B. candolleana, B. menziesii and B. attenuata), remaining close to unity only for H. prostrata). These data point to a very low investment in plastidic ribosome abundance in immature leaves in the Proteaceae species compared with that in immature A. thaliana leaves.
Leaf protein and N concentrations
Since rates of protein synthesis scale with rRNA content (Elser et al. 1996; Matzek & Vitousek 2009), we expected the low investment in rRNA in Proteaceae species to be associated with low levels of soluble protein and total N. Indeed, total soluble protein concentrations were five- to 10-fold lower in mature and immature leaves of the Proteaceae species than in A. thaliana leaves (Fig. 3). We suspect that there are also considerable amounts of protein in the cell wall of the Proteaceae species that would not be extracted by our methods (Albenne et al. 2013). As expected, mature leaf N concentrations of the plants analysed in the present study were also low: 7.5–11.8 mg g−1 dry weight (DW) (Table 1), but somewhat higher than values reported for leaves of B. attenuata and B. menziesii: 5.5 and 5.4 mg N g−1 DW, respectively (Tassone & Majer 1997). A low N concentration is typical for Proteaceae from south-western Australia (Lambers et al. 2012a), and compares with typical minimum and maximum vales of 8.7 ± 0.6 and 40.9 ± 5.7 mg N g−1 DW for 111 C3 species (Reich et al. 1997). The corresponding value in A. thaliana plants grown in the same conditions as used in this study is 75 mg N g−1 DW (Table 2; Tschoep et al. 2009).
Figure 3.
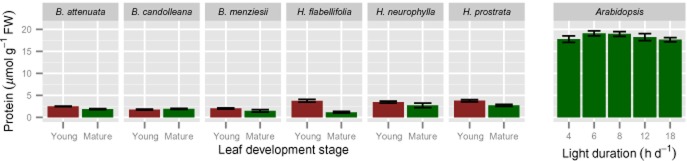
Leaf soluble protein concentrations of young, expanding (red bars) and fully mature (>1 year old in Proteaceae species; green bars) leaves of six Proteaceae species growing in their natural habitat and in Arabidopsis thaliana grown in a growth room at a range of day lengths, as indicated along the x-axis. Leaves of the Proteaceae species were harvested during mid-morning; those of A. thaliana at the end of the day.
Table 2.
Comparison of enzyme activities in mature leaves of Proteaceae species and in Arabidopsis grown in short days (4 h light) and long days (18 h light)
| PEPC | SKDH | PK | AGPase | PGI | Fumarase | TRK | Rubisco (maximal) | PGM | UGPase | TPI | ||
|---|---|---|---|---|---|---|---|---|---|---|---|---|
| Species | ||||||||||||
| Banksia attenuata | 197 | 190 | 244 | 411 | 720 | 469 | 1944 | 2343 | 4077 | 3810 | 123447 | |
| Banksia candolleana | 168 | 100 | 286 | 405 | 822 | 915 | 1542 | 2254 | 3109 | 3736 | 111966 | |
| Banksia menziesii | 249 | 288 | 319 | 1639 | 1318 | 1425 | 4553 | 5652 | 5603 | 7905 | 230121 | |
| Hakea flabellifolia | 258 | 261 | 241 | 832 | 2189 | 1602 | 3018 | 3349 | 7090 | 6137 | 165348 | |
| Hakea neurophylla | 133 | 206 | 157 | 789 | 1670 | 816 | 3561 | 3089 | 7095 | 8412 | 195369 | |
| Hakea prostrata | 218 | 314 | 273 | 1028 | 1857 | 1402 | 3665 | 4094 | 6712 | 8487 | 194482 | |
| Average | 204 | 227 | 253 | 851 | 1429 | 1105 | 3047 | 3463 | 5614 | 6414 | 170122 | |
| Arabidopsis (SD) | 590 | 638 | 605 | 532 | 1162 | 3368 | 4612 | 4536 | 6920 | 5900 | 137842 | |
| Arabidopsis (LD) | 506 | 655 | 769 | 918 | 9045 | 5550 | 5872 | 6665 | 9045 | 7396 | 167678 | |
| Ratio* | 0.34:0.40 | 0.36:0.35 | 0.42:0.33 | 1.60:0.93 | 1.43:1.91 | 0.33:0.20 | 0.66:0.51 | 0.39:0.76 | 0.81:0.62 | 1.09:0.87 | 1.23:1.01 | |
The full data set for the Proteaceae species and for Arabidopsis is shown in Figs 6. Enzyme activities are expressed in nmol g−1 FW min−1. See text and Supporting Information Table S1 for abbreviations. *Ratio between average value in Proteaceae species and that in Arabidopsis in extremely short days (4 h light; top row) or the maximum value in long days (18 h; bottom row light). AGPase, ADP glucose pyrophophorylase; FW, fresh weight; LD, long days (18 h); PEPC, phosphoenolpyruvate carboxylase; PGI, phosphoglucoisomerase; PGM, phosphoglucomutase; PK, pyruvate kinase; SD, short days (4 h); SKDH, shikimate dehydrogenase; TPI, triose phosphate isomerase; TRK, transketolase; UGPase, uridine diphosphate-glucose pyrophosphorylase.
Ribosomal protein as a fraction of total protein
We compared the species and developmental changes in ribosome abundance with the corresponding changes in total soluble protein concentration (Fig. 2c,d). To do this, we estimated what proportion of the total leaf soluble protein was allocated to cytosolic and plastidic ribosomes. Firstly, we used our measured values for abundance of cytosolic 18S and plastidic 16S RNA (Fig. 2a,b), and literature values for the ribosome protein complement and the molecular weights of ribosomal proteins (TAIR10 Arabidopsis annotations) (Supporting Information Table S5) to estimate how much protein was allocated to cytosolic and plastidic ribosomes in a given species and stage of leaf development. This value was then divided by the corresponding value for total leaf soluble protein to estimate the proportion of the total protein that is assigned to a ribosome species (Supporting Information Table S6, Fig. 2d). Most ribosomal proteins are encoded by gene families. For the calculations we took the molecular weight of the most abundant member, as estimated from The Affymetrix GeneChip Arabidopsis ATH1 Genome Array transcript levels; the error introduced by this assumption will be small, as there are only small differences in molecular weight between family members. Our calculation assumed that the molecular weights of ribosomal proteins in the Proteaceae species are similar to those in A. thaliana; this assumption is supported by the conserved sequences of most ribosomal proteins (not shown).
Ribosomes represent around 3% of the total soluble protein pool in mature A. thaliana leaves (group a), rising to >10% in growing leaves (groups c, d) (Supporting Information Table S7). The latter value probably still underestimates the proportion of protein allocated to ribosomes in the cell division stage, when leaves are <1 mm in length (Baerenfaller et al. 2012). In the Proteaceae species, 2.5–8.0% of the total soluble protein is allocated to ribosomes in mature leaves, and a similar or slightly higher proportion in immature leaves (Fig. 2c,d). The lower levels of ribosomes per unit FW in the Proteaceae species are therefore not due to a major change in relative allocation of protein between ribosomes and other proteins for the mature leaves. Rather, it points to a different growth strategy. A low ribosome abundance can be expected to decrease the rate of protein synthesis, and hence the protein concentration and the rate of growth. This is especially evident for the plastidic ribosomes. In A. thaliana, the percentage of total soluble protein allocated to plastidic ribosomes was about 1.2 and 1.6% in leaves after maturation and in the late growth phase (groups a and b, respectively; Fig. 2d). A similar range was found in mature leaves of the Proteaceae species (1.0–3.8%, Fig. 2d). In young expanding A. thaliana leaves (group c), about 4% of total soluble protein was allocated to plastidic ribosomes (Fig. 2d), compared with only 0.7–2.7% in immature leaves from the Proteaceae species (Fig. 2d). These results point to a very low allocation of protein, and by inference, P to plastidic ribosomes during the earlier stages of leaf development in the Proteaceae species.
Changes in rRNA levels in young and mature leaves of A. thaliana in P-deficient conditions
It is known that RNA levels, and by implication, ribosome abundance decrease in P-deficient A. thaliana (Hewitt et al. 2005). However, it is not known how P deficiency affects ribosome abundance along the leaf developmental gradient. We divided the leaves of P-replete and P-deficient A. thaliana plants into three groups: young leaves (<1–9 mm length), mid-state (9 mm to second largest) and mature leaves (largest to oldest leaves). Compared with P-replete plants, in P-deficient plants, cytosolic and plastidic rRNA abundance decreased by about 50 and 65%, respectively, in mature leaves, but they did not decrease significantly in young leaves of A. thaliana (Supporting Information Table S6). Total P in rRNA decreased by about 60% in mature leaves, but only by 10–15% in young leaves under P deficiency. For comparison, soluble protein levels decreased by about 25% in mature leaves, and 10% or less in young leaves (Supporting Information Table S6 and Fig. S1). Thus, P-limited A. thaliana maintained ribosome abundance, including plastidic ribosome abundance, in young leaves, and decreased ribosome abundance in mature leaves, accentuating the ribosomal developmental gradient observed in the A. thaliana rosette. This contrasts with the Proteaceae species, which did not show a high investment in ribosomes, and in particular plastidic ribosome abundance, in their immature leaves, pointing to contrasting strategies between the species.
Total P pool and fraction of total P invested in rRNA
Total P concentration was determined in A. thaliana leaves grown in P-replete or P-deficient conditions (Supporting Information Table S7). Under P-replete conditions, A. thaliana leaves contained around 4.5 mg P g−1 DW, irrespective of their developmental stage. Under P-deficient conditions, A. thaliana retained a large amount of P in its youngest leaves, while the P concentration decreased to around 1 mg g−1 DW in the oldest leaves. The total concentration of P in leaves of the Proteaceae species was at least an order of magnitude lower, ranging from 0.12 to 0.86 mg g−1 DW. As in A. thaliana leaves grown under P-deficient conditions, young Proteaceae leaves contain more P than oldest leaves.
The proportion of P invested in rRNA followed a developmental gradient in A. thaliana, from 33 to 37% in its youngest leaves to 11–16% in the oldest ones. Perhaps surprisingly, this investment was totally insensitive to the P supply, which induced a decrease in total P concentration in the oldest leaves, thus indicating that A. thaliana allocated a fixed percentage of P to its translation machinery. Interestingly, the Proteaceae species did not show clear differences in the amount of P invested in their ribosomes in relation to the developmental stage of their leaves. Compared with A. thaliana, the total P in leaves of the Proteaceae species was at least an order of magnitude lower, and the proportion invested in rRNA was similar in older leaves or as little as half in younger leaves.
Leaf chlorophyll
Overall, chlorophyll levels in mature leaves of Proteaceae species were similar to those in A. thaliana (Fig. 4a) Leaf chlorophyll concentrations were considerably (P ≤ 0.0001) lower in immature leaves of the Proteaceae species than in young expanding A. thaliana leaves (Fig. 4a). This reflects a delayed greening phenotype that is commonly seen in Banksia and Hakea species in the field (Fig. 1). Young expanding leaves have a yellow or reddish-brownish appearance in the studied Hakea species and are yellowish-brownish for the Banksia species under investigation (Fig. 1; Lambers et al. 2012b).
Figure 4.

Leaf chemical composition of young, expanding (red bars, except for chlorophyll) and fully mature (>1 year old; green bars, except for chlorophyll) leaves of six Proteaceae species growing in their natural habitat and in Arabidopsis thaliana grown in a growth room at a range of day lengths, as indicated along the x-axis. Values are means ± SE (2 ≤ n ≤ 6). Leaves of the Proteaceae species were harvested during mid-morning; those of A. thaliana at the end of the day; those of A. thaliana at the end of the day. (a) Chlorophyll a and chlorophyll b concentrations; (b) starch concentrations (expressed as glucose equivalents); (c) Glc6P concentrations; (d) amino acid concentrations.
Interestingly, the Chl a/b ratio in mature leaves of the Proteaceae species was significantly (P = 0.005) lower (1.8–2.7) than for A. thaliana (3.5–4.2) (Table 1). Low Chl a/b ratios are typical for shade leaves, whereas the leaves of the Proteaceae species were sampled from plants growing in an open canopy in a Mediterranean climate, with peak light intensities over 2 mmol m−2s−1. These scleromorphic leaves are very thick, however; typically 0.5–0.8 mm (Table 1). Thick leaves tend to have shade-acclimated chloroplasts at their abaxial surface, for example in Spinacia oleracea (Nishio et al. 1993) and Schefflera arboricola (Lambers et al. 2008a), and this would explain the low Chl a/b ratio in the present Proteaceae species. The Chl a/b ratio was even lower (P ≤ 0.0001) in the immature leaves than in mature leaves (0.9–1.5, Fig. 2a), possibly reflecting a strong shading of these leaves by their trichomes and leaf pigments other than chlorophyll (Hughes et al. 2007).
Starch and Glc6P
Starch levels in mature leaves of the Proteaceae species were measured in samples harvested at midday. The starch concentrations of mature leaves were two- to fourfold higher (P = 0.013) than those in leaves of A. thaliana, harvested at the end of the day. In a further experiment with the three Banksia species, starch levels showed no significant change between dawn and midday (Supporting Information Table S8), indicating that the mature leaves had accumulated a large amount of starch that was not being turned over. Starch levels were significantly (P ≤ 0.0001) lower in young expanding leaves than in mature leaves (Fig. 4b). This reflects the very low photosynthetic activity of young expanding leaves (Lambers et al. 2012b).
Glucose 6-phosphate plays a central role in metabolism, being a precursor for sucrose, starch and cell wall synthesis, a product of starch and sucrose degradation, and the starting point for glycolysis and the oxidative pentose phosphate pathway. It is also typically the most abundant phosphorylated intermediate in leaves (see, e.g. Hurry et al. 2000; Morcuende et al. 2007; Arrivault et al. 2009). Levels of Glc6P in mature leaves of the six Proteaceae species were similar to those of A. thaliana (P = 0.144) (Fig. 4c). This indicates that concentrations of phosphorylated intermediates are, in fact, higher on a protein basis in mature leaves of the Proteaceae species, compared with P-replete A. thaliana. Amino acid concentrations were three- to fourfold (average 3.2-fold) lower (P ≤ 0.0001) in mature leaves of Proteaceae species than in those of A. thaliana, especially when the latter were grown at longer photoperiods (Fig. 4d). Amino acid concentrations were also low in immature leaves, in contrast to A. thaliana, showing two-fold more amino acids in young leaves at similar expansion stage than in the expanding Proteaceae leaves (Supporting Information Table S4).
Enzyme activities
Activities of Rubisco (Fig. 5) and a range of other enzymes (Fig. 6) in the Proteaceae species are shown in comparison with activities in A. thaliana. This comparison is summarized for the extreme day lengths in Table 2. The reliability of the measurements in the leaves of the Proteaceae species were validated by carrying out mixed extractions with A. thaliana rosettes (see Materials and Methods). The comparison made with A. thaliana in long day conditions (Fig. 5) showed significantly (P ≤ 0.01) lower concentrations in mature leaves of Proteaceae species than in A. thaliana. Because Rubisco N typically represents about 25% of total leaf N, and 50% of soluble protein, in sun-adapted leaves of C3 plants (Evans 1989), low Rubisco levels were expected in the Proteaceae species, based on their low total soluble protein concentrations (Fig. 3). Rubisco activities were, on average, about half of those in A. thaliana on a FW basis (Fig. 5, Table 2); this difference was smaller than that in leaf soluble protein concentration (Fig. 3). Rubisco activities were also lower on a leaf area basis than in A. thaliana, after accounting for the higher FW per unit leaf area in the Proteaceae species (Table 1).
Figure 5.

In vitro total Rubisco activities of young, expanding (red bars) and fully mature (>1 year old; green bars) leaves of six Proteaceae species growing in their natural habitat and in Arabidopsis thaliana grown in a growth room at a range of day lengths, as indicated along the x-axis. Values are means ± SE (2 ≤ n ≤ 6). Leaves of the Proteaceae species were harvested during mid-morning; those of A. thaliana at the end of the day. Rubisco was assayed after incubation with high CO2 concentration at pH 8 to fully carbamylate the lysine in the active site; (b) total Rubisco activity expressed per unit soluble leaf protein.
Figure 6.
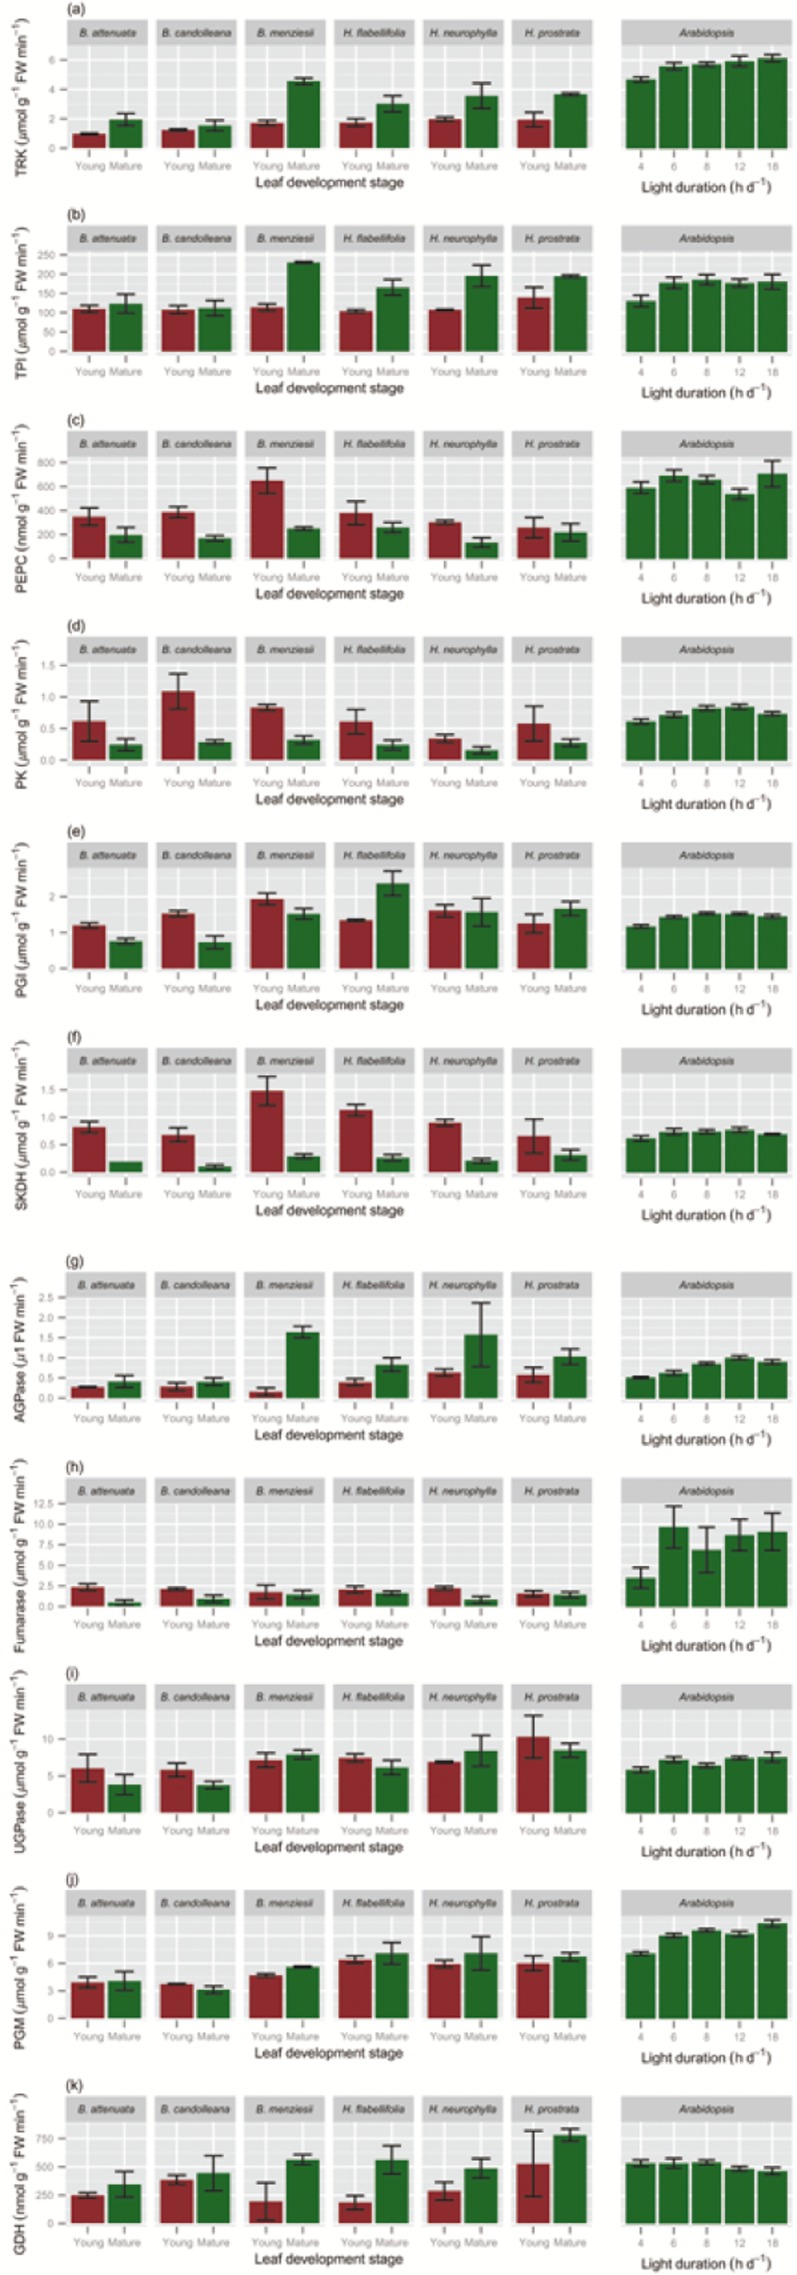
In vitro enzyme activities of young, expanding (red bars) and fully mature (>1 year old; green bars) leaves of six Proteaceae species growing in their natural habitat and in Arabidopsis thaliana grown in a growth room at a range of day lengths, as indicated along the x-axis. Values are means ± SE (2 ≤ n ≤ 6). Leaves of the Proteaceae species were harvested during mid-morning; those of A. thaliana at the end of the day. (a) transketolase (TRK); (b) triose phosphate isomerase (TPI); (c) phosphoenolpyruvate carboxylase (PEPC); (d) pyruvate kinase (PK); (e) phosphoglucoisomerase (PGI); (f) shikimate dehydrogenase (SKDH); (g) ADP glucose pyrophophorylase (AGPase); (h) fumarase; (i) uridine diphosphate-glucose pyrophosphorylase (UGPase); (j) phosphoglucomutase (PGM); and (k) glutamate dehydrogenase (GDH).
Like Rubisco, a second Calvin–Benson cycle enzyme (transketolase, TRK; Fig. 6a, Table 2) also showed, on average, twofold lower (P = 0.0013) activities in mature leaves of the Proteaceae species than in A. thaliana. Similar activities were obtained for triose phosphate isomerase, TPI (Fig. 6b, Table 2) in the Proteaceae species and A. thaliana (P = 0.985). Levels of phosphoenolpyruvate carboxylase (PEPC; Fig. 6c, Table 2), and the dedicated glycolytic enzymes pyruvate kinase (PK; Fig. 6d, Table 2) and phosphoglucomutase (PGM; Fig. 6e, Table 2), were all significantly lower in mature leaves of Proteaceae species than in leaves of A. thaliana (P ≤ 0.01). Shikimate dehydrogenase (SKDH) levels were also significantly lower in mature leaves of the Proteaceae species than in A. thaliana (Fig. 6f, Table 2). It should, however, be noted that the enzyme activities showed a smaller difference between the Proteaceae species and A. thaliana than the difference in total soluble protein (Figs 3 & 6, Table 2).
Initial (data not shown) and total Rubisco levels in the Proteaceae species were significantly (P ≤ 0.0001) lower in young expanding leaves than in mature leaves (Fig. 5). The activities of two other Calvin–Benson cycle enzymes [TRK (Fig. 6a); TPI (Fig. 6b) ], were also significantly lower (P ≤ 0.0001) in young expanding leaves and rose strongly in mature leaves, although the changes were not as marked as for Rubisco. It should be noted that whereas Rubisco is unique to the Calvin–Benson cycle, TRK and TPI are also required at lower activities for carbohydrate breakdown via glycolysis and the oxidative pentose pathway. The key enzyme in starch synthesis (ADP glucose pyrophophorylase, AGPase) was also significantly (P = 0.0083) higher in mature leaves (Fig. 6g).
Other enzymes showed a reverse pattern. Activities of PEPC (Fig. 6c) and enzymes involved in glycolysis, for example PK (Fig. 6d), in organic acid metabolism (fumarase; Fig. 6h), and in amino acid biosynthesis (SKDH; Fig. 6f) were significantly (P ≤ 0.0001) higher in immature leaves than in mature leaves. The difference ranged between two- to threefold for PEPC and PK, and up to fivefold for SKDH. Shikimate dehydrogenase is required for the synthesis of aromatic amino acids, and of phenolic compounds that are derived from them (Vermerris & Nicholson 2006), and a high activity might account for the high concentration of the pigments referred to earlier (Fig. 1), assuming these pigments are of a phenolic nature (Close & Beadle 2003). Alternatively, its high activity might account for a vital role of SKDH in lignin biosynthesis in these highly scleromorphic leaves. Both simple phenolics and lignin affect the nutritional value of leaves (Jung & Fahey 1983). Uridine diphosphate-glucose pyrophosphorylase, which is involved in sucrose metabolism and cell wall synthesis, was high in both immature and mature leaves (Fig. 6i). Phosphoglucoisomerase (Fig. 6e) and PGM (Fig. 6j) are required for sucrose synthesis, starch synthesis and glycolysis. They showed similar activities in immature and mature leaves (P = 0.0.820 and P = 0.203, respectively). We also investigated glutamate dehydrogenase, which is involved in the release of ammonium during amino acid catabolism and is strongly induced under carbon starvation conditions (Gibon et al. 2006, 2009). Its activity was significantly (P = 0.005) lower in immature leaves than in mature leaves (Fig. 6k).
The general picture that emerges is that activities of enzymes involved in carbohydrate breakdown and growth were relatively high in immature leaves and much lower in mature leaves. Enzymes involved in photosynthesis followed the pattern seen for chlorophyll, and were low in immature leaves and much higher in mature leaves. Enzymes with functions in carbohydrate synthesis and breakdown showed approximately the same activities at both leaf stages.
Changes in metabolic traits and rRNA abundance related to total soluble protein
Because leaves of Proteaceae species are much thicker, contain more structural dry matter and less protein than C3 species from mesic and nutrient-rich environments, like A. thaliana (Fig. 1, Table 1), the choice of unit is very important when comparing leaf traits. While all data displayed so far used leaf fresh weigh as the unit of reference, we also expressed the key parameters on a soluble protein basis. We consider that this best reflects the concentration per unit active cytoplasm. When expressed on this basis, compared with mature leaves of A. thaliana grown at an 18 h day length, mature leaves of the Proteaceae species (averaged for all six) contain similar or up to twofold higher levels of cytosolic and plastidic ribosomes (Fig. 2c,d), higher activities of Rubisco (2.5 times; Fig. 5c) and TRK (2.8 times; Fig. 7a) as examples of photosynthetic enzymes, higher activities of PEPC (3.0 times; Fig. 7b) and PK (4.6 times; Fig. 7c) as examples of respiratory enzymes, and higher levels of Glc6P (2.3 times; Fig. 7d). When young expanding leaves of the Proteaceae species are compared with young A. thaliana leaves, the leaves of Banskia species contain similar or higher levels of cytosolic ribosomes per unit protein, but two- to threefold lower levels of plastidic ribosomes. In the Hakea species, the levels of both cytosolic and plastidic ribosomes on a protein basis were lower than those in A. thaliana, with the exception of H. prostrata.
Figure 7.

The level of selected enzymes (shown per unit fresh weight in Fig. 6) and a metabolite (shown per unit fresh weigh in Fig. 4) expressed per unit leaf protein (shown in Fig. 3). (a) transketolase, as example of photosynthetic enzymes; (b) phosphoenolpyruvate carboxylase and (c) pyruvate kinase as examples of respiratory enzymes; (d) glucose-6-phosphate.
Discussion
The present study significantly extends our recent paper (Lambers et al. 2012b) and reveals further novel findings on strategies that increase the efficiency of P utilization in Proteaceae species from P-impoverished habitats (Lambers et al. 2014b). The most fascinating result is the very low levels of rRNA, the major fraction of leaf organic P, in both young expanding and in mature leaves. We show that these Proteaceae species operate with very low levels of ribosomes, in particular plastidic ribosomes, at early stages in leaf development. This finding goes a very long way explaining the high PPUE in south-western Australian Proteaceae species (Wright et al. 2004; Denton et al. 2007; Lambers et al. 2012b). Secondly, we show a very marked ‘delayed greening’ in these Mediterranean species, and we can attribute a novel function for this process. This phenomenon has mainly been studied for tropical species (Kursar & Coley 1992a, 1992b; Cai et al. 2005), but is also reported for temperate species (Hughes et al. 2007). Thirdly, we provide evidence for very similar levels of a major P-containing small metabolite (Glc6P) to those found in P-replete A. thaliana leaves, and even higher levels if we express concentrations relative to soluble protein concentrations; thus taking into account the large fraction of the scleromorphic leaves with a large epidermal cell volume with a low metabolic activity. Fourth, we show that leaves from the Proteaceae species have low activities of several enzymes involved in carbon metabolism, in particular Rubisco and a set of enzymes involved in glycolysis; this would be expected based on their low total soluble protein concentration. This low protein concentration is accounted for by low abundance of ribosomes, which will restrict protein synthesis. Interestingly, low Chl a/b ratios in leaves exposed to high light intensities suggest internal shading of the thick leaves of Proteaceae species, while the relatively high levels of starch show that the plants are not carbon limited. We discuss these findings in the context of the high PPUE of Proteaceae from P-impoverished habitats, as well as the general relation between P investment in ribosomes and maintenance of a given protein concentration.
Low investment of P in ribosomes
We found a considerably lower investment in ribosomes per unit FW in mature leaves of the Proteaceae species, and an even larger difference in their immature leaves, compared with P-replete and P-limited A. thaliana leaves. This low ribosome abundance may increase P-use efficiency in three ways. Firstly, it decreases investment of P in rRNA, which is often the major organic P-containing component in leaves (see Introduction). Secondly, lower ribosome abundance will decrease the rate of protein synthesis and cellular growth and, therefore, the demand for P in downstream processes like the synthesis of phospholipids and maintenance of adequate concentrations of free nucleotide and phosphorylated intermediates. Thirdly, the amount of P required in the translation machinery in immature leaves isdecreased by an altered developmental response of cytosolic and plastidic ribosome abundance.
The low ribosome abundance in immature leaves was largely explained by a low investment in plastidic ribosome abundance. It is striking that immature leaves are characterized by relatively high levels of cytosolic ribosomes, but very low levels of plastidic ribosomes, whereas mature leaves have similar levels of cytosolic and plastidic ribosomes. This indicates that protein synthesis in developing leaves of Proteaceae species occurs in two waves: a first wave is associated with cellular growth and establishment of the basic leaf structure, which requires cytosolic ribosomes, and a second wave is associated with chloroplast biogenesis, which requires both cytosolic and plastidic ribosomes. Chloroplast biogenesis requires large-scale protein synthesis in the cytosol, because most of the proteins in the plastids are encoded by the nucleus and are synthesized in the cytosol and immediately imported into the plastids to be incorporated into protein complexes that contain plastid- and nucleus-encoded proteins (Marín-Navarro et al. 2007; Cline & Dabney-Smith 2008).
In principle, the low ribosome abundance, the overall low total soluble protein concentration and slow growth could be explained in two ways: either lower ribosome abundance decreases the rate of protein synthesis and, hence both protein concentration and growth, or some other factor decreases growth and the protein concentration and, as a consequence, ribosome abundance. We consider, for two reasons, that the former is by far the most likely explanation. Firstly, ribosomes are required for protein synthesis (see Introduction). Secondly, rRNA abundance decreases more than the protein concentration for four of the six species for cytosolic rRNA and in all cases for plastidic rRNA.
In addition to net protein synthesis, rRNA is also required for protein turnover. We do not know the turnover rate of the photosynthetic proteins in these Proteaceae species in the field. Based on the measured levels of rRNA species and the total soluble protein concentration, we estimate that about 2.5–5.0% of the total soluble protein is allocated to ribosomes in mature leaves of the Proteaceae species, compared with about 3% in P-replete A. thaliana. The corresponding values for plastidic ribosomes were 1–3% and about 1.3%, respectively. The levels of ribosomes were even lower in mature leaves of P-limited A. thaliana. Assuming that these ribosomes are used with a similar intensity in all species, and that the majority of protein synthesis in these mature leaves is due to protein turnover, these results indicate that the rates of protein turnover in mature leaves of Proteaceae species are similar to or even marginally higher than those in mature leaves of greenhouse-grown A. thaliana plants. Given the intensity of stress to which Proteaceae species are exposed in the field, this is not surprising, although we also note that the proposed low-light environment inside the leaves of the Proteaceae species (see earlier) might decrease protein damage and consequently protein turnover (Raven 2012).
Delayed greening
The low rates of photosynthesis (Lambers et al. 2012b) in young expanding leaves are associated with low levels of chlorophyll, starch, protein, Rubisco and other Calvin–Benson cycle enzymes. The young leaves were reddish or yellow, rather than green. This phenomenon of delayed greening has been described before for rainforest (Kursar & Coley 1992a; Close & Beadle 2003; Cai et al. 2005) and temperate species (Hughes et al. 2007). Delayed greening is considered a defence against herbivory (Kursar & Coley 1992b; Numata et al. 2004) as well as offering protection against high light intensities (Hughes et al. 2007). It has been proposed that delayed greening may result in a low protein level in younger leaves, which would decrease their nutritional value, while the red and yellow pigments may be defence compounds (Kursar & Coley 1992a). Phenolics have been observed in cotyledons of Proteaceae, where higher concentrations are associated with better defence (Hanley & Lamont 2001). In the Proteaceae species analysed in this study, soluble protein levels were, on average 1.5-fold higher in immature than in mature leaves. This developmental shift resembles that in A. thaliana, where soluble protein levels are around 1.3-fold higher in young leaves that have attained about half of their mature size than in mature leaves (Baerenfaller et al. 2012; Table 2). However, if the young expanding leaves had developed their photosynthetic machinery as happens in A. thaliana, the difference in total soluble protein would have been considerably greater, making the expanding leaves potentially more attractive for herbivores. While activities of most enzymes were low in young expanding leaves, these leaves showed relatively high levels of SKDH, which may be involved in the synthesis of the red and yellow pigments, assuming these are phenolics (Díaz et al. 1997; Peek et al. 2013). This comparison indicates that delayed greening is not necessarily associated with a decreased nutritional value per se, and emphasizes the potential importance of high levels of defence metabolites in the young leaves. These are presumably synthesized using imported carbon; the high levels of starch in mature leaves provide evidence that their synthesis is unlikely to be curtailed by carbon availability.
In Quercus glauca, delayed greening is considered important in the context of partitioning of N used for leaf expansion and N used for chloroplast development, two major sinks for N (Miyazawa et al. 2003). Ribosomes represent a high proportion of the total RNA and total protein in growing cells (Warner 1999; Raven 2012), including those in young leaves (Supporting Information Table S7; see also Detchon & Possingham 1972; Dean & Leech 1982; Baerenfaller et al. 2012). During leaf growth, both cell expansion and biogenesis of the photosynthetic apparatus require the synthesis of large amounts of protein (Miyazawa et al. 2003). Typically, in dicotyledonous species, leaf expansion and chloroplast biogenesis occur simultaneously (Detchon & Possingham 1972; Dean & Leech 1982; Baerenfaller et al. 2012). Our analyses of cytosolic and plastidic ribosome abundance in A. thaliana provide direct support for this model, showing that plastidic ribosomes are highly abundant in young expanding leaves, changing in parallel with the abundance of cytosolic ribosomes. The only exception, in wheat, is at the earliest stages of leaf development, when cytosolic ribosomes are more abundant (Dean & Leech 1982). An aspect that has not been considered previously is that delayed greening may also increase P-use efficiency and this might be the primary reason for the synthesis of non-plastidic pigments, which then can protect the leaves against high light in the absence of a mature photosynthetic machinery (see later).
Temporal separation of leaf expansion and establishment of the photosynthetic machinery lengthens the time needed for the establishment of a fully mature leaf, and especially the time until a leaf transitions from being a net importer to a net exporter of carbon. However, this is unlikely to be a major disadvantage in plants like the Proteaceae species, whose growth is limited by P, and which produce leaves that have a lifetime of 2–3 years. Their mature leaves accumulate large amounts of starch, which can be used to support growth of young leaves for an extended period before they develop a strong photosynthetic capacity and become self-supporting for carbon.
Levels of Glc6P
Glucose 6-phosphate is a particularly abundant phosphorylated intermediate, and is typically about 20% of the fraction representing small P-containing metabolites (Hurry et al. 2000; Arrivault et al. 2009; Suzuki et al. 2012). Similar concentrations of this metabolite in leaves of Proteaceae species and in A. thaliana lead to rejection of our hypothesis that low leaf P concentrations are partly due to low levels of P-containing small metabolites. We suspect that the low concentration of Glc6P on a FW basis is due to a relatively small cytoplasmic volume occupied by photosynthetically active cells per se, and that the concentration in the cytoplasm and plastids of these cells may be quite high (Fig. 7). The response in these low-P adapted Proteaceae species differs markedly from that of A. thaliana and other species, like barley and spinach, where the level of Glc6P and other sugar phosphates drops strongly in P-limited plants (Brooks et al. 1988; Hurry et al. 2000; Zrenner et al. 2006; Morcuende et al. 2007). This decrease may be in part a direct consequence of a decrease in the cytoplasmic P pool, because a similar decrease occurs rapidly after feeding P-sequestering chemicals like mannose and glycerol to plants (Herold & Lewis 1977; Foyer et al. 1982; Prinsley & Leegood 1986; Leegood et al. 1988). Instead of economizing on P-containing metabolites, which would require higher enzymes levels (see Introduction), Proteaceae species economize on enzyme levels, corresponding with low rRNA levels. Because the levels of Glc6P represent only about 5% of total leaf P in these Proteaceae species, changes in Glc6P levels will make a far less significant contribution to PPUE than changes in rRNA abundance. An interesting implication of the relatively high Glc6P pool in these Proteaceae species is that the cytoplasmic P pool may not decrease as much as it does under P limitation in less well-adapted species.
Low levels of enzymes associated with carbon metabolism to achieve high PPUE
Mature leaves of the Proteaceae species contain low levels of enzymes, including those for photosynthesis, and a low total soluble protein concentration. The enzyme activities were measured in vitro under optimal assay conditions. We have shown elsewhere that there is a good agreement between enzyme activities measured in our assays and protein abundance as determined by liquid chromatography tandem mass spectrometry (LC/MS-MS) (Piques et al. 2009). The low total soluble protein concentration is partly explained by a decreased level of enzymes in central metabolism. The observation that the total soluble protein concentration in Proteaceae species is five- to 10-fold less than in A. thaliana (Fig. 3), whereas the measured enzyme activities differ only two- to threefold or less (Table 2), indicates that other classes of soluble proteins may show an even larger decrease. This cannot be readily tested at this time, because we have so far not been able to obtain reliable measurements of metabolites when extracts from the present Proteaceae species are analysed by LC/MS-MS.
Our initial hypothesis, based on previous works in A. thaliana and crop plants, was that enzyme levels would remain high or even increase during leaf development in the leaves of the Proteaceae species. Our reasoning was that a low P availability would result in low levels of P-containing metabolites and cofactors, leading to enzymes being more strongly substrate limited in vivo and that this would be compensated by an increase in enzyme abundance. As proteins do not contain P, except when phosphorylated to be activated, this could provide a P-neutral strategy to compensate for lower levels of P-containing metabolites. Further, it might be expected that high levels of Rubisco and other Calvin–Benson cycle enzymes would be required to maximize photosynthesis in leaves that are exposed to the high light intensities in a Mediterranean climate where canopies are relatively open, as is the case for these Proteaceae species in the field (Fig. 1). Our results show that the Proteaceae species exhibit a very different strategy, decreasing investment in rRNA, decreasing protein synthesis and enzyme abundance while maintaining levels of Glc6P, and presumably other P-containing low molecular weight metabolites.
Four important considerations may explain why low levels of Rubisco, other Calvin–Benson cycle enzymes and soluble protein levels are compatible with rapid rates of photosynthesis per unit leaf P in leaves of the Proteaceae species. The first two considerations relate to the conditions under which photosynthesis may occur in the field in leaves of the Proteaceae species. Firstly, their leaves are rather thick, leading to shading of the chloroplasts at the abaxial side. This would also explain the very low Chl a/b ratio (Table 1), which is indicative of shade leaves (Lambers et al. 2008a). The especially low Chl a/b ratios in young leaves, may be due to additional shading by other pigments (Hughes et al. 2007) and leaf hairs. There is likely to be a gradient in Rubisco from the adaxial to the abaxial surface as well as a gradient in Chl a/b (Nishio et al. 1993; Vogelman et al. 1996). Secondly, leaves of these Proteaceae species do not necessarily carry out photosynthesis at the peak light intensities during midday. They typically decrease their stomatal conductance later during the morning (Lamont & Bergl 1991; Lambers et al. 2014a), and hence photosynthesize predominantly when the light intensity is half or less than that at midday. Further, while the leaves of the studied Banksia species are oriented fairly close to horizontal, those of the Hakea species are oriented vertically (Fig. 1), providing an additional reason why they do not photosynthesize at extreme midday irradiance levels. Both midday stomatal closure and the vertical orientation of the leaves maximize water-use efficiency (Farquhar & Sharkey 1982; Smith et al. 1998). Thus, despite high irradiance levels in their Mediterranean environment, the observed low total soluble protein concentrations and Calvin-Benson cycle enzyme levels can be understood, given the prevalent light intensities during photosynthesis. Thirdly (see earlier) is that the present Proteaceae species maintain high levels of Glc6P, and by implication, other phosphorylated intermediates, which will allow efficient operation of the Calvin–Benson cycle enzymes. Fourthly, and possibly the most decisive explanation for high rates of photosynthesis per unit leaf P relates to the P requirement of protein synthesis. Synthesis of proteins requires ribosomes (Rudra & Warner 2004, Warner, 1999), and rRNA is the major component of total cellular organic P (see Introduction), especially during the stage of leaf development linked with cellular growth and chloroplast biogenesis (Veneklaas et al. 2012).
The P content of rRNA represents 33 and 11% of the total P in young and mature leaves of P-replete A. thaliana, respectively (Supporting Information Tables S7 and S9). Surprisingly, this investment was independent of the P supply, despite the fact that P deficiency induced a decrease in the total P concentration in old leaves. Thus A. thaliana allocated a fixed percentage of its P to ribosomes, suggesting a tight regulation of the translation machinery in relation to P concentration of the leaves. When A. thaliana was grown at a low P supply, the P concentration was maintained in young growing leaves, and decreased in older and intermediate/expanding leaves. Ribosomes are used for growth mostly in young leaves, and in mature leaves are mostly used for maintenance. Wex would expect this strategy to be detrimental for A. thaliana for two reasons. Firstly, it is possible that oldest leaves under P deficiency do not contain enough ribosomes to allow maintenance of all cellular functions. Indeed, A. thaliana is loading around 60–65% of its ribosomes onto polysomes in the light under optimal growth conditions (Pal et al. 2013). This implies that the decrease of more than 50% in total ribosome amounts we observed in the oldest rosette leaves under P deficiency might not be compensated by a higher usage. It would lead to early senescence of these leaves as their maintenance cannot be ensured, thus explaining the well-known P deficiency phenotype. Secondly, the youngest A. thaliana leaves have similar amounts of ribosomes, irrespective of the P supply, but rosettes under such condition display reduced growth rates. Thus, probably a large proportion of these ribosomes in the young leaves may be in excess and constitute a wasted P pool. Such results point to an inefficient allocation of P resources by A. thaliana and might partly explain its low PPUE. In monocotyledonous species, leaf expansion and chloroplast biogenesis are separated in space and time (Dyer et al. 1971; Dean & Leech 1982; Pick et al. 2011). Separation of these processes in time might allow ribosomes to be initially engaged in the synthesis of proteins related to cellular growth, and subsequently in the synthesis of proteins involved in chloroplast biogenesis. This might allow the number of ribosomes to decreased, and improve the efficiency of N allocation (see earlier). It may also allow P investment in rRNA to decrease compared with plants where leaf expansion and greening occur simultaneously. In this case, we might expect this spatial and temporal separation of leaf expansion and chloroplast biogenesis to be especially advantageous under P-limited conditions. In agreement, monocots tend to have a higher PPUE than dicots, when grown under low-P conditions; this disappears when plants are grown at high P supply (Halsted & Lynch 1996).
High leaf N:P ratios in leaves of Proteaceae species
The high N:P ratios observed in our study of Proteaceae (Table 1) are typical for species in similar environments (Lambers et al. 2010). They are not due to a high leaf [N], but to a very low leaf [P]; leaf [N] (Table 1) and leaf [protein] (Fig. 3) are actually relatively low. While low leaf N and total soluble protein concentrations do reflect the low availability of N in the natural environment of the species under investigation (Lambers et al. 2010), they may also reflect tight control of N uptake and metabolism when P is limiting, as found for other species (Rufty et al. 1993; de Magalhães et al. 1998; Gniazdowska & Rychter 2000). Even when grown at higher N supply, H. prostrata does not show high leaf [protein] (R. Jost, P.M. Finnegan & H, Lambers, unpublished results). While these species exhibit a low capacity to down-regulate their P uptake (Shane et al. 2004b; de Campos et al. 2013), their N uptake appears to be remarkably tightly controlled.
Carbon allocation and storage
Unlike young expanding leaves, which show low rates of photosynthesis (Lambers et al. 2012b), mature leaves of these Proteaceae species accumulated considerable levels of starch, for example 125 μmol hexose g−1 FW in B. attenuata, equating to the assimilation of 750 μmol CO2 (Supporting Information Table S8). The rate of photosynthesis we measured for this species in the same environment (Lambers et al. 2012b) was 23 μmol CO2 m−2s–1; at that rate, it would take about eight hours to accumulate the amount of starch we measured in this species, if none of the assimilates were exported at the same time. However, comparing starch levels at dawn with those at midday showed no significant difference (Supporting Information Table S8), and hence the rate of photosynthate export must have been close to the rate of production. Leaves are obviously not the site of long-term storage of reserves. Starch in Banksia species is predominantly stored in the vascular tissues of roots and trunks (Pate et al. 1990). During approximately three months in the wet season, these reserves would be important to support the carbon-demanding production and functioning of their cluster roots, which consume a major fraction of the daily produced photosynthates (Lambers et al. 2006). Later in the year, during the prolonged dry season when stomatal conductance of Banksia species declines (Lamont & Bergl 1991; Veneklaas & Poot 2003) and no cluster roots are produced (Lambers et al. 2006), the starch reserves would be required for maintenance of cellular structures allowing a negative carbon balance. The present photosynthesis measurements were taken in early summer (November–December), when temperatures are still mild and soil moisture levels high. Much of the starch would be needed to allow expansion of young and photosynthetically non-competent leaves, which typically occurs at this time of the year. However, Proteaceae species grow considerably slower than A. thaliana. For example, independent of P supply, Banksia grandis seedlings achieve a growth rate of 0.026 g g−1 day−1 (Barrow 1977), which is well over an order of magnitude less than that typically found for ruderal, low-LMA species (Lambers & Poorter 1992) and the rates measured for the A. thaliana plants used as a comparison in our study (0.28 and 0.56 mm2 mm−2 day−1 at a 12 and 18 h photoperiod, respectively (Gibon et al. 2009).
Low leaf P concentrations, high rates of photosynthesis and high PPUE
The results in this and a recent paper (Lambers et al. 2012b) go a long way to explain the high PPUE of the investigated Proteaceae species. The mature leaf P concentration of these species in our study was is in the range of 0.15–0.29 mg P g−1 DW (Table 1; Lambers et al. 2012b). A basis for the following analysis is a canonical study in which barley (Hordeum vulgare L.) was grown in nutrient solution at a growth-limiting P supply, and analysed for total P concentration (0.9 mg P g−1 DW, and its distribution between the major P fractions in leaves: phospholipids (17%), P-containing metabolites (26%), nucleic acids (30%) and free Pi (26%) (Chapin & Bieleski 1982).
Firstly, as acknowledged before (Lambers et al. 2010), the high LDMC of approximately 0.55 g DW g−1 FW ‘dilutes’ leaf [P]. Thus, their very low leaf [P] on a DW basis, 10-fold lower than in plants showing an ‘adequate’ leaf [P] (Epstein & Bloom 2005), is reduced to a 1.8-fold difference when expressed on a FW basis. Secondly, we recently showed (Lambers et al. 2012b) that these Proteaceae species extensively replace phospholipids by galactolipids and sulfolipids during leaf development. This will very substantially reduce a fraction that represents approximately 17% of the P in leaves of P-limited barley (Chapin & Bieleski 1982) and a range of other species (Veneklaas et al. 2012). Thirdly, and most importantly, we found a decrease in ribosome abundance and, thence, the amount of P invested in rRNA. Compared with A. thaliana, rRNA abundance per unit FW was three to six times less in mature leaves of Proteaceae species, and up to 150-fold less in young expanding leaves. This massive decrease in a fraction that represents 30% of the P in P-limited barley leaves (Chapin & Bieleski 1982) will make a very large contribution to the 1.8-fold difference that is required to explain the difference in PPUE between Proteaceae species and plants that are not adapted to P-impoverished soils. Fourth, delayed greening may contribute to P-use efficiency. In mature leaves, the decrease in ribosome abundance closely tracked the decrease in total soluble protein concentration, while in young expanding leaves there was a particularly low investment in plastidic rRNA, which was accompanied by a delay in chloroplast biogenesis. In addition plastidic ribosome abundance on a protein basis was two- to threefold lower in young expanding leaves compared either with mature leaves of Proteaceae species or with young A. thaliana leaves. This is consistent with the proposal that delayed greening allows an increase in P-use efficiency by separating leaf growth and chloroplast biogenesis, thus allowing sequential use of the P invested in ribosomes. Plastidic ribosomes account for 25–36% of total ribosomes in a dicot leaf (Dyer et al. 1971; Makrides & Goldthwaite 1981), so delayed greening on its own might lead to a 25–36% decrease in P investment during this phase of leaf development.
The decreased allocation to two major leaf organic P fractions (phospholipids and nucleic acids) will increase P-use efficiency. The third major organic P fraction (P-containing metabolites) does not contribute to the high P-use efficiency, if all these metabolites show the same trend as Glc6P. The fourth major fraction of P in P-limited barley leaves is inorganic P. In eudicots, inorganic P is preferentially allocated to epidermal cells (Conn & Gilliham 2010). In H. prostrata (Shane et al. 2004a) and B. attenuata and B. menziesii (P. Clode & H. Lambers, unpublished), however, P is accumulated in mesophyll cells, as is the case in monocots (Conn & Gilliham 2010). To our knowledge, no systematic comparison has been made of the PPUE of dicots and monocots, with the exception of a study aimed at a comparison of C3 and C4 species (Halsted & Lynch 1996). Interestingly, Halsted & Lynch (1996) showed a greater PPUE in monocots. We do not know if Proteaceae species other than the three referred to earlier show a similar pattern of P allocation to mesophyll cells, instead of epidermal cells, but surmise that this might be an additional factor contributing to their high PPUE.
Do the data presented here and in our previous paper (Lambers et al. 2012b) also explain why rates of photosynthesis of the six Proteaceae species are relatively high on a leaf area basis, despite low leaf [P], leaf [N] and Rubisco activities? Because rates of photosynthesis were compared per unit leaf area, we should also compare other parameters on a leaf area basis. Protein levels per unit area were, on average, 1788 and 3783 mg m−2 for the six Proteaceae species and A. thaliana, respectively. The corresponding values for total Rubisco activities per unit leaf area were 35.7 and 21.1 μmol m−2s−1, respectively. The six Proteaceae species assimilated 10–23 (average 16.7) μmol CO2 m−2s−1 at the light intensity in the field in the morning which would have been saturating for photosynthesis (Lambers et al. 2012b). Conversely, A. thaliana leaves photosynthesize at about 7 μmol CO2 m−2s−1 at the light intensity used for plant growth in the present experiments (Eckardt et al. 1997). Therefore, the Proteaceae species achieved, on average, a 2.3-fold higher rate of photosynthesis per unit leaf area with a 1.7 fold higher total Rubisco activity and only 47% of the amount of soluble protein per unit leaf area. This probably reflects an over-investment in Rubisco and use of some of the enzyme as a storage protein in A. thaliana (Quick et al. 1991; Irving & Robinson 2005). The A. thaliana plants used in this study were grown at a relatively low light intensity of 160 μmol m−2s−2 and a high N supply; under such conditions there is likely to be substantial over-investment in Rubisco (Stitt & Schulze 1994). The Proteaceae species, which grew in their natural high-light environment, may operate with amounts of Rubisco much closer to the minimum required. This may be at least partly due to the lower levels of ribosomes, which constrain protein synthesis and the synthesis of large amounts of Rubisco.
Concluding remarks
Young expanding leaves of the present six Proteaceae species function in a very different way from the fully mature leaves. Young leaves depend almost completely on import of carbon to sustain their expansion, while their chloroplast biogenesis is delayed. Delayed greening has previously been attributed to protection against herbivores and high light intensities (photo-protection), but here we suggest it is also a strategy to allow sequential use of rRNA for the synthesis of proteins required for the production of new cells and structural defence (sclerenchyma) and later for chloroplast maturation, thus decreasing the peak abundance of rRNA required during leaf development. We note that a similar strategy may also be relevant for N-limited plants, as ribosomes represent a major proportion of the total protein in young leaves. Following maturation, leaves contain massive amounts of sclerenchyma (Lambers et al. 2012b) and are very efficient at photosynthesis.
In both young expanding leaves and in photosynthetically competent mature leaves, there is a relatively low investment in protein, including Calvin–Benson cycle enzymes, which make up a large proportion of total soluble protein in leaves of C3 species. This is not necessarily disadvantageous, because leaves of the studied Proteaceae species predominantly fix carbon dioxide at levels of incident radiation well below midday levels, as a result of (1) decreased stomatal conductance during the middle of the day when transpiration rates would be high; (2) leaf angle; and (3) internal leaf anatomy. The lower levels of protein are at least partly a consequence of lower investment of P in rRNA. Taken together, the Proteaceae species thus optimize the use of both P and water. A low investment in rRNA would account, to a major extent, for the high PPUE, in addition to low levels of phospholipids (Lambers et al. 2012b) and possibly preferential allocation of P to mesophyll cells (Shane et al. 2004a) rather than epidermal cells, as is usual in other eudicots (Conn & Gilliham 2010).
Of the four main P fractions, that is rRNA, phospholipids, phosphorylated intermediates and free nucleotides, and free P, we have shown that the first, second and fourth are low in Proteaceae species grown in their natural low-P environment. We have no evidence that Glc6P, which is a major component of the pool of P-containing metabolites, that is phosphorylated intermediates and free nucleotides, is low, in contrast to findings for a range of other species exposed to low-P conditions (Veneklaas et al. 2012). From a systems perspective, this response represents a very effective strategy to maximize P-use efficiency. The low P allocation for rRNA will lead to a low rate of protein synthesis, and hence growth, matching it to the low P supply. Conversely, saving P by decreasing the concentration of P-containing intermediates of carbon metabolism would save P in that cellular component, but this would not decrease growth to match the P supply. In fact, low concentrations of P-containing intermediates might even lead to stress by slowing down metabolism. Therefore, the decrease in rRNA not only saves P in this cellular component, but also, by decreasing rates of protein synthesis and growth, further decreases the need for P in other pools, which are all located downstream of protein synthesis and growth. Maintaining high concentrations of Glc6P, and possibly other phosphorylated intermediates, on a protein basis will allow the enzymes, and hence the rRNA that is required for their synthesis, to operate effectively.
Future research will aim to explore if the P-efficiency traits in Proteaceae are desirable for crop plants, or if there are also unwelcome trade-offs. It will also be of interest to investigate whether differences in ribosome abundance contribute to competitiveness of wild species in natural and often challenging environments, and to investigate the regulatory mechanisms underlying these changes in ribosome abundance.
Acknowledgments
We thank the Western Australia Department of Parks and Wildlife (DPaW) for their permission to collect leaf samples. HL was supported by the Australian Research Council (ARC) and EL by Research Fellowships from the University of Western Australia and the ARC. RS, HI, AS, PG and MS acknowledge support from the Max Planck Society, and MS acknowledges support from the European Union (collaborative project TiMet under contract no. 245143). Patrick Hayes and Michael Smirk helped with the leaf nitrogen analyses, Graham Zemunik with field work, and Dana Schindelasch (Max Planck Institute of Molecular Plant Physiology) with the Arabidopsis plant growth. The University of Dundee is a registered Scottish charity (No. SC015096).
Supporting Information
Additional Supporting Information may be found in the online version of this article at the publisher's web-site
Rates of expansion of Arabidopsis thaliana rosette leaves; plants were grown in short days (8 h/16 h light/dark).
Table S1. Recovery of enzyme activities. Powdered samples were prepared from a standard greenhouse-grown Arabidopsis (‘Arabidopsis’) and from a mix in equal parts of Banksia attenuata, B. menziesii and B. candolleana (‘Banksia-mix’). These powders were either extracted and assayed for enzyme activities separately, or combined in a 1:1 ratio (Banksia-mix + Arabidopsis) before extraction. The recovery of Arabidopsis enzyme activity was calculated as 100 × [Activity in (‘Banksia-mix + Arabidopsis)’ – (Activity in ‘Banksia mix' × 0.5) ] / (Activity in ‘Arabidopsis’ × 0.5) × 100. This table also shows the abbreviations used for each enzyme, and assignment of each enzyme to a metabolic pathway as well as the dilution factor used for the assays and incubation times.
Table S2. Threshold cycle values of external RNA standards in six Proteaceae species and in Arabidopsis thaliana.
Table S3. Primers used for the determination of ribosome copy numbers in Proteaceae species and Arabidopsis taliana. List of the rRNA genes and spike controls (ArrayControl RNA Spikes; Applied Biosystems/Ambion, Darmstadt, Germany) use in qRT-PCRs.
Table S4. Rates of expansion of Arabidopsis thaliana rosette leaves; plants were grown in short days (8 h/16 h light/dark).
Table S5. Ribosome abundance in Arabidopsis thaliana and in six Proteaceae species.
Table S6. Molecular weight of ribosomal proteins.
Table S7. Percentage of investment of total phosphorus (P) in ribosomes.
Table S8. Starch concentrations (μmol glucose units g–1 dry mass) of fully expanded, mature leaves of Banksia species growing in their natural habitat. Leaves were collected either before dawn or later during the day, which started sunny, but with some clouds after 1130 h. Mean values and SE (n = 6). The time to produce this amount of starch was calculated from the concentrations as shown here, the leaf area per unit dry weight (Table 2) and published data on photosynthesis of plants grown in the same environment (Lambers et al. (2012b).
Table S9. Phosphorus content in ribosomal RNA.
References
- Albenne C, Canut H. Jamet E. Plant cell wall proteomics: the leadership of Arabidopsis thaliana. Frontiers in Plant Science. 2013;4 doi: 10.3389/fpls.2013.00111. 111. doi 10.3389/fpls.2013.00111. [DOI] [PMC free article] [PubMed] [Google Scholar]
- Andersson MX, Larsson KE, Tjellström H, Liljenberg C. Sandelius AS. Phosphate-limited oat. Journal of Biological Chemistry. 2005;280:27578–27586. doi: 10.1074/jbc.M503273200. [DOI] [PubMed] [Google Scholar]
- Arrivault S, Guenther M, Ivakov A, Feil R, Vosloh D, Van Dongen JT. Stitt M. Use of reverse-phase liquid chromatography, linked to tandem mass spectrometry, to profile the Calvin cycle and other metabolic intermediates in Arabidopsis rosettes at different carbon dioxide concentrations. Plant Journal. 2009;59:826–839. doi: 10.1111/j.1365-313X.2009.03902.x. [DOI] [PubMed] [Google Scholar]
- Baerenfaller K, Massonnet C, Walsh S, Baginsky S, Bühlmann P, Hennig L. Gruissem W. Systems-based analysis of Arabidopsis leaf growth reveals adaptation to water deficit. Molecular Systems Biology. 2012;8:606. doi: 10.1038/msb.2012.39. [DOI] [PMC free article] [PubMed] [Google Scholar]
- Barrow NJ. Phosphorus uptake and utilization by tree seedlings. Australian Journal of Botany. 1977;25:571–584. [Google Scholar]
- Beadle NCW. An alternative hypothesis to account for the generally low phosphate content of Australian soils. Australian Journal of Agricultural Research. 1962;13:434–442. [Google Scholar]
- Brooks A, Woo KC. Wong SC. Effects of phosphorus nutrition on the response of photosynthesis to CO2 and O2, activation of ribulose bisphosphate carboxylase and amounts of ribulose bisphosphate and 3-phosphoglycerate in spinach leaves. Photosynthesis Research. 1988;15:133–141. doi: 10.1007/BF00035257. [DOI] [PubMed] [Google Scholar]
- Buckee GK. Determination of total nitrogen in barley, malt and beer by Kjeldahl procedures and the Dumas combustion method: collaborative trial. Journal of the Institute of Brewing. 1994;100:57–64. [Google Scholar]
- Cai ZQ, Slot M. Fan ZX. Leaf development and photosynthetic properties of three tropical tree species with delayed greening. Photosynthetica. 2005;43:91–98. [Google Scholar]
- de Campos MCR, Pearse SJ, Oliveira RS. Lambers H. Down-regulation of net phosphorus uptake capacity is inversely related to leaf phosphorus resorption in four species from a phosphorus-impoverished environment. Annals of Botany. 2013;111:445–454. doi: 10.1093/aob/mcs299. [DOI] [PMC free article] [PubMed] [Google Scholar]
- Chapin FS. Bieleski RL. Mild phosphorus stress in barley and a related low-phosphorus-adapted barley grass: phosphorus fractions and phosphate absorption in relation to growth. Physiologia Plantarum. 1982;54:309–317. [Google Scholar]
- Ciereszko I, Johansson H, Hurry V. Kleczkowski LA. Phosphate status affects the gene expression, protein content and enzymatic activity of UDP-glucose pyrophosphorylase in wild-type and pho mutants of Arabidopsis. Planta. 2001;212:598–605. doi: 10.1007/s004250000424. [DOI] [PubMed] [Google Scholar]
- Cline K. Dabney-Smith C. Plastid protein import and sorting: different paths to the same compartments. Current Opinion in Plant Biology. 2008;11:585–592. doi: 10.1016/j.pbi.2008.10.008. [DOI] [PMC free article] [PubMed] [Google Scholar]
- Close DC. Beadle CL. The ecophysiology of foliar anthocyanin. The Botanical Review. 2003;69:149–161. [Google Scholar]
- Conn S. Gilliham M. Comparative physiology of elemental distributions in plants. Annals of Botany. 2010;105:1081–1102. doi: 10.1093/aob/mcq027. [DOI] [PMC free article] [PubMed] [Google Scholar]
- Dean C. Leech RM. Genome expression during normal leaf development: I. Cellular and chloroplast numbers and DNA, RNA, and protein levels in tissues of different ages within a seven-day-old wheat leaf. Plant Physiology. 1982;69:904–910. doi: 10.1104/pp.69.4.904. [DOI] [PMC free article] [PubMed] [Google Scholar]
- Del Pozo JC, Allona I, Rubio V, Leyva A, De La Peña A, Aragoncillo C. Paz-Ares J. A type 5 acid phosphatase gene from Arabidopsis thaliana is induced by phosphate starvation and by some other types of phosphate mobilising/oxidative stress conditions. Plant Journal. 1999;19:579–589. doi: 10.1046/j.1365-313x.1999.00562.x. [DOI] [PubMed] [Google Scholar]
- Denton MD, Veneklaas EJ, Freimoser FM. Lambers H. Banksia species (Proteaceae) from severely phosphorus-impoverished soils exhibit extreme efficiency in the use and re-mobilization of phosphorus. Plant, Cell & Environment. 2007;30:1557–1565. doi: 10.1111/j.1365-3040.2007.01733.x. [DOI] [PubMed] [Google Scholar]
- Detchon P. Possingham JV. Ribosomal-RNA distribution during leaf development in spinach. Phytochemistry. 1972;11:943–947. [Google Scholar]
- Díaz J, Barceló AR. De Cáceres FM. Changes in shikimate dehydrogenase and the end products of the shikimate pathway, chlorogenic acid and lignins, during the early development of seedlings of Capsicum annuum. New Phytologist. 1997;136:183–188. [Google Scholar]
- Dörmann P. Benning C. Galactolipids rule in seed plants. Trends in Plant Science. 2002;7:112–118. doi: 10.1016/s1360-1385(01)02216-6. [DOI] [PubMed] [Google Scholar]
- Dyer TA, Miller RH. Greenwood AD. Leaf nucleic acids: I. Characteristics and role in the differentiation. Journal of Experimental Botany. 1971;22:125–136. [Google Scholar]
- Eckardt NA, Snyder GW, Portis JAR. Ogren WL. Growth and photosynthesis under high and low irradiance of Arabidopsis thaliana antisense mutants with reduced ribulose-1,5-bisphosphate carboxylase/oxygenase activase content. Plant Physiology. 1997;113:575–586. doi: 10.1104/pp.113.2.575. [DOI] [PMC free article] [PubMed] [Google Scholar]
- Edwards C, Sanson GD, Aranwela N. Read J. Relationships between sclerophylly, leaf biomechanical properties and leaf anatomy in some Australian heath and forest species. Plant Biosystems – An International Journal Dealing with all Aspects of Plant Biology. 2000;134:261–277. [Google Scholar]
- Elser JJ. Phosphorus: a limiting nutrient for humanity. Current Opinion in Biotechnology. 2012;23:1–6. doi: 10.1016/j.copbio.2012.03.001. [DOI] [PubMed] [Google Scholar]
- Elser JJ, Dobberfuhl D, MacKay NA. Schampel JH. Organism size, life history, and N:P stoichiometry: towards a unified view of cellular and ecosystem processes. Bioscience. 1996;46:674–684. [Google Scholar]
- Epstein E. Bloom AJ. Mineral Nutrition of Plants: Principles and Perspectives. Sunderland, MA: Sinauer; 2005. [Google Scholar]
- Evans JR. Photosynthesis and nitrogen relationships in leaves of C3 plants. Oecologia. 1989;78:9–19. doi: 10.1007/BF00377192. [DOI] [PubMed] [Google Scholar]
- Farquhar GD. Sharkey TD. Stomatal conductance and photosynthesis. Annual Review of Plant Physiology. 1982;33:317–345. [Google Scholar]
- Foyer C, Walker D, Spencer C. Mann B. Observations on the phosphate status and intracellular pH of intact cells, protoplasts and chloroplasts from photosynthetic tissue using phosphorus-31 nuclear magnetic resonance. Biochemical Journal. 1982;202:429–434. doi: 10.1042/bj2020429. [DOI] [PMC free article] [PubMed] [Google Scholar]
- Fredeen AL, Raab TK, Rao IM. Terry N. Effects of phosphorus nutrition on photosynthesis in Glycine max (L.) Merr. Planta. 1990;181:399–405. doi: 10.1007/BF00195894. [DOI] [PubMed] [Google Scholar]
- Gibon Y, Blaesing OE, Hannemann J, Carillo P, Höhne M, Hendriks JHM. Stitt M. A robot-based platform to measure multiple enzyme activities in Arabidopsis using a set of cycling assays: comparison of changes of enzyme activities and transcript levels during diurnal cycles and in prolonged darkness. The Plant Cell. 2004;16:3304–3325. doi: 10.1105/tpc.104.025973. [DOI] [PMC free article] [PubMed] [Google Scholar]
- Gibon Y, Usadel B, Blaesing O, Kamlage B, Hoehne M, Trethewey R. Stitt M. Integration of metabolite with transcript and enzyme activity profiling during diurnal cycles in Arabidopsis rosettes. Genome Biology. 2006;7:R76. doi: 10.1186/gb-2006-7-8-r76. [DOI] [PMC free article] [PubMed] [Google Scholar]
- Gibon Y, Pyl E-T, Sulpice R, Lunn JE, Hoehne M, Guenther M. Stitt M. Adjustment of growth, starch turnover, protein content and central metabolism to a decrease of the carbon supply when Arabidopsis is grown in very short photoperiods. Plant, Cell and Environment. 2009;32:859–874. doi: 10.1111/j.1365-3040.2009.01965.x. [DOI] [PubMed] [Google Scholar]
- Gilbert N. The disappearing nutrient. Nature. 2009;461:716–718. doi: 10.1038/461716a. [DOI] [PubMed] [Google Scholar]
- Gniazdowska A. Rychter AM. Nitrate uptake by bean (Phaseolus vulgaris L.) roots under phosphate deficiency. Plant and Soil. 2000;226:79–85. [Google Scholar]
- Halsted M. Lynch J. Phosphorus responses of C3 and C4 species. Journal of Experimental Botany. 1996;47:497–505. [Google Scholar]
- Hanley ME. Lamont BB. Herbivory, serotiny and seedling defence in Western Australian Proteaceae. Oecologia. 2001;126:409–417. doi: 10.1007/s004420000538. [DOI] [PubMed] [Google Scholar]
- Hassiotou F, Evans JR, Ludwig M. Veneklaas EJ. Stomatal crypts may facilitate diffusion of CO2 to adaxial mesophyll cells in thick sclerophylls. Plant, Cell and Environment. 2009;32:1596–1611. doi: 10.1111/j.1365-3040.2009.02024.x. [DOI] [PubMed] [Google Scholar]
- Hassiotou F, Renton M, Ludwig M, Evans JR. Veneklaas EJ. Photosynthesis at an extreme end of the leaf trait spectrum: how does it relate to high leaf dry mass per area and associated structural parameters. Journal of Experimental Botany. 2010;61:3015–3028. doi: 10.1093/jxb/erq128. [DOI] [PMC free article] [PubMed] [Google Scholar]
- Hayes P, Turner BL, Lambers H. Laliberté E. Foliar nutrient concentrations and resorption efficiency in plants of contrasting nutrient-acquisition strategies along a 2-million-year dune chronosequence. Journal of Ecology. 2014 doi: 10.1111/1365-2745.12196. [Google Scholar]
- Heldt HW. Plant Biochemistry. 3rd edn. Oxford, UK: Elsevier Academic Press; 2005. [Google Scholar]
- Heldt HW, Chon CJ, Maronde D, Herold A, Stankovic ZS, Walker DA. Heber U. Role of orthophosphate and other factors in the regulation of starch formation in leaves and isolated chloroplasts. Plant Physiology. 1977;59:1146–1155. doi: 10.1104/pp.59.6.1146. [DOI] [PMC free article] [PubMed] [Google Scholar]
- Herold A. Lewis D. Mannose and green plants: occurrence, physiology and metabolism, and use as a tool to study the role of orthophosphate. New Phytologist. 1977;79:1–40. [Google Scholar]
- Hewitt MM, Carr JM, Williamson CL. Slocum RD. Effects of phosphate limitation on expression of genes involved in pyrimidine synthesis and salvaging in Arabidopsis. Plant Physiology and Biochemistry. 2005;43:91–99. doi: 10.1016/j.plaphy.2005.01.003. [DOI] [PubMed] [Google Scholar]
- Hopper SD. Gioia P. The Southwest Australian Floristic Region: evolution and conservation of a global hotspot of biodiversity. Annual Review of Ecology, Evolution and Systematics. 2004;35:623–650. [Google Scholar]
- Hughes NM, Morley CB. Smith WK. Coordination of anthocyanin decline and photosynthetic maturation in juvenile leaves of three deciduous tree species. New Phytologist. 2007;175:675–685. doi: 10.1111/j.1469-8137.2007.02133.x. [DOI] [PubMed] [Google Scholar]
- Hurry V, Strand Å, Furbank R. Stitt M. The role of inorganic phosphate in the development of freezing tolerance and the acclimatization of photosynthesis to low temperature is revealed by the pho mutants of Arabidopsis thaliana. Plant Journal. 2000;24:383–396. doi: 10.1046/j.1365-313x.2000.00888.x. [DOI] [PubMed] [Google Scholar]
- Irving LJ. Robinson D. A dynamic model of Rubisco turnover in cereal leaves. New Phytologist. 2005;169:493–504. doi: 10.1111/j.1469-8137.2005.01584.x. [DOI] [PubMed] [Google Scholar]
- Jordan GJ, Dillon RA. Weston PH. Solar radiation as a factor in the evolution of scleromorphic leaf anatomy in Proteaceae. American Journal of Botany. 2005;92:789–796. doi: 10.3732/ajb.92.5.789. [DOI] [PubMed] [Google Scholar]
- Jouhet J, Maréchal E, Baldan B, Bligny R, Joyard J. Block MA. Phosphate deprivation induces transfer of DGDG galactolipid from chloroplast to mitochondria. The Journal of Cell Biology. 2004;167:863–874. doi: 10.1083/jcb.200407022. [DOI] [PMC free article] [PubMed] [Google Scholar]
- Jung HG. Fahey GC. Nutritional implications of phenolic monomers and lignin: a review. Journal of Animal Science. 1983;57:206–219. [Google Scholar]
- Kelly AA, Froehlich JE. Dörmann P. Disruption of the two digalactosyldiacylglycerol synthase genes DGD1 and DGD2 in Arabidopsis reveals the existence of an additional enzyme of galactolipid synthesis. The Plant Cell. 2003;15:2694–2706. doi: 10.1105/tpc.016675. [DOI] [PMC free article] [PubMed] [Google Scholar]
- Kirschbaum M. Tompkins D. Photosynthetic responses to phosphorus nutrition in Eucalyptus grandis seedlings. Functional Plant Biology. 1990;17:527–535. [Google Scholar]
- Kursar TA. Coley PD. Delayed development of the photosynthetic apparatus in tropical rain forest species. Functional Ecology. 1992a;6:411–422. [Google Scholar]
- Kursar TA. Coley PD. Delayed greening in tropical leaves: an antiherbivore defense. Biotropica. 1992b;24:256–262. [Google Scholar]
- Laliberté E, Turner BL, Costes T, Pearse SJ, Wyrwolll K-H, Zemunik G. Lambers H. Experimental assessment of nutrient limitation along a 2-million year dune chronosequence in the south-western Australia biodiversity hotspot. Journal of Ecology. 2012;100:631–642. [Google Scholar]
- Lambers H. Poorter H. Inherent variation in growth rate between higher plants: a search for physiological causes and ecological consequences. Advances in Ecological Research. 1992;22:187–261. [Google Scholar]
- Lambers H, Shane MW, Cramer MD, Pearse SJ. Veneklaas EJ. Root structure and functioning for efficient acquisition of phosphorus: matching morphological and physiological traits. Annals of Botany. 2006;98:693–713. doi: 10.1093/aob/mcl114. [DOI] [PMC free article] [PubMed] [Google Scholar]
- Lambers H, Chapin FS. Pons TL. Plant Physiological Ecology. 2nd edn. New York: Springer; 2008a. [Google Scholar]
- Lambers H, Raven JA, Shaver GR. Smith SE. Plant nutrient-acquisition strategies change with soil age. Trends in Ecology and Evolution. 2008b;23:95–103. doi: 10.1016/j.tree.2007.10.008. [DOI] [PubMed] [Google Scholar]
- Lambers H, Brundrett MC, Raven JA. Hopper SD. Plant mineral nutrition in ancient landscapes: high plant species diversity on infertile soils is linked to functional diversity for nutritional strategies. Plant and Soil. 2010;334:11–31. [Google Scholar]
- Lambers H, Finnegan PM, Laliberté E, Pearse SJ, Ryan MH, Shane MW. Veneklaas EJ. Phosphorus nutrition of Proteaceae in severely phosphorus-impoverished soils: are there lessons to be learned for future crops? Plant Physiology. 2011;156:1058–1066. doi: 10.1104/pp.111.174318. [DOI] [PMC free article] [PubMed] [Google Scholar]
- Lambers H, Bishop JG, Hopper SD, Laliberté E. Zúñiga-Feest A. Phosphorus-mobilisation ecosystem engineering: the roles of cluster roots and carboxylate exudation in young P-limited ecosystems. Annals of Botany. 2012a;110:329–348. doi: 10.1093/aob/mcs130. [DOI] [PMC free article] [PubMed] [Google Scholar]
- Lambers H, Cawthray GR, Giavalisco P, Kuo J, Laliberté E, Pearse SJ. Turner BL. Proteaceae from severely phosphorus-impoverished soils extensively replace phospholipids with galactolipids and sulfolipids during leaf development to achieve a high photosynthetic phosphorus-use efficiency. New Phytologist. 2012b;196:1098–1108. doi: 10.1111/j.1469-8137.2012.04285.x. [DOI] [PubMed] [Google Scholar]
- Lambers H, Ahmedi I, Berkowitz O, Dunne C, Finnegan PM, Hardy GESJ. Teste FP. Phosphorus nutrition of P-sensitive Australian native plants: threats to plant communities in a global biodiversity hotspot. Conservation Physiology. 2013;1 doi: 10.1093/conphys/cot010. cot010. doi: 10.1093/conphys/cot1010. [DOI] [PMC free article] [PubMed] [Google Scholar]
- Lambers H, Colmer TD, Hassiotou F, Mitchell PM, Poot P, Shane MW. Veneklaas EJ. Carbon and water relations. In: Lambers H, editor; Plant Life on the Sandplains in Southwest Australia, A Global Biodiversity Hotspot. Crawley: UWA Publishing; 2014a. [Google Scholar]
- Lambers H, Shane MW, Laliberté E, Swarts ND, Teste FP. Zemunik G. Plant mineral nutrition. In: Lambers H, editor; Plant Life on the Sandplains in Southwest Australia, A Global Biodiversity Hotspot. Crawley: UWA Publishing; 2014b. [Google Scholar]
- Lamont BB. Bergl SM. Water relations, shoot and root architecture, and phenology of three co-occurring Banksia species: no evidence for niche differentiation in the pattern of water use. Oikos. 1991;60:291–298. [Google Scholar]
- Leegood R, Labate C, Huber S, Neuhaus HE. Stitt M. Phosphate sequestration by glycerol and its effects on photosynthetic carbon assimilation by leaves. Planta. 1988;176:117–126. doi: 10.1007/BF00392487. [DOI] [PubMed] [Google Scholar]
- Li D, Zhu H, Liu K, Liu X, Leggewie G, Udvardi M. Wang D. Purple acid phosphatases of Arabidopsis thaliana. Journal of Biological Chemistry. 2002;277:27772–27781. doi: 10.1074/jbc.M204183200. [DOI] [PubMed] [Google Scholar]
- McArthur WM. Reference Soils of South-Western Australia. South Perth: Department of Agriculture Western Australia; 1991. [Google Scholar]
- de Magalhães JV, Alves VMC, de Novais RF, Mosquim PR, Magalhães JR, Filho AFCB. Hubert DM. Nitrate uptake by corn under increasing periods of phosphorus starvation. Journal of Plant Nutrition. 1998;21:1753–1763. [Google Scholar]
- Makrides SC. Goldthwaite J. Biochemical changes during bean leaf growth, maturity, and senescence: content of DNA, polyribosomees, ribosomal RNA, protein, and chlorophyll. Journal of Experimental Botany. 1981;32:725–735. [Google Scholar]
- Marín-Navarro J, Manuell A, Wu J. Mayfield SP. Chloroplast translation regulation. Photosynthesis Research. 2007;94:359–374. doi: 10.1007/s11120-007-9183-z. [DOI] [PubMed] [Google Scholar]
- Mast AR. Givnish TJ. Historical biogeography and the origin of stomatal distributions in Banksia and Dryandra (Proteaceae) based on their cpDNA phylogeny. American Journal of Botany. 2002;89:1311–1323. doi: 10.3732/ajb.89.8.1311. [DOI] [PubMed] [Google Scholar]
- Matzek V. Vitousek PM. N:P stoichiometry and protein:RNA ratios in vascular plants: an evaluation of the growth-rate hypothesis. Ecology Letters. 2009;12:765–771. doi: 10.1111/j.1461-0248.2009.01310.x. [DOI] [PubMed] [Google Scholar]
- Miyazawa SI, Makino A. Terashima I. Changes in mesophyll anatomy and sink–source relationships during leaf development in Quercus glauca, an evergreen tree showing delayed leaf greening. Plant, Cell and Environment. 2003;26:745–755. [Google Scholar]
- Morcuende R, Bari R, Gibon Y, Zheng W, Pant BD, Blasing O. Scheible W-R. Genome-wide reprogramming of metabolism and regulatory networks of Arabidopsis in response to phosphorus. Plant, Cell & Environment. 2007;30:85–112. doi: 10.1111/j.1365-3040.2006.01608.x. [DOI] [PubMed] [Google Scholar]
- Mucina L, Laliberté E, Thiele KR, Dodson JR. Harvey J. Biogeography of kwongan: origins, diversity, endemism, and vegetation patterns. In: Lambers H, editor; Plant Life on the Sandplains in Southwest Australia, A Global Biodiversity Hotspot. Crawley: UWA Publishing; 2014. [Google Scholar]
- Nishio JN, Sun J. Vogelmann TC. Carbon fixation gradients across spinach leaves do not follow internal light gradients. The Plant Cell. 1993;5:953–961. doi: 10.1105/tpc.5.8.953. [DOI] [PMC free article] [PubMed] [Google Scholar]
- Numata S, Kachi N, Okuda T. Manokaran N. Delayed greening, leaf expansion, and damage to sympatric Shorea species in a lowland rain forest. Journal of Plant Research. 2004;117:19–25. doi: 10.1007/s10265-003-0126-2. [DOI] [PubMed] [Google Scholar]
- Pal SK, Liput M, Piques M, Ishihara H, Martins MCM, Sulpice R. Stitt M. Diurnal changes of polysome loading track sucrose content in the rosette of wild-type Arabidopsis and the starchless pgm mutant. Plant Physiology. 2013;162:1246–1265. doi: 10.1104/pp.112.212258. [DOI] [PMC free article] [PubMed] [Google Scholar]
- Pate JS, Froend RH, Bowen BJ, Hansen A. Kuo J. Seedling growth and storage characteristics of seeder and resprouter species of Mediterranean-type ecosystems of S. W. Australia. Annals of Botany. 1990;65:585–601. [Google Scholar]
- Peek J, Garcia C, Lee J. Christendat D. Insights into the function of RifI2: structural and biochemical investigation of a new shikimate dehydrogenase family protein. Biochimica et Biophysica Acta – Proteins and Proteomics. 2013;1834:516–523. doi: 10.1016/j.bbapap.2012.10.016. [DOI] [PubMed] [Google Scholar]
- Pick TR, Bräutigam A, Schlüter U, Denton AK, Colmsee C, Scholz U. Weber APM. Systems analysis of a maize leaf developmental gradient redefines the current C4 model and provides candidates for regulation. The Plant Cell. 2011;23:4208–4220. doi: 10.1105/tpc.111.090324. [DOI] [PMC free article] [PubMed] [Google Scholar]
- Pinheiro JC. Bates DM. Mixed-Effects Models in S and S-PLUS. New York, USA: Springer; 2000. [Google Scholar]
- Piques M, Schulze WX, Hohne M, Usadel B, Gibon Y, Rohwer J. Stitt M. Ribosome and transcript copy numbers, polysome occupancy and enzyme dynamics in Arabidopsis. Molecular Systems Biology. 2009;5 doi: 10.1038/msb.2009.68. 314. doi: 10.1038/msb.2009.68. [DOI] [PMC free article] [PubMed] [Google Scholar]
- Plaxton WC. Tran HT. Metabolic adaptations of phosphate-starved plants. Plant Physiology. 2011;156:1006–1015. doi: 10.1104/pp.111.175281. [DOI] [PMC free article] [PubMed] [Google Scholar]
- Prinsley RT. Leegood RC. Factors affecting photosynthetic induction in spinach leaves. Biochimica et Biophysica Acta. 1986;849:244–253. [Google Scholar]
- Pyl E-T, Piques M, Ivakov A, Schulze W, Ishihara H, Stitt M. Sulpice R. Metabolism and growth in Arabidopsis depend on the daytime temperature but are temperature-compensated against cool nights. The Plant Cell. 2012;24:2443–2469. doi: 10.1105/tpc.112.097188. [DOI] [PMC free article] [PubMed] [Google Scholar]
- Quick WP, Schurr U, Fichtner K, Schulze ED, Rodermel SR, Bogorad L. Stitt M. The impact of decreased Rubisco on photosynthesis, growth, allocation and storage in tobacco plants which have been transformed with antisense rbcS. Plant Journal. 1991;1:51–58. [Google Scholar]
- R Development Core Team. R: A Language and Environment for Statistical Computing. Vienna, Austria: R Foundation for Statistical Computing; 2012. [Google Scholar]
- Raven JA. Protein turnover and plant RNA and phosphorus requirements in relation to nitrogen fixation. Plant Science. 2012;188–189:25–35. doi: 10.1016/j.plantsci.2012.02.010. [DOI] [PubMed] [Google Scholar]
- Reich PB, Walters MB. Ellsworth DS. From tropics to tundra: global convergence in plant functioning. Proceedings of the National Academy of Sciences of the United States of America. 1997;94:13730–13734. doi: 10.1073/pnas.94.25.13730. [DOI] [PMC free article] [PubMed] [Google Scholar]
- Rudra D. Warner JR. What better measure than ribosome synthesis. Genes & Development. 2004;18:2431–2436. doi: 10.1101/gad.1256704. [DOI] [PubMed] [Google Scholar]
- Rufty TW, Israel DW, Volk RJ, Qiu J. Sa T. Phosphate regulation of nitrate assimilation in soybean. Journal of Experimental Botany. 1993;44:879–891. [Google Scholar]
- Shane MW, McCully ME. Lambers H. Tissue and cellular phosphorus storage during development of phosphorus toxicity in Hakea prostrata (Proteaceae) Journal of Experimental Botany. 2004a;55:1033–1044. doi: 10.1093/jxb/erh111. [DOI] [PubMed] [Google Scholar]
- Shane MW, Szota C. Lambers H. A root trait accounting for the extreme phosphorus sensitivity of Hakea prostrata (Proteaceae) Plant, Cell and Environment. 2004b;27:991–1004. [Google Scholar]
- Smith WK, Bell DT. Shepherd KA. Associations between leaf structure, orientation, and sunlight exposure in five Western Australian communities. American Journal of Botany. 1998;85:56–63. [PubMed] [Google Scholar]
- Stitt M. Hurry V. A plant for all seasons: alterations in photosynthetic carbon metabolism during cold acclimation in Arabidopsis. Current Opinion in Plant Biology. 2002;5:199–206. doi: 10.1016/s1369-5266(02)00258-3. [DOI] [PubMed] [Google Scholar]
- Stitt M. Quick WP. Photosynthetic carbon partitioning: its regulation and possibilities for manipulation. Physiologia Plantarum. 1989;77:633–641. [Google Scholar]
- Stitt M. Schulze E-D. Does Rubisco control the rate of photosynthesis and plant growth? An exercise in molecular ecophysiology. Plant, Cell and Environment. 1994;17:465–487. [Google Scholar]
- Stitt M, Lunn J. Usadel B. Arabidopsis and primary photosynthetic metabolism – more than the icing on the cake. Plant Journal. 2010;61:1067–1091. doi: 10.1111/j.1365-313X.2010.04142.x. [DOI] [PubMed] [Google Scholar]
- Sulpice R, Tschoep H, Von Korff M, BÜSsis D, Usadel B, HÖHne M. Gibon Y. Description and applications of a rapid and sensitive non-radioactive microplate-based assay for maximum and initial activity of d-ribulose-1,5-bisphosphate carboxylase/oxygenase. Plant, Cell & Environment. 2007;30:1163–1175. doi: 10.1111/j.1365-3040.2007.01679.x. [DOI] [PubMed] [Google Scholar]
- Sulpice R, Pyl E-T, Ishihara H, Trenkamp S, Steinfath M, Witucka-Wall H. Stitt M. Starch as a major integrator in the regulation of plant growth. Proceedings of the National Academy of Sciences. 2009;106:10348–10353. doi: 10.1073/pnas.0903478106. [DOI] [PMC free article] [PubMed] [Google Scholar]
- Sulpice R, Trenkamp S, Steinfath M, Usadel B, Gibon Y, Witucka-Wall H. Stitt M. Network analysis of enzyme activities and metabolite levels and their relationship to biomass in a large panel of Arabidopsis accessions. The Plant Cell. 2010;22:2872–2893. doi: 10.1105/tpc.110.076653. [DOI] [PMC free article] [PubMed] [Google Scholar]
- Suzuki Y, Fujimori T, Kanno K, Sasaki A, Ohashi Y. Makino A. Metabolome analysis of photosynthesis and the related primary metabolites in the leaves of transgenic rice plants with increased or decreased Rubisco content. Plant, Cell and Environment. 2012;35:1369–1379. doi: 10.1111/j.1365-3040.2012.02494.x. [DOI] [PubMed] [Google Scholar]
- Swart HJ. Australian leaf-inhabiting fungi XXIX. Some ascomycetes on Banksia. Transactions of the British Mycological Society. 1988;91:453–465. [Google Scholar]
- Tassone RA. Majer JD. Abundance of arthropods in tree canopies of Banksia woodland on the Swan Coastal Plain. Journal of the Royal Society of Western Australia. 1997;80:281–286. [Google Scholar]
- Theodorou ME. Plaxton WC. Metabolic adaptations of plant respiration to nutritional phosphate deprivation. Plant Physiology. 1993;101:339–344. doi: 10.1104/pp.101.2.339. [DOI] [PMC free article] [PubMed] [Google Scholar]
- Tschoep H, Gibon Y, Carillo P, Armengaud P, Szecowka M, Nunes-Nesi A. Stitt M. Adjustment of growth and central metabolism to a mild but sustained nitrogen-limitation in Arabidopsis. Plant, Cell & Environment. 2009;32:300–318. doi: 10.1111/j.1365-3040.2008.01921.x. [DOI] [PubMed] [Google Scholar]
- Usadel B, Bläsing OE, Gibon Y, Retzlaff K, Höhne M, Günther M. Stitt M. Global transcript levels respond to small changes of the carbon status during progressive exhaustion of carbohydrates in Arabidopsis rosettes. Plant Physiology. 2008;146:1834–1861. doi: 10.1104/pp.107.115592. [DOI] [PMC free article] [PubMed] [Google Scholar]
- Veneklaas EJ. Poot P. Seasonal patterns in water use and leaf turnover of different plant functional types in a species-rich woodland, south-western Australia. Plant and Soil. 2003;257:295–304. [Google Scholar]
- Veneklaas EJ, Lambers H, Bragg J, Finnegan PM, Lovelock CE, Plaxton WC. Raven JA. Opportunities for improving phosphorus-use efficiency in crop plants. New Phytologist. 2012;195:306–320. doi: 10.1111/j.1469-8137.2012.04190.x. [DOI] [PubMed] [Google Scholar]
- Vermerris W. Nicholson RL. Phenolic Compound Biochemistry. Dordrecht: Springer; 2006. [Google Scholar]
- Vogelman TC, Nishio JN. Smith WK. Leaves and light capture: light propagation and gradients of carbon fixation within leaves. Trends in Plant Science. 1996;1:65–70. [Google Scholar]
- Warner JR. The economics of ribosome biosynthesis in yeast. Trends in Biochemical Sciences. 1999;24:437–440. doi: 10.1016/s0968-0004(99)01460-7. [DOI] [PubMed] [Google Scholar]
- Wright IJ, Reich PB, Westoby M, Ackerly DD, Baruch Z, Bongers F. Villar R. The worldwide leaf economics spectrum. Nature. 2004;428:821–827. doi: 10.1038/nature02403. [DOI] [PubMed] [Google Scholar]
- Wright IJ, Reich PB, Cornelissen JH, Falster DS, Garnier E, Hikosaka K. Westoby M. Assessing the generality of global leaf trait relationships. New Phytologist. 2005;166:485–496. doi: 10.1111/j.1469-8137.2005.01349.x. [DOI] [PubMed] [Google Scholar]
- Wyrwoll K-H, Turner BL. Findlater P. On the origins, geomorphology and soils of the sandplains of south-western Australia. In: Lambers H, editor; Plant Life on the Sandplains in Southwest Australia, A Global Biodiversity Hotspot. Crawley: UWA Publishing; 2014. [Google Scholar]
- Zrenner R, Stitt M, Sonnewald U. Boldt R. Pyrimidine and purine biosynthesis and degradation in plants. Annual Review of Plant Biology. 2006;57:805–836. doi: 10.1146/annurev.arplant.57.032905.105421. [DOI] [PubMed] [Google Scholar]
Associated Data
This section collects any data citations, data availability statements, or supplementary materials included in this article.
Supplementary Materials
Rates of expansion of Arabidopsis thaliana rosette leaves; plants were grown in short days (8 h/16 h light/dark).
Table S1. Recovery of enzyme activities. Powdered samples were prepared from a standard greenhouse-grown Arabidopsis (‘Arabidopsis’) and from a mix in equal parts of Banksia attenuata, B. menziesii and B. candolleana (‘Banksia-mix’). These powders were either extracted and assayed for enzyme activities separately, or combined in a 1:1 ratio (Banksia-mix + Arabidopsis) before extraction. The recovery of Arabidopsis enzyme activity was calculated as 100 × [Activity in (‘Banksia-mix + Arabidopsis)’ – (Activity in ‘Banksia mix' × 0.5) ] / (Activity in ‘Arabidopsis’ × 0.5) × 100. This table also shows the abbreviations used for each enzyme, and assignment of each enzyme to a metabolic pathway as well as the dilution factor used for the assays and incubation times.
Table S2. Threshold cycle values of external RNA standards in six Proteaceae species and in Arabidopsis thaliana.
Table S3. Primers used for the determination of ribosome copy numbers in Proteaceae species and Arabidopsis taliana. List of the rRNA genes and spike controls (ArrayControl RNA Spikes; Applied Biosystems/Ambion, Darmstadt, Germany) use in qRT-PCRs.
Table S4. Rates of expansion of Arabidopsis thaliana rosette leaves; plants were grown in short days (8 h/16 h light/dark).
Table S5. Ribosome abundance in Arabidopsis thaliana and in six Proteaceae species.
Table S6. Molecular weight of ribosomal proteins.
Table S7. Percentage of investment of total phosphorus (P) in ribosomes.
Table S8. Starch concentrations (μmol glucose units g–1 dry mass) of fully expanded, mature leaves of Banksia species growing in their natural habitat. Leaves were collected either before dawn or later during the day, which started sunny, but with some clouds after 1130 h. Mean values and SE (n = 6). The time to produce this amount of starch was calculated from the concentrations as shown here, the leaf area per unit dry weight (Table 2) and published data on photosynthesis of plants grown in the same environment (Lambers et al. (2012b).
Table S9. Phosphorus content in ribosomal RNA.