Abstract
This paper examines cognition measures by age and gender from two types of studies in China and India. It finds that despite some notable differences in samples and measures, a general strong association of cognition in older ages with education emerges as a potential explanation for gender gaps and cohort differences. Female disadvantage in cognition is greater in India, both before and after controlling for education. The process of rural-urban migration draws more cognitively able women to cities in China but not in India. The advent of modern longitudinal studies of aging in these developing countries holds great promise for future work.
Introduction
Aging, once a luxury of wealthy populations, is advancing rapidly in the developing world. The context of development creates unique patterns and challenges for population aging, such as vast inequality across regions and cohorts that pass through stages of development at different times (Kowal P & Collaborators., 2012). The aged population of today and tomorrow is the legacy of development in the past. One of the signal challenges of aging is cognitive decline, and one of the signal consequences of inequality in economic and educational resources is inequality in cognitive ability. Cognition affects the capacity to acquire and use information, to make good decisions, and ultimately to remain independent and care for oneself. It thus severely constrains policy aimed at caring for the elderly. One recent paper projects that the legacy of low cognition in the older populations of today’s developing countries will put them at a disadvantage for many years to come (Skirbekk, Loichinger, & Weber, 2012).
This paper focuses on one particular dimension of inequality in cognition – gender differences. Previous research has shown that gender differences are larger in India and China than in developed countries, and that in China these differences appear to be related to economic development (Lei, et al, 2012). We propose to broaden this descriptive work in two ways. First, by drawing on the WHO Study of Global Aging and Adult Health (SAGE) as a comparison to the HRS-like studies for China (CHARLS) and India (LASI) we hope to identify robust relationships and potentially guide further development of aging studies in these important countries. Second, the comparison of India and China is inherently interesting in view of the very different political and economic contexts for development. Of particular interest for the study of cognition is whether the cognitive stimulation of environments in adulthood can compensate for disadvantages in childhood education. Urban and rural locations offer substantially different environments for developing and maintaining cognitive function both at early and later stages of life. China and India differ in their recent internal migration histories. We explore differences in cognition in urban and rural areas, and among migrants who spent their early and later years in different environments.
Because of the very recent availability of partial data from the full baseline sample of CHARLS, we will focus first on China, comparing the two studies and introducing the measures and methods. We then turn briefly to India for comparison with China. Since level of education has been shown to be strongly associated with cognitive ability and the risk for cognitive decline later in life (Tucker & Stern, 2011), we describe trends in education across cohorts alongside trends in cognition for both countries
1. Two studies of China’s older population
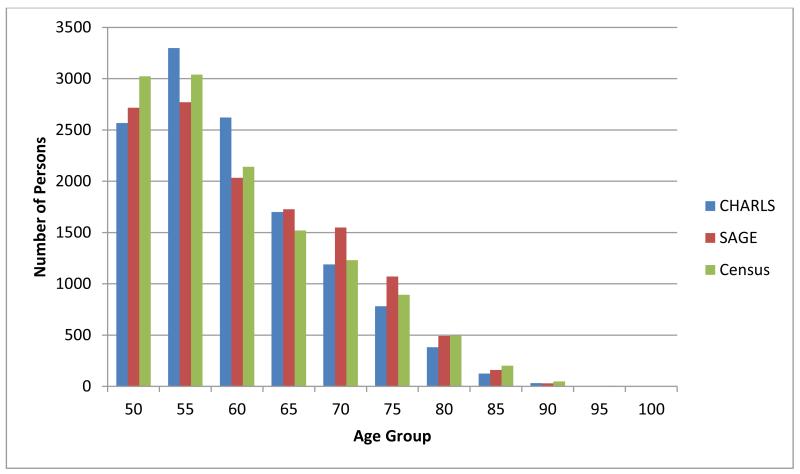
We show in Figure 1 the unweighted sample sizes in the two studies for ages 50 and older. The total sample sizes are very similar, and we show the hypothetical distribution of a similarly-sized sample using the 2010 Chinese Census age distribution. Broadly speaking, both SAGE and CHARLS capture the older population fairly well, and neither study deliberately oversamples specific age groups within the 50+ population. The SAGE 50+ sample is somewhat older: CHARLS has relatively large samples between 55 and 65, and SAGE has relatively larger samples over age 70. We do not show here the effect of sampling weights in the two studies, which do not necessarily match exactly the Census distribution.
Figure 1.
Unweighted sample sizes in CHARLS and SAGE, by age, compared with Census
1.1 Education
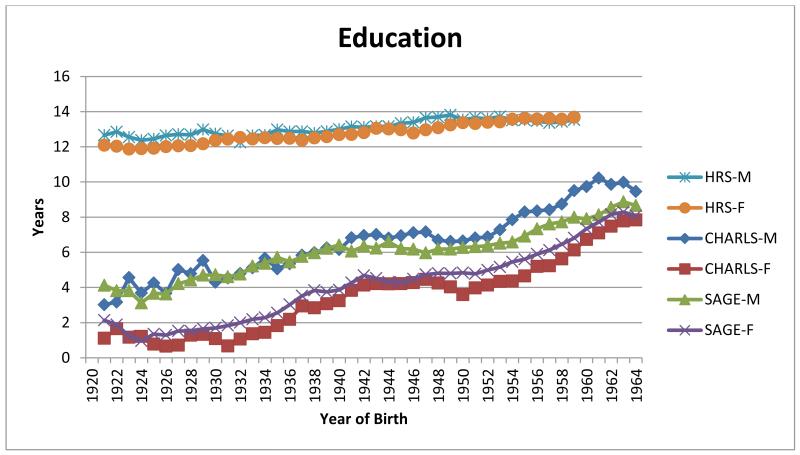
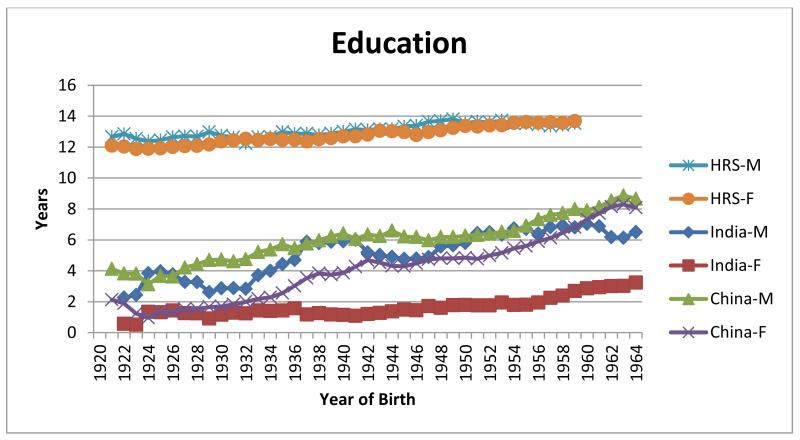
We begin with education, as measured by self-reported years of schooling. This is shown by (three-year moving averages of) year of birth in Figure 2. The large education gap of nearly nine years between the US and China in the birth cohorts before 1940 closes to about six years in the cohorts born around 1960. The gender gap in education in the US is small, and reverses from a small male advantage to a small female advantage. In China, the gender gap is significantly larger, and its evolution differs between CHARLS and SAGE. Women have slightly higher education in SAGE in most cohorts, mainly because of smaller proportions with no formal schooling than in either CHARLS or the China Census of 2012, but the two studies remain close throughout. For men, the two studies are close through the cohorts of 1940. After that point, the education of men in SAGE improves less quickly, so that by the cohorts around 1960 there is very little gender gap according to SAGE. In CHARLS, men’s education continues to rise and the gender gap closes little between the cohorts of 1940 and 1960. This is an important contrast between two studies of the same population, with significant implications for the study of cognition. More information is needed about the SAGE sample to understand the contrast.
Figure 2.
Years of schooling, by year of birth in the US and China
We also point out the dip in educational attainment for cohorts born in the early 1950s. These are the children whose education would have been disrupted during the Great Leap Forward of 1958-60. We do not explore this issue, but the fact that both Chinese studies are able to detect these effects is noteworthy.
1.2 Cognition measures
Because of the importance of cognition and cognitive decline among older adults, the HRS and its sister studies have made cognitive measurement a priority. The Mini-mental State Exam (MMSE) (Folstein, Folstein, & McHugh, 1975) and the related Telephone Interview for Cognitive Status (TICS) (Brandt, Spencer, & Folstein, 1988) are the touchstones for the approach used in the HRS studies, which emphasizes effective assessment in short batteries. The SAGE studies also measure cognition, using well-established tests, but tests which differ from those in the HRS family of studies in ways that make direct comparison difficult to impossible. It is also important to consider the specific mental capacities measured by different cognitive tests, as these respond differently to age, education, and gendered social experience. The capacities tapped by one or more of the studies in this paper are: episodic memory, orientation, attention (mental status), working memory, and language (retrieval fluency). The HRS also has measures of numeracy and a numeric test of fluid intelligence, both of which could easily be added to studies in China and India.
1.2.1 Verbal Episodic memory
The single most important domain of cognition to measure in an aging population is short-term memory. This is generally done with word recall tasks. The ability to recall words read from a list declines with normal aging and is highly sensitive to the brain changes in the early stages of Alzheimer’s disease. Established word lists are available in most languages. The main differences in test administration are the number of words used, and the number of times the list is repeated. The HRS began in 1992 with a 20-word list. Following the introduction of the older AHEAD cohort in 1993 the study adopted a 10-word list for all age groups. Ten words seems perfectly adequate for the 50+ population—very few people are able to recall ten words, even immediately after they are read. SAGE also uses a ten-word list. However, SAGE follows a practice common in clinical tests of cognition, which is to repeat the word list three times, asking the subject to repeat them back after each reading. The HRS studies do not repeat the list. With repetition, the number of words recalled immediately after reading goes up. Repetition also increases the number of words recalled several minutes later. The rationale for the repetition approach is that the subject’s memory is “saturated” by the initial readings and so the delayed recall becomes a better measure of short-term memory loss. In fact, the number of words forgotten between the immediate recall and the delayed recall bears no relation to age or education in SAGE, or in the HRS studies. Further work is needed to determine whether the extra time needed for the SAGE approach has any value for tracking cognitive decline.
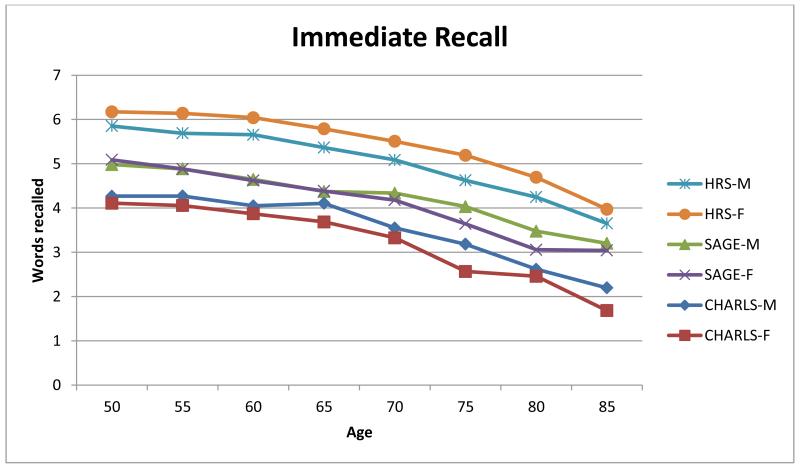
Figure 3 below compares the immediate recall scores in CHARLS and HRS with the recall score on the first repetition in SAGE. This in theory should be the most comparable version of the SAGE measures. Somewhat surprisingly, even on the first recall SAGE participants perform substantially better than CHARLS. Both China studies show lower performance than in HRS. We can find nothing in the description of the SAGE protocol that would explain why performance might be better, nor do we have any strong reasons to suppose that the SAGE sample would be cognitively superior. CHARLS, like HRS, used proxy interviews for some respondents, including some with cognitive impairment. SAGE did not, which ought to lower average performance in SAGE, unless SAGE simply did not interview people with poorer cognition. In the HRS, it is females who have the higher immediate recall scores. In SAGE and CHARLS there is little gender difference for ages 50-65, and a male advantage at older ages. All three studies show generally similar declines with age.
Figure 3.
Short-term memory: Immediate recall (first trial) in HRS, CHARLS, and SAGE
1.2.2 Orientation
Another set of tests involves simple questions about the date and day of week. HRS also has additional items about the names of common objects, and the names of the President and Vice-President. CHARLS has a question about season of the year. SAGE does not have these tasks. These items are not very sensitive to differences in ability at younger ages where very few errors are made. For this reason, HRS does not ask them of respondents under 65 years of age (asked only at baseline wave). They are useful for identifying cases of more severe cognitive impairment and dementia.
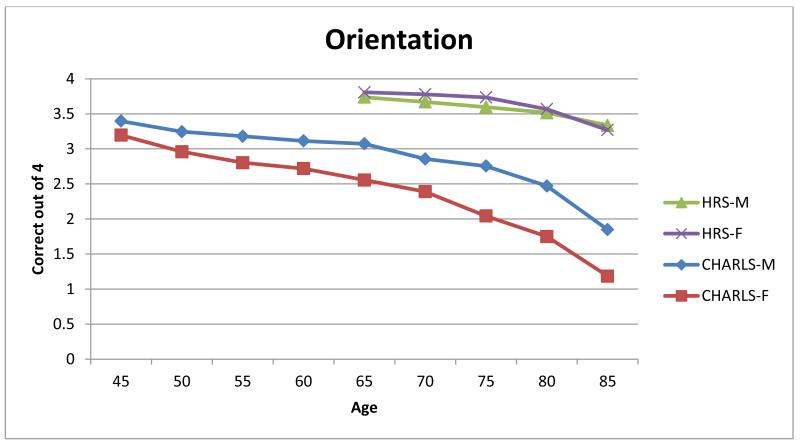
Figure 4 compares a 4-item orientation score from the items common to CHARLS and HRS. Somewhat surprisingly, performance in CHARLS is substantially lower and declines more rapidly with age than it does in the HRS. There is also a decided male advantage in China, compared with a very slight female advantage in the US. It is possible that this reflects differences between countries in the importance of knowing dates or the exposure to information about dates.
Figure 4.
Orientation (to time) in HRS and CHARLS
1.2.3 Attention
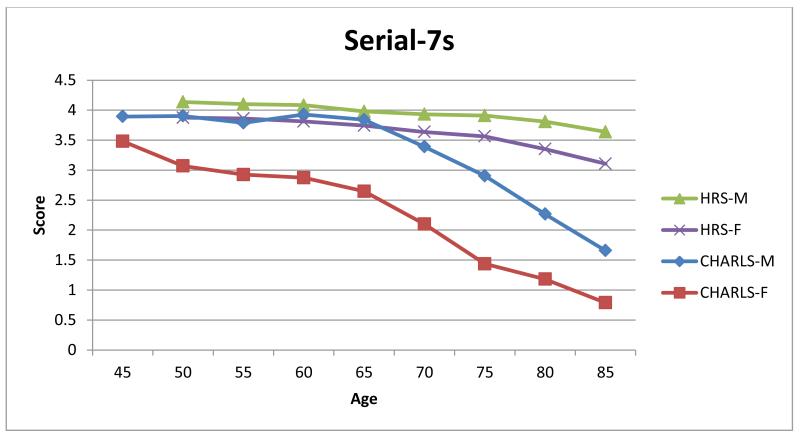
Another important cognitive capacity is the ability to attend to a task, or to “stay on” task. A common test for this ability is serial-7s, the repeated subtraction of 7 starting from 100. It is used in the HRS studies, but not in SAGE. Because it involves arithmetic operations, performance may be affected by numeric ability as well as by the ability to attend to task.
Figure 5 compares serial-7 scores in CHARLS to HRS. In both studies respondents were asked to subtract 7 five times, starting from 100. A perfect score of 5 would be (93,86,79,72,65). In both countries, we calculated scores by treating as correct an answer that was either the correct number in the fully correct sequence just shown, or was seven fewer than the answer given previously.
Figure 5.
Serial-7s in CHARLS and HRS
As we saw with orientation, the scores in CHARLS on this domain decline more rapidly with age than in HRS. There is a male advantage on this task in the US, and a large male advantage in China. Up to about age 65 Chinese men do about as well as American women.
1.2.4 Working memory
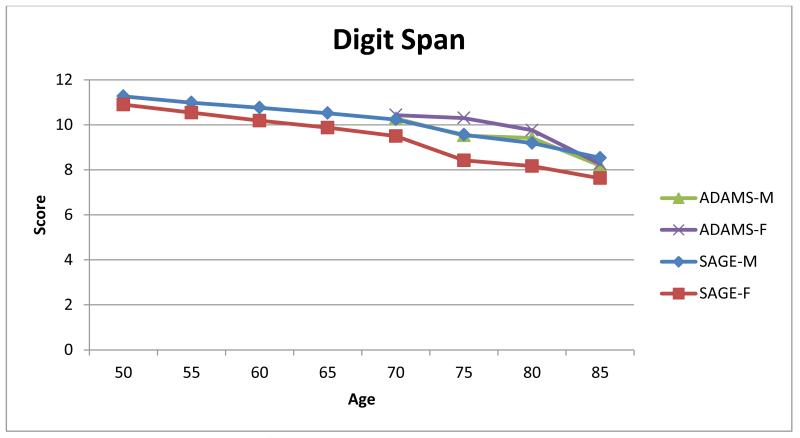
SAGE uses a common measure known as the digit-span test to measure working memory. Subjects are read lists of single-digit numbers and asked to repeat them in order. They receive progressively longer lists until they fail twice to repeat lists of a given length. This is then repeated with lists being repeated back in reverse order. Neither CHARLS nor the HRS conducted this test. However, the ADAMS sub-study of the HRS did include it, for persons 70 and older, and we show it for comparison.
As shown in Figure 6, in contrast to what we saw in the CHARLS comparisons of orientation and attention, the SAGE measure of working memory is very close to the US levels at older ages—virtually identical for men. Women in the ADAMS did slightly better than men, and women in SAGE did somewhat worse than men.
Figure 6.
Digit-span in SAGE and ADAMS
1.2.5 Language (retrieval fluency)
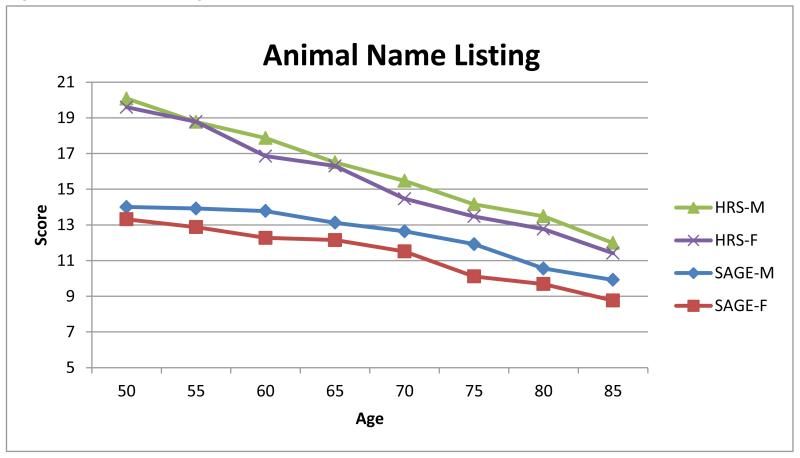
Retrieval fluency is commonly measured by asking people to name as many specific varieties within a general category as they can in a short time frame. The most common test is to name animals in sixty seconds. This test was recently added to the HRS and is used in SAGE but not the other HRS studies. On this task, SAGE participants score significantly lower than in HRS (Figure 7). There is a nearly linear decline with age in the HRS, whereas in SAGE there is relatively little decline before age 65. In both countries there is a modest male advantage.
Figure 7.
Animal Naming in HRS and SAGE
1.3 Human capital from childhood and adult cognition
1.3.1 Education and cognition
A significant number of studies in developed countries have shown that formal education is associated with better cognition and a reduced risk of late-life cognitive decline and dementia (Valenzuela and Sachdev, 2006), through multiple causal pathways, including a direct effect on brain development and function (i.e., the building of “cognitive reserve”), better life-long health behaviors, and the general health advantages of having more wealth and social opportunities (Cagney and Lauderdale 2002). In developing countries, older adults likely face substantially different environments and challenges than older adults in developed countries (Skirbekk et al., 2012), making an examination of the relationship of education to cognition in developing countries important. Huang and Zhao (2013) provide some evidence that education and cognition are correlated in China. They use pilot data from CHARLS to investigate whether achieving primary school education has a causal effect on later-life cognitive scores. The Chinese Famine provides a regression discontinuity -- children of primary school age during the famine were substantially less likely to complete primary school than their slightly older counterparts. They find lower cognitive ability among those adults whose education was affected by the famine than slightly older adults. Using an RD-IV framework, they attribute this difference to lower levels of education.
Turning now to our data on China, we have seen that education levels have increased across cohorts, and a slight male advantage remains. Differences in education over time and between genders may explain some of the trends in the cognitive gender gap identified earlier. Table 1 explores the association of education with three cognitive measures in CHARLS – Total recall, Serial 7s, and orientation. Prior to adjusting for differences in education, males register substantially higher cognitive scores than females, as shown by the statistically significant negative coefficient on Female in Model 1 in all three tests. Table 1 shows a serial 7s score that is 1 point higher, a recall score ½ word higher, and an orientation score ½ point higher for men than women. These differences reduce dramatically after controlling for education in Model 2. The gender gap in serial 7s declines by more than half, and the gender gap in orientation essentially disappears. The gender gap in word recall actually reverses; the female age and education-adjusted score is 1/3 word higher than the analogous male score. This is consistent with findings in the United States, where female recall scores are higher than male scores.
Table 1.
Gender gaps controlling for age and education, CHARLS
| Word Recall | Serial 7s | Orientation | ||||
|---|---|---|---|---|---|---|
| Model 1 | Model 2 | Model 1 | Model 2 | Model 1 | Model 2 | |
| Age | 0.253*** (0.0659) |
0.330*** (0.0587) |
0.218*** (0.0259) |
0.240*** (0.0237) |
0.112*** (0.0242) |
0.135*** (0.0235) |
| Age2/100 | −0.277*** (0.0489) |
−0.305*** (0.0435) |
−0.205*** (0.0195) |
−0.201*** (0.0182) |
−0.115*** (0.0186) |
−0.117*** (0.0179) |
| Female | −0.448*** (0.0908) |
0.375*** (0.0828) |
−1.034*** (0.0398) |
−0.434*** (0.0377) |
−0.487*** (0.0320) |
−0.0274 (0.0284) |
| Years of Ed | 0.293*** (0.0260) |
0.338*** (0.0142) |
0.237*** (0.00912) |
|||
| YrsEd2/100 | −0.214 (0.193) |
−1.277*** (0.105) |
−0 779*** (0.0506) |
|||
| Constant | 2.132 (2.173) |
−3.445 (1.948) |
−1.815* (0.845) |
−4.794*** (0.765) |
1.520 (0.776) |
−0.953 (0.761) |
|
| ||||||
| N adj. R-sq |
13378 0.099 |
13378 0.222 |
13378 0.158 |
13378 0.328 |
13378 0.099 |
13378 0.271 |
1) Standard errors in parentheses
2) p<.05,
p<.01,
P<.001
Because women received less formal education than men, we allow for non-linear effects of education on cognition so as not to confound gender differences with non-linear returns to education. These are particularly pronounced for Serial 7s and Orientation, where it appears that there are decreasing returns to education at higher levels of education. This may, however, reflect the ceiling effect in those two measures—a large fraction of the sample gets the top score available and this has the appearance of little benefit to education at higher levels of education.
The effects of education on the gender gaps according to the SAGE measures are shown in Table 2 Overall, the results are very similar to the measures in CHARLS. Although the SAGE word recall measure is administered differently and has a higher mean score than CHARLS, the gender gap similarly reverses to female advantage after controlling for education. Accounting for differences in education reduces the male advantage in the SAGE digit span and animal naming tasks by more than half.
Table 2.
Gender gaps controlling for age and education, SAGE
| Word Recall | Digit Span | Animal Naming | ||||
|---|---|---|---|---|---|---|
| Model 1 | Model 2 | Model 1 | Model 2 | Model 1 | Model 2 | |
| Age | 0.128* (0.0541) |
0.148** (0.0514) |
0.111** (0.0363) |
0.129*** (0.0332) |
0.296*** (0.0689) |
0.323*** (0.0659) |
| Age2/100 | −0.195*** (0.0414) |
−0.185*** (0.0394) |
−0.144*** (0.0278) |
−0.138*** (0.0254) |
−0.308*** (0.0522) |
−0.301*** (0.0497) |
| Female | −0.133 (0.0700) |
0.358*** (0.0676) |
−0.586*** (0.0476) |
−0.182*** (0.0451) |
−1.101*** (0.0955) |
−0.543*** (0.0950) |
| Years of Ed | 0.339*** (0.0230) |
0.252*** (0.0145) |
0.313*** (0.0334) |
|||
| YrsEd2/100 | −0.656*** (0.162) |
−0.261* (0.102) |
−0.00528 (0.259) |
|||
| Constant | 9.349*** (1.737) |
5.928*** (1.657) |
9.498*** (1.165) |
6.667*** (1.073) |
7.108** (2.241) |
3.176 (2.154) |
|
| ||||||
| N adj. R-sq |
12478 0.106 |
12478 0.195 |
12478 0.106 |
12478 0.246 |
12478 0.058 |
12478 0.130 |
1) Standard errors in parentheses
2) p<.05,
p<.01,
P<.001
The age slopes we saw in the descriptive graphs reflect a combination of true age effects and cohort differences, including cohort differences in education. Using the quadratic regression terms for age from the regressions we can calculate the estimated slope at age 70 from the regressions with and without controlling for education. In all six cognition measures across the two studies, the slope at age 70 falls by about a quarter after controlling for education, indicating that cohort differences in education are a significant part of the observed profiles of cognitive decline by age from these cross-section studies.
1.3.2 Other mechanisms
The strong association of education with cognition in later life appears to go a long way toward explaining trends and gender gaps in cognition. From the available data we cannot make strong causal inferences, however. For example, other inputs to child development, such as nutrition, may co-vary with education and affect later-life cognition. Adult height is influenced by both food intake and the burden of diarrheal and other diseases in childhood. It has been shown to be related to later-life cognition in the US (Case and Paxson, 2008, using the HRS), and in developing countries (Maurer, 2010).
To explore other mechanisms we first reduce the complexity by combining cognitive scores into a single composite score (simple addition in the case of CHARLS, and for SAGE addition with the animal naming divided by 2). In Table 3, we then replicate Model 2 of Table 1 for the composite score, and show the effect of adding height. Because mean height differs systematically by gender due to genetic differences, it is not simple to infer the gender gap in cognition when height is included. To get around this, we have transformed height into deviations from gender-specific means, so the gender gap is measured at the mean height of each gender when height is included (as it is when height is not included).
Table 3.
Summary Cognition: Effects of education, height, and gender interactions
| CHARLS | SAGE-China | |||||
|---|---|---|---|---|---|---|
| Model 1 | Model 2 | Model 3 | Model 1 | Model 2 | Model 3 | |
| Age | 0.606*** (0.0950) |
0.603*** (0.0956) |
0.592*** (0.0961) |
0.438*** (0.0920) |
0.429*** (0.0910) |
0.427*** (0.0909) |
| Age2/100 | −0.544*** (0.0716) |
−0.527*** (0.0720) |
−0.519*** (0.0725) |
−0.473*** (0.0705) |
−0.458*** (0.0697) |
−0.456*** (0.0696) |
| Female | −0.168 (0.133) |
−0.252 (0.133) |
−0.729*** (0.206) |
−0.0816 (0.122) |
−0.130 (0.121) |
−0.0406 (0.246) |
| Yrs of Ed | 0.854*** (0.0472) |
0.838*** (0.0483) |
0.791*** (0.0596) |
0.750*** (0.0429) |
0.713*** (0.0425) |
0.700*** (0.0607) |
| EdYrs2 | −2.231*** (0.373) |
−2.312*** (0.382) |
−2.371*** (0.408) |
−0.941** (0.314) |
−0.887** (0.310) |
−0.663 (0.395) |
| Height | 0.0992*** (0.00891) |
0.0828*** (0.0120) |
0.0664*** (0.00867) |
0.0530*** (0.0125) |
||
| FemaleXEd | 0.0108 (0.0898) |
0.0310 (0.0823) |
||||
| FemaleXEd2 | 0.768 (0.723) |
−0.529 (0.608) |
||||
| FemaleXHeight | 0.0336* (0.0170) |
0.0279 (0.0168) |
||||
| Constant | −6.118* (3.097) |
−6.421* (3.117) |
−5.721 (3.140) |
14.12*** (2.971) |
14.31*** (2.940) |
14.33*** (2.941) |
|
| ||||||
| N adj. R-sq |
10598 0.355 |
10598 0.368 |
10598 0.371 |
12326 0.287 |
12364 0.291 |
12364 0.291 |
1) Standard errors in parentheses
2) p<.05,
p<.01,
P<.001
Although the summary cognition measure is not the same in the two studies, the general findings are very similar. Education is strongly associated with cognition. In Model 2 of Table 3, height is strongly related to cognition, and adding it improves the model fit and only slightly reduces the effect of education, indicating that it is measuring a separate contribution to later-life cognition.
The results so far have assumed that the factors affecting cognition—education and height—affect both sexes equally. That assumption is tested in Model 3 of Table 3 by including interaction terms that allow the effects of education and height to be different for females. For SAGE, the assumption of no difference in effect seems very reasonable. None of the interaction terms is statistically significant and the overall model fit is not improved by their inclusion (an F-test for joint significance is failed). For CHARLS there is a modest difference: both height and education (combining both terms of the quadratic) have slightly stronger benefits for women’s cognition (and an F-test rejects the hypothesis that these coefficients are jointly zero). Allowing for different effect sizes by gender increases the estimated gender gap in CHARLS (at zero education and mean age and height).
Further examination of the component cognition items shows that the main source of the differential effect of education in CHARLS is the serial 7s task, which has no clear counterpart in SAGE. It suggests that education is particularly beneficial for women’s numeric skills. Enhancing these studies with better numeracy measures would allow a better appreciation of this issue.
1.4 Migration, location, and cognitive differences
Urban and rural environments offer different advantages and disadvantages for developing and maintaining cognitive ability. Lee et al. (2011) identify a gender gap in cognition in the LASI pilot and find that it is substantially larger in the north than in the south – environment appears to matter, although the specific factors causing the difference in gender gap between north and south remain to be clarified. Low levels of childhood nutrition, more likely in rural areas, can also decrease cognitive ability (Black et al., 2008). Lei et al. (2012) point to the gender gap in adult height as an indicator that Chinese women were more likely to suffer from malnutrition in their childhood then Chinese men, suggesting that differential childhood nutrition is a factor contributing to the gender gap in cognition in China.
Cognitive stimulation during adulthood may also differ by location and can affect maintenance of cognitive abilities. Social involvement (Engelhardt et al, 2010), exercise (Erickson et al., 2011), and cognitive training (Ball et al., 2002) have all been found to help maintain cognitive ability among older adults. Urban areas offer more media exposure and a higher average level of education in the population, thus offering higher levels of cognitive stimulation. Spitz-Oener (2006) finds that, as countries develop, the technology workers must use in the workplace is rapidly changing. This poses a challenge for adults with low cognition as they may face more difficulties in adapting to a new environment. However, if they are able to adapt and continue working, the mental stimulation that the job provides could help to maintain their cognitive ability as they age.
While differences in educational achievement accout for all of the gender gap in short-term memory among older Chinese, some of the cognitive gap measured by serial 7s, orientation, digit repetition, and animal naming tasks remains after controlling for education. This section discusses population and migration patterns in urban and rural areas. It then considers differences in the cognitive gap in urban and rural areas, and a possible role of migration in cognitive differences across genders
Rural to urban migration is a central feature of economic development. This is certainly true in China, where the urban population has swelled from about 20 percent in the early 1980s to 53 percent today. Table 4 sheds light on how the Chinese population over 50 has been affected by this widespread migration. Urban areas are currently home to 48 percent of the older population (45 percent in SAGE). These are about 10 percentage points higher than the percent born in urban areas, indicating the importance of migration. Migration is measured somewhat differently in the two studies. SAGE counts more very local moves, which results in higher rates of within-rural migration, particularly for women. It shows lower rates of migration out of rural areas into urban areas.
Table 4.
Migration and Location in China, population 50+
| CHARLS | SAGE-China | |||||
|---|---|---|---|---|---|---|
| Male | Female | All | Male | Female | All | |
| %Urban born | 37.3% | 38.5% | 37.9% | 35.9% | 41.5% | 38.7% |
| % Urban resident | 47.1% | 49.6% | 48.4% | 41.8% | 49.3% | 45.6% |
| Of rural-born | ||||||
| % rural migrant | 2.7% | 7.4% | 5.1% | 3.2% | 24.9% | 13.7% |
| % urban migrant | 15.6% | 18.2% | 16.9% | 8.5% | 12.5% | 10.5% |
The relevance of urban versus rural location and migration to cognition later in life is likely complex. Boys and girls attain, on average, less education in rural than in urban areas. As indicated above, higher levels of education are associated with higher cognitive ability later in life. Net of education, cognition could vary by rural and urban origins due to differences in the quality of education or the quantity or quality of other unmeasured inputs to cognitive development. Net of education, cognition could vary across rural and adult residence because of differences in cognitive training for work or the amount of mental stimulation later in life.
To examine the role of location and migration on cognitive scores net of education, we build on the regressions of the previous section. Individual residuals from regressions of cognition on age and education and their squares represent the extent to which an individual’s combined cognitive score differs from what would be expected given his or her age and education. These then serve as dependent variables in regressions exploring the role of place and of migration in shaping cognition at older ages.
Table 5 explores relevant gender differences in urban and rural areas. Not surprisingly, educational levels are higher in urban areas than in rural areas for both men and women. The CHARLS data suggest a substantially smaller gender gap in education among urban dwellers. In SAGE, this difference is negligible. Table 5 presents the mean net-of-education score for rural and urban males and females. Net of education, urban males have slightly better cognition scores than rural men, while urban women show a greater advantage over their rural counterparts. As a result, gender gaps in cognition are smaller in urban areas than rural, even after controlling for education. For example, in CHARLS, the gender gap net of education measured by serial 7s is 1/3 the size in urban areas of what it is in rural areas. Orientation scores are higher across the board in urban areas, and the gender gap visible in rural areas is absent in urban areas. The absence of a gender gap in orientation in urban areas could be a direct result of the amount of information and cognitive stimulation in the environments. The orientation task mainly reflects knowledge of date and day of week—information that is both more readily available and more necessary in urban settings. In SAGE, too, we see smaller gender gaps in urban areas. Despite a similar gender gap in education across rural and urban areas of birth, the digit and animal-naming cognitive gaps net of education are substantially lower in urban areas.
Table 5.
Education and Cognitive Gaps in Urban and Rural Areas
| CHARLS | SAGE | ||||||
|---|---|---|---|---|---|---|---|
| Male | Female | Gap | Male | Female | Gap | ||
| Rural | Rural | ||||||
| Education | 5.68 | 2.24 | −3.44 | Education | 4.83 | 2.68 | −2.15 |
| Recall | −0.27 | 0.04 | 0.31 | Recall | −0.19 | −0.04 | 0.15 |
| Serial 7s | 0.30 | −0.46 | −0.77 | Digits | −0.07 | −0.42 | −0.35 |
| Orientation | −0.09 | −0.32 | −0.23 | Animals | 0.07 | −0.67 | −0.74 |
| Urban | Urban | ||||||
| Education | 8.70 | 5.81 | −2.89 | Education | 8.41 | 6.30 | −2.11 |
| Recall | −0.04 | 0.28 | 0.31 | Recall | −0.10 | 0.34 | 0.45 |
| Serial 7s | 0.22 | −0.04 | −0.25 | Digits | 0.33 | 0.24 | −0.09 |
| Orientation | 0.21 | 0.23 | 0.02 | Animals | 0.52 | 0.18 | −0.35 |
The better cognition and smaller gender gap in urban areas could reflect the different adult environment, or it could reflect differences in where education was obtained, or it could reflect selectivity of migration. To attempt to shed light on these alternatives, we return to the composite cognition measure and again calculate net-of-education scores by taking individual residuals from a regression on age and education and their squares. Table 6 shows these total cognition scores net of education by place of birth and residence. There is essentially no urban to rural migration in these studies. The urban-born have higher cognition and lower gender gaps than all rural-born taken together. So, too, all urban adult residents whatever their birthplace have higher cognition and lower gender gaps than rural-residing adults. In CHARLS, rural to urban migrants have the highest cognition scores conditional on education, and rural stayers the lowest. In SAGE, female rural to urban migrants are only very slightly higher than urban stayers, and male migrants are below urban stayers. Both studies show that female disadvantage is greatest among rural stayers, and female advantage highest among rural urban migrants.
Table 6.
Cognition Net of Education: Relationship to Location and Migration
| CHARLS | ||||
|---|---|---|---|---|
| Place of | Cognition net of Ed | |||
| Birth | Residence | Male | Female | Gap |
| Urban | Urban | 0.27 | 0.46 | 0.18 |
| Rural | Rural | −0.24 | −0.60 | −0.37 |
| Rural | Urban | 0.60 | 0.90 | 0.30 |
| All | Urban | 0.35 | 0.54 | 0.19 |
| Rural | All | −0.11 | −0.33 | −0.23 |
| SAGE-China | ||||
|---|---|---|---|---|
| Place of | Cognition net of Ed | |||
| Birth | Residence | Male | Female | Gap |
| Urban | Urban | 0.49 | 0.66 | 0.18 |
| Rural | Rural | −0.26 | −0.76 | −0.50 |
| Rural | Urban | 0.32 | 0.74 | 0.42 |
| All | Urban | 0.47 | 0.68 | 0.22 |
| Rural | All | −0.20 | −0.56 | −0.35 |
The cognitive advantage of rural to urban migrants raises the question of whether this could be due entirely to selective migration, or whether it might reflect advantages of adult residence in urban areas. We cannot identify these effects separately from the available data. We can, however, ask whether the extent of selectivity implied by these cognitive differences is in line with what we see in other variables like education and height that are determined in childhood and thus not likely to be influenced by adult residence. To compare selectivity across such different variables, we use percentiles. For each variable, we calculate the percentile distribution by gender among the rural-born. Then, we calculate the mean percentile rank of rural-urban migrants. Results are shown in Table 7.
Table 7.
Selectivity of Migration: Percentile rank of rural-urban migrants among all rural-born.
| CHARLS | SAGE-China | |||||
|---|---|---|---|---|---|---|
| Male | Female | Gap | Male | Female | Gap | |
| Years of Ed | 67.9 | 67.7 | −0.2 | 72.5 | 66.6 | −5.9 |
| Height | 58.7 | 58.1 | −0.5 | 58.6 | 59.9 | 1.3 |
| Total Cognition | 61.0 | 65.1 | 4.1 | 56.9 | 59.6 | 2.7 |
| Cog net of Ed | 54.5 | 58.1 | 3.6 | 51.0 | 54.6 | 3.6 |
The results are strongly consistent across the two studies. Rural-urban migration is highly selective on education—about equally so by gender in CHARLS, and somewhat more so for males in SAGE. Height is also selected on—migrants average about the 59th percentile of height. Cognitive ability is selected somewhere in between the levels of height and education. However, even the residual measure of cognitive ability after controlling for education is positively selected. Selection on cognition is stronger for females than males, thus explaining why rural-urban migrants have less female disadvantage than rural stayers. Overall, the selection on cognition net of education is at a level somewhat below that of height and education. Thus, it seems plausible that the advantage of rural-urban migrants we saw in Table 6 could be the result of selective migration alone, without any effect of adult urban residence.
In China, the contribution of migration to cognition and gender gaps in cognition appears to be relatively modest within the lives of migrants. It selects the more cognitively able but beyond that it is impossible to say whether it contributes to better (or worse) maintenance of abilities with aging. Those born in urban areas have better education, better cognition net of education, and smaller gender gaps than those born in rural areas, so migration should contribute to reducing gender gaps over several generations.
2. INDIA
2.1. Education and cognition in India compared with China
We begin our study of India with a comparison of the SAGE data for India with SAGE data for China. Figure 8 shows educational attainment by sex and birth cohort. The gender gap in education is much larger in India than in China. Males in India received nearly as much education as males in China. Progress for girls in India was very slow until the cohorts born in the 1950s and even for women born in the mid-1960s there is a large differential.
Figure 8.
Education by Sex and Year of Birth in India (SAGE), China (SAGE), and the US (HRS)
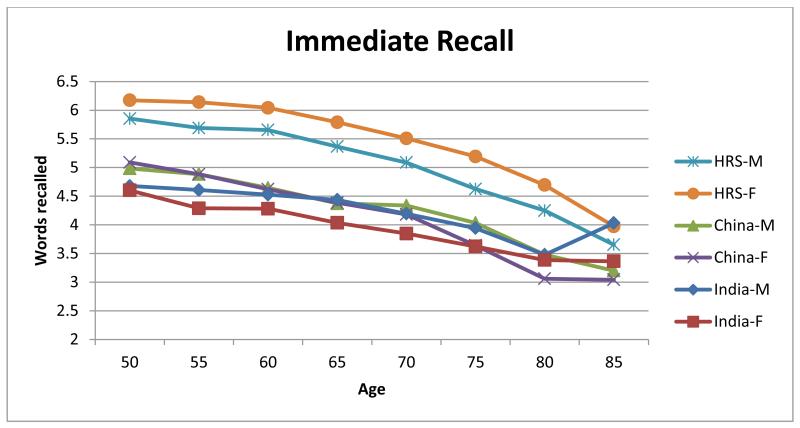
Consistent with the greater female disadvantage in human capital, the gender gaps in cognition are larger in India than in China. Figure 9 shows the SAGE first immediate recall score. Indian women have the lowest value, except for the relatively small samples at 80 and older.
Figure 9.
Immediate recall in China and India
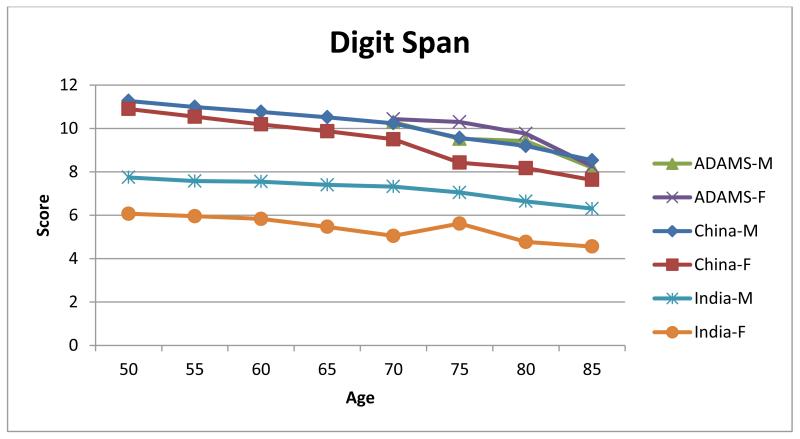
Figure 10 shows the digit span test results in India compared with China. The very large difference between scores for males in China and India casts some doubt on the reliability of this measure as a comparison. Further detailed examination of administration protocols in the two countries is probably warranted. The gender gap does appear to be larger in India than in China.
Figure 10.
Digit span in China and India
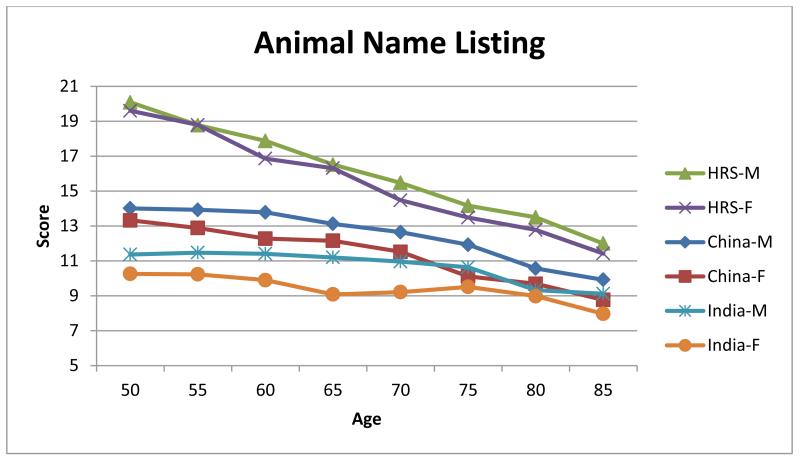
Finally, we compare the animal naming task in Figure 11. While less extreme, the same pattern is visible as in digit span. Younger age groups perform poorly relative to the Chinese sample, and there is relatively little decline in performance with age so that at advanced ages Indians are not very much below the Chinese in performance. The gender gap is only slightly larger in India than in China.
Figure 11.
Animal naming scores in China and India
2.2. Human capital from childhood and adult cognition
Gender gaps in education and cognition are larger in India than in China for all cohorts. Analogous to the model of Tables 1 and 2 for China, Tables 8 and 9 explore the role of inequality in education in gender gaps in cognition. The LASI pilot has some limitations. It failed to administer the serial 7s task correctly, skipping nearly half the population on the grounds that they “could not count”. It did ask these people two numeracy items, and of those who “could not count”, nearly one-third got both numeracy items right. In the LASI pilot, education had very limited explanatory power for cognitive variables, and did little to reduce gender gaps. For word recall, the gender gap is much larger than in China, and controlling for education reduces it by somewhat less than half, leaving a distinct female disadvantage in contrast to China where a female advantage emerged after controlling for education. For the LASI version of orientation, the female disadvantage is cut in half by controlling for education, whereas for the reduced sample who got the serial 7s task education had little impact on the gender gap.
Table 8.
Gender gaps controlling for age and education, LASI pilot
| Total recall | Serial 7s | Orientation | ||||
|---|---|---|---|---|---|---|
| Model 1 | Model 2 | Model 1 | Model 2 | Model 1 | Model 2 | |
| Age | 0.138 [0.126] |
0.088 [0.118] |
−0.144 [0.106] |
−0.223 [0.100]* |
0.058 [0.057] |
0.02 [0.046] |
| Age2/100 | −0.202 [0.095]* |
−0.15 [0.089] |
0.105 [0.083] |
0.169 [0.078]* |
−0.066 [0.043] |
−0.027 [0.035] |
| Female | −1.285 [0.220]*** |
−0.9 [0.211]*** |
−0.659 [0.143]*** |
−0.584 [0.141]*** |
−0.587 [0.097]*** |
−0.309 [0.079]*** |
| Years of Ed | 0.091 [0.059] |
0.097 [0.042]* |
0.323 [0.019]*** |
|||
| Years of Ed2/100 | 1.134 [0.451]* |
−0.166 [0.250] |
−1.201 [0.122]*** |
|||
| Constant | 8.293 [4.082]* |
8.341 [3.822]* |
8.658 [3.363]* |
10.49 [3.160]*** |
1.83 [1.834] |
1.677 [1.478] |
|
| ||||||
| r2 N |
0.137 1045 |
0.233 1044 |
0.048 538 |
0.096 537 |
0.07 1046 |
0.408 1045 |
Table 9.
Gender gaps controlling for age and education, SAGE-India
| Total recall | Digit Span | Animal naming | ||||
|---|---|---|---|---|---|---|
| Model 1 | Model 2 | Model 1 | Model 2 | Model 1 | Model 2 | |
| Age | −0.035 [0.066] |
−0.011 [0.068] |
0.039 [0.042] |
0.071 [0.034]* |
0.132 [0.072] |
0.159 [0.070]* |
| Age2/100 | −0.032 [0.049] |
−0.041 [0.051] |
−0.054 [0.032] |
−0.066 [0.026]** |
−0.135 [0.053]* |
−0.146 [0.051]** |
| Female | −0.534 [0.112]*** |
0.193 [0.116] |
−1.77 [0.078]*** |
−0.751 [0.084]*** |
−1.415 [0.138]*** |
−0.594 [0.138]*** |
| Years of Ed | 0.195 [0.032]*** |
0.332 [0.021]*** |
0.235 [0.041]*** |
|||
| Years of Ed2/100 | −0.157 [0.223] |
−0.73 [0.135]*** |
−0.317 [0.301] |
|||
| Constant | 12.505 [2.153]*** |
10.357 [2.215]*** |
7.181 [1.387]*** |
4.164 [1.124]*** |
8.337 [2.363]*** |
5.88 [2.319]* |
|
| ||||||
| r2 N |
0.059 6223 |
0.123 6223 |
0.179 6084 |
0.404 6084 |
0.053 6230 |
0.107 6230 |
Table 9 shows the three SAGE measures. Female disadvantage is higher in India than China before controlling for education, and while in contrast to the LASI pilot education substantially reduces female disadvantage in the SAGE-India data, the remaining gaps are larger than the comparable estimates for SAGE-China (or in the case of word recall, the female advantage net of education is smaller).
2.3. Migration, location, and cognitive differences
As in the analysis of the gender gap in cognition of Chinese adults, this section explores differences in female and male cognitive ability in urban and rural areas and among Indian migrants. It begins with a description of location and migration patterns in India, and then examines the gender gaps in education and cognitive ability among these groups.
As shown in Table 10, India is substantially less urban than China. While almost half of the older population in China lives in urban areas, slightly less than 30 percent of the older population in India lives in urban areas. SAGE-India shows very low rates of out-migration from rural to urban areas, and most of the urban residents were born in urban areas. The LASI pilot is not intended to be nationally representative but it shows considerably more rural to urban migration. As in China, SAGE finds a high rate of rural to rural migration for women. Overall, women are more likely to move than men.
Table 10.
Migration and Location in India, population 50+
| LASI-pilot | SAGE-India | |||||
|---|---|---|---|---|---|---|
| Male | Female | All | Male | Female | All | |
| %Urban born | 12.5% | 12.0% | 12.3% | 25.9% | 22.3% | 24.2% |
| % Urban resident Of rural-born |
25.4% | 28.7% | 27.0% | 27.5% | 29.3% | 28.4% |
| % rural migrant | 12.2% | 35.4% | 23.8% | 5.6% | 53.6% | 29.6% |
| % urban migrant | 14.7% | 19.0% | 16.8% | 2.1% | 9.0% | 5.5% |
In both the LASI and SAGE surveys, we identify migrants as individuals who do not currently live in the city, town, or village of their birth. This definition will likely classify short moves to nearby villages as migration. Thus the Indian population is substantially more rural than China and less prone to migrate from rural to urban areas. Table 11 sheds light on the gender gap in education and cognition net of education in rural and urban areas. Unlike China, both LASI and SAGE suggest a larger gender gap in education in urban areas than in rural areas: both urban females and urban males have higher levels of education than their rural counterparts, but the increase is relatively more for males. In LASI, the difference between the urban and rural gender gap in education increases when Kerala is excluded from the analysis.
Table 11.
Education and cognitive gaps in urban and rural areas
| LASI | SAGE | ||||||
|---|---|---|---|---|---|---|---|
| Male | Female | Gap | Male | Female | Gap | ||
| Rural | Rural | ||||||
| Education | 3.76 | 2.67 | −1.09 | Education | 4.98 | 1.03 | −3.94 |
| Recall | 0.37 | −0.71 | −1.08 | Recall | 0.00 | −0.08 | −0.07 |
| Serial 7s | Digits | 0.28 | −0.45 | −0.73 | |||
| Orientation | 0.14 | −0.31 | −0.45 | Animals | 0.12 | −0.39 | −0.52 |
| Urban | Urban | ||||||
| Education | 8.53 | 4.66 | −3.86 | Education | 7.67 | 3.21 | −4.46 |
| Recall | 0.62 | 0.19 | −0.42 | Recall | −0.25 | 0.45 | 0.70 |
| Serial 7s | Digits | 0.41 | −0.08 | −0.49 | |||
| Orientation | 0.16 | 0.22 | 0.07 | Animals | 0.57 | 0.08 | −0.49 |
As in China, the gender gap in cognitive ability net of education is smaller in urban than rural areas in India. SAGE-India suggests a female advantage in total recall in urban areas. In LASI, the gap in total recall remains among urban residents, but is less than half the size of the gap in total recall among rural residents. Female disadvantages in the digit and animals task remain in urban areas, but are smaller than in rural areas. The gender gap in orientation disappears in urban areas, where dates may be more relevant to daily life.
The uniformity of the tasks tested in SAGE-China and SAGE-India allows comparison of the size of the net gender gaps in cognition across the two countries. The female disadvantage in rural areas measured by recall and digit repetition is larger in SAGE-India than it is in SAGE-China, but smaller in Indian rural areas when measured by the animal naming task. As noted above, however, the large difference between Indian males and Chinese males registered in the digit task leaves some question as to whether the task was administered differently in the two countries. In urban areas, the female disadvantage in cognition is larger in India than China according to both the digit and animal naming tasks.
In India, there is very little evidence that the process of development – whether it is selection into migration based on cognitive ability or improvement in cognitive ability due to urban or social environmental factors – has contributed toward a decrease in the gender gap in cognition at older ages. Migration is more common between rural areas than it is from rural to urban areas. Rural-rural migration, may be less effective in equalizing cognitive ability across genders than rural-urban migration. Further, while urban areas may offer improved educational opportunities, in these older cohorts it is primarily males who were able to exploit them. Thus, even if rural-urban migration were to increase, it is not clear that without other changes educational opportunities or cognitive exposures in urban areas would substantially reduce the gender inequality in cognitive ability.
Conclusions
Bringing the technology of modern longitudinal studies of aging to the developing world, and in particular to the very large and important populations of China and India, is a tremendous accomplishment. We have focused on a particular aspect of this transfer, the measurement of cognition. Cognitive ability shapes the lives of aging populations, and constrains the application of policy. Its measurement is sensitive to details of administration, and we found some areas for concern regarding comparability across these studies. The SAGE studies are not well harmonized on cognition measurement with the HRS studies, even for tests of short-term memory where the goals of measurement are identical. This hampers joint analysis, although high-level findings, like the importance of education, are similar across studies. The results for SAGE-India contrast with SAGE-China to a degree that suggests attention is needed to comparability of administration. The LASI pilot study extended cognition measurement into the area of numeracy, which we applaud as measures of numeric ability consistently show the strongest correlation with economic success in the HRS studies in the developed world. Finally, the LASI pilot differed greatly from the other studies here in the extent of female disadvantage in the measure of short-term memory. Whether this is an artifact of the small sample or test administration, or an indicator of a real difference remains to be determined.
This paper describes the gender gap in cognitive abilities among older adults in India and China using two cross-sectional studies in each country. As with any cross-sectional study, the possibility of selective mortality by cognitive function and gender prevents us from drawing firm conclusions about how this gender gap develops over time. A sizeable literature suggests that men and women who live longer tend to have higher early-life intelligence (Calvin, 2011) or exhibit certain personality traits, such as conscientiousness (Deary et al, 2010). This relationship does not appear to differ across genders (Batty et al., 2007). Gottfredson and Deary (2004) propose one channel through which early-life intelligence may influence mortality: people with higher intelligence and conscientiousness are able to take care for themselves more effectively through older ages.
What does this relationship between intelligence, personality, and mortality imply for our study? Women who survive through childhood, on average, live longer than men (in India: Subramanian et al., 2006). As both early-life intelligence and conscientiousness may influence later-life cognition, a shorter average lifetime of men would lead to an overestimate of male cognition relative to female cognition among the middle-aged. Selective mortality could also bias upward our estimate of the gender gap in education at each age: people with higher intelligence at an early age are more likely to achieve higher levels of education. Thus, the average education level of males of a given age may be biased upward compared to the average level of females at that age.
With a few caveats and concerns aside, the evidence reviewed here shows clearly how the current status of today’s older populations in China and India bear the marks of their histories of development. Cohorts in which educational attainment was low perform relatively poorly on cognitive tasks, and lower education for females 50-80 years ago is visible in their relative performance today on cognitive tasks. Although education is obviously of first-order importance, it does not entirely account for gender gaps in all the measures in all the studies. Other inputs to child quality, some of which are reflected in adult height, may also be important. Urban development and migration – two factors that one might expect to impact cognitive function through environmental or social forces – seem to play different roles in the two countries. In China, gender gaps in cognition are substantially smaller among migrants and urban dwellers, suggesting that these roads to development may serve to equalize the cognitive playing field in that country. Such effects are virtually absent in India; despite significant urbanization and migration (albeit less than in China) the gender gaps in cognitive ability in India vary little across migrant groups. This suggests that, perhaps, older Indians with superior net-of-education skills were not able to select into migration, nor were they able to exploit substantially different cognitive environments through migration and urbanization. Identifying unique patterns across countries in the relationship between economic development and cognitive ability is a worthy task that the extension of longitudinal aging studies to the developing world has made possible.
Longitudinal follow-up of these studies will help address some of the unanswerable questions from cross-section analysis. For example, we will be able to observe whether the pace of cognitive decline is different in urban compared with rural areas, as the cognitive stimulation hypothesis would suggest, or whether the observed differences in cognitive ability are just a consequence of the selectivity of migration.
ACKOWLEDGMENTS
The HRS (Health and Retirement Study) is sponsored by the National Institute on Aging (grant number NIA U01AG009740).
Bibliography
- Ball K, et al. Advanced Cognitive Training for Independent and Vital Elderly Study Group Effects of cognitive training interventions with older adults: A randomized controlled trial. JAMA. 2002;288:2271–2281. doi: 10.1001/jama.288.18.2271. (2002) [DOI] [PMC free article] [PubMed] [Google Scholar]
- Batty GD, Deary IJ, Gottfredson LS. Premorbid (Early Life) IQ and Later Mortality Risk: Systematic Review. Annals of Epidemiology. 2007;17:278–288. doi: 10.1016/j.annepidem.2006.07.010. [DOI] [PubMed] [Google Scholar]
- Brandt J, Spencer M, Folstein M. The telephone interview for cognitive status. Neuropsychiatry, Neuropsychology, and Behavioral Neurology. 1988;1:111–117. [Google Scholar]
- Cagney, Kathleen A, Lauderdale, Diane S. Education, Wealth, and Cognitive Function in Later Life. The Journals of Gerontology: Psychological Sciences. 57B:2. doi: 10.1093/geronb/57.2.p163. [DOI] [PubMed] [Google Scholar]
- Calvin CM, et al. Intelligence in youth and all-cause-mortality: Systematic reviewwith meta-analysis. Intl J Epidemiol. 2011;40:626–644. doi: 10.1093/ije/dyq190. [DOI] [PMC free article] [PubMed] [Google Scholar]
- Case Anne, Paxson Christina. Height, Health, and Cognitive Function at Older Ages. The American Economic Review. 2008 May;98(2):463–467. doi: 10.1257/aer.98.2.463. [DOI] [PMC free article] [PubMed] [Google Scholar]
- Deary IJ, Weiss A, Batty GD. Intelligence and personality as predictors of illness and death. Psychol Sci Public Interest. 2010;11:53–79. doi: 10.1177/1529100610387081. [DOI] [PubMed] [Google Scholar]
- Engelhardt H, Buber I, Skirbekk V, Prskawetz A. Social involvement, behavioural risks and cognitive functioning among older people. Ageing Soc. 2010;30:779–809. [Google Scholar]
- Erickson KI, et al. Exercise training increases size of hippocampus and improves memory. Proc Natl Acad Sci USA. 2011;108:3017–3022. doi: 10.1073/pnas.1015950108. [DOI] [PMC free article] [PubMed] [Google Scholar]
- Ertel K, Glymour M, Berkman L. Effects of social integration on preserving memory function in a national representative U.S. elderly population. Am J Public Health. 2008;98(7):1215–1220. doi: 10.2105/AJPH.2007.113654. [DOI] [PMC free article] [PubMed] [Google Scholar]
- Folstein M, Folstein S, McHugh P. ‘Mini-mental state.’ A practical method for grading the cognitive state of patients for the clinician. J Psychiatr Res. 1975;12(3):189–198. doi: 10.1016/0022-3956(75)90026-6. [DOI] [PubMed] [Google Scholar]
- Gottfredson LS, Deary IJ. Intelligence predicts health and longevity, but why? Curr Dir Psychol Sci. 2004;13:1–5. [Google Scholar]
- Huang, Zhou Effects of Education on Cognition at Older Ages: Evidence from China’s Great Famine. Social Science & Medicine. 2013 doi: 10.1016/j.socscimed.2013.08.021. (2013), doi: 10.1016/j.socscimed.2013.08.021. [DOI] [PubMed] [Google Scholar]
- Kowal P, S.-M. C, Collaborators. S. Data resource profile: the World Health Organization Study on global AGEing andadult health (SAGE) Int. J. Epidemiol. 2012;41(6):1639–1649. doi: 10.1093/ije/dys210. [DOI] [PMC free article] [PubMed] [Google Scholar]
- Lee Jinkook, Shih Regina A., Feeney Kevin Carter, Langa Kenneth M. Cognitive Health of Older Indians: Individual and Geographic Determinants of Female Disadvantage. RAND Working Paper WR-889. 2011 Oct; [Google Scholar]
- Lei Xiaoyan, Yuqing Hu, McArdle John J., Smith James P., Zhao Yaohui. Gender differences in cognition among older adults in China. Journal of Human Resources. 2012;47(4):951–971. doi: 10.3368/jhr.47.4.951. [DOI] [PMC free article] [PubMed] [Google Scholar]
- Maurer Jürgen. Height, education and later-life cognition in Latin America and the Caribbean. Economics & Human Biology. 2010;8(2):168–176. doi: 10.1016/j.ehb.2010.05.013. [DOI] [PubMed] [Google Scholar]
- Skirbekk V, Loichinger E, Weber D. Variation in cognitive functioning as a refined approach to comparing aging across countries. Proc Natl Acad Sci. 2012;109(3):770–774. doi: 10.1073/pnas.1112173109. [DOI] [PMC free article] [PubMed] [Google Scholar]
- Spitz-Oener A. Technical change, job tasks, and rising educational demands: Looking outside the wage structure. J Labor Econ. 2006;24:235–270. [Google Scholar]
- Subramanian SV, et al. The mortality divide in India: The differential contributions of gender, caste, and standard of living across the life course. Am J Public Health. 2006;96:818–825. doi: 10.2105/AJPH.2004.060103. [DOI] [PMC free article] [PubMed] [Google Scholar]
- Tucker A, Stern Y. Cognitive reserveinaging. Curr Alzheimer Res. 2011;8(4):354–360. doi: 10.2174/156720511795745320. [DOI] [PMC free article] [PubMed] [Google Scholar]
- Valenzuela Michael J., Sachdev Perminder. Brain reserve and dementia: a systematic review. Psychological medicine. 2006;36(04):441–454. doi: 10.1017/S0033291705006264. [DOI] [PubMed] [Google Scholar]


