

Abstract
Articular cartilage and subchondral bone are the key tissues in osteoarthritis (OA). The role of the cancellous bone increasingly attracts attention in OA research. Because of its fast adaptation to changes in the loading distribution across joints, its quantification is expected to improve the diagnosis and monitoring of OA. In this study, we simulated OA progression-related changes of trabecular structure in a series of digital bone models and then characterized the potential of texture parameters and bone mineral density (BMD) as surrogate measures to quantify trabecular bone structure. Five texture parameters were studied: entropy, global and local inhomogeneity, anisotropy and variogram slope. Their dependence on OA relevant structural changes was investigated for three spatial resolutions typically used in micro computed tomography (CT; 10 μm), high-resolution peripheral quantitative CT (HR-pQCT) (90 μm) and clinical whole-body CT equipment (250 μm). At all resolutions, OA-related changes in trabecular bone architecture can be quantified using a specific (resolution dependent) combination of three texture parameters. BMD alone is inadequate for this purpose but if available reduces the required texture parameter combination to anisotropy and global inhomogeneity. The results are summarized in a comprehensive analysis guide for the detection of structural changes in OA knees. In conclusion, texture parameters can be used to characterize trabecular bone architecture even at spatial resolutions below the dimensions of a single trabecula and are essential for a detailed classification of relevant OA changes that cannot be achieved with a measurement of BMD alone.
Introduction
Osteoarthritis (OA) is a whole-organ disease characterized by cartilage degeneration, osteophyte formation, sclerosis and other structural degenerations of subchondral cancellous bone. Articular cartilage deterioration is historically regarded as the primary cause of OA. However, there is ongoing debate whether changes in subchondral bone architecture may also have an important role in particular during the initial phases of the disease. Animal models suggest that changes in the subchondral bone structure can happen at a very early disease stage.1 OA-driven changes in the loading patterns across joints lead to an increased rate of bone remodeling.2 This causes modifications in the architecture of the fine trabecular network3,4,5 and, probably as a consequence, in bone mineral density (BMD).6
Although dedicated research magnetic resonance imaging (MRI) sequences exist to measure trabecular architecture in the apendicular skeleton, BMD cannot be quantified with MRI. Also, the sequences used for the assessment of the trabecular bone structure are not widely available. Another problematic feature of MRI is the long scan time. Thus, quantitative CT (QCT) may be a complementary imaging procedure. BMD can easily be quantified and scan times are short; a complete knee can be imaged within seconds. QCT is an x-ray-based method, but in the apendicular skeleton radiation exposure is low.
State-of-the-art clinical whole-body CT scanners provide an isotropic spatial resolution of up to 250 μm. Nevertheless, individual trabeculae with an average diameter between 100 μm and 200 μm7,8,9 still cannot be resolved adequately. Binarization of the CT images prior to the quantification of bone structure is one approach often applied in the literature,10,11,12 but it requires a binary decision rule on what is bone and what is soft tissue. An alternative method is the calculation of texture parameters directly from the gray value distribution of the CT data set avoiding the process of binarization. Obviously, with respect to the quantification of trabecular structure, texture parameters, as well as BMD, are surrogate measurements, and the question arises how well-measured changes in these surrogate parameters represent true changes in the subchondral trabecular architecture under OA progression.
It is the aim of the present work to identify texture parameters that can be measured in CT images and to determine to which extent they accurately quantify changes of subchondral trabecular architecture under OA progression. For this purpose, modifications of the trabecular bone architecture and mineralization, which are known to occur in OA, were simulated using a digital bone model introduced recently to simulate effects of bone architecture variations on texture and BMD at spatial resolutions of CT, HR-pQCT and microCT scanners.13
Results
Differentiation of bone model series
If all five texture parameters were used in the multivariate discriminant analysis, the hit ratios for model series separation were 99.4%, 100% and 96.7% for voxel sizes of 10 μm, 90 μm and 250 μm, respectively. Very high hit ratios were also achieved with the following parameter combinations: global inhomogeneity, anisotropy and local inhomogeneity at 10 μm (100%); variogram slope, local inhomogeneity and entropy at 90 μm (98.6%); and local inhomogeneity, anisotropy and entropy at 250 μm (97.8%).
If only BMDup1 and BMDup2 were considered, anisotropy, local inhomogeneity and variogram slope as single independent variables each showed hit ratios of 100% at 10 μm. At 90 μm, local inhomogeneity alone still showed a hit ratio of 94.4%, which was increased to 100% if any of the four other texture parameters was added. At 250 μm, anisotropy alone showed a hit ratio of 94.4%, which was increased to 100% if any other texture parameter, except entropy was added.
Differentiation of trabecular bone structure independent of bone model series
Table 1 shows the coefficients of determination (R2) of BMD and texture parameters, either alone or in combinations with parameters rod diameter, rod number and plate thickness used to define the trabecular structure. Variations in rod number and plate thickness could be assessed relatively well by anisotropy and variation of rod diameter by global inhomogeneity. However, with a few exceptions, R2-values with individual texture parameters were low to moderate. In contrast, the combination of all texture parameters achieved R2-values >0.85. BMD also predicted structural parameter changes only moderately (R2<0.57). The addition of BMD to the combination of texture parameters has little extra effect.
Table 1. R 2 values from linear regression.
| Voxel size |
10 μm |
90 μm |
250 μm |
||||||
|---|---|---|---|---|---|---|---|---|---|
| Rod diameter | Rod number | Plate thickness | Rod diameter | Rod number | Plate thickness | Rod diameter | Rod number | Plate thickness | |
| BMD | 0.57 | 0.31 | 0.18 | 0.57 | 0.35 | 0.20 | 0.57 | 0.31 | 0.18 |
| Entropy | 0.12 | 0.04 | 0.09 | 0.47 | 0.07 | 0.57 | 0.63 | 0.01 | 0.05 |
| Global inhomogeneity | 0.35 | 0.30 | 0.10 | 0.43 | 0.31 | 0.12 | 0.37 | 0.48 | 0.20 |
| Local inhomogeneity | <0.01 | 0.01 | 0.14 | <0.01 | 0.42 | 0.07 | 0.33 | 0.16 | 0.03 |
| Anisotropy | <0.01 | 0.79 | 0.34 | 0.91 | 0.26 | 0.40 | 0.07 | 0.93 | 0.43 |
| Variogram Slope | <0.01 | <0.01 | 0.11 | 0.14 | 0.46 | 0.15 | 0.36 | 0.60 | 0.28 |
| All texture parameters | 0.98 | 0.99 | 0.88 | 0.99 | 0.86 | 0.96 | 0.94 | 0.99 | 0.85 |
| BMD + all texture parameters | 0.98 | 1.00 | 0.88 | 0.99 | 0.93 | 0.98 | 0.95 | 0.99 | 0.85 |
Abbreviation: BMD, bone mineral density.
Independent variables (left column) are BMD and single texture parameters (univariate), as well as combinations (multivariate). Group variables (second row) are structure parameters.
Dependence of texture on OA progression
In the following, ‘OA progression' describes the modification of the trabecular structure from early- to end-stage disease. This disease progression was simulated by the transitions from model 1 to model 10 in each of the four series defined in Tables 2, 3, 4, 5.
Table 2. Trabecular bone models simulating OA progress from model 1 (= basic model) to model 10 (BMDconst).
| Model | 1 | 2 | 3 | 4 | 5 | 6 | 7 | 8 | 9 | 10 |
|---|---|---|---|---|---|---|---|---|---|---|
| Rod diameter (μm) | 200 | 220 | 240 | 260 | 280 | 300 | 320 | 340 | 360 | 380 |
| Rod number | 11 × 11 | |||||||||
| Plate thickness (μm) | 200 | 220 | 230 | 240 | 250 | 260 | 280 | 290 | 300 | 310 |
| BV/TV (%) | 20 | 22 | 24 | 26 | 28 | 30 | 32 | 34 | 36 | 38 |
| Mineralization (HU) | 800 | 718 | 673 | 628 | 590 | 533 | 508 | 481 | 456 | 431 |
Abbreviations: BMD, bone mineral density; BV/TV, bone volume/total volume; OA, osteoarthritis.
Table 3. Trabecular bone models simulating OA progress with increasing BMD (decreasing rod number, BMDup1).
| Model | 1 | 2 | 3 | 4 | 5 | 6 | 7 | 8 | 9 | 10 |
|---|---|---|---|---|---|---|---|---|---|---|
| Rod diameter (μm) | 200 | 220 | 240 | 260 | 280 | 300 | 320 | 340 | 360 | 380 |
| Rod number | 11 × 11 | 10 × 10 | 9 × 9 | 8 × 8 | 7 × 7 | 6 × 6 | 5 × 5 | 4 × 4 | 3 × 3 | 2 × 2 |
| Plate thickness (μm) | 200 | 220 | 240 | 260 | 280 | 300 | 320 | 340 | 360 | 380 |
| BV/TV (%) | 20 | 22 | 24 | 26 | 28 | 30 | 32 | 34 | 36 | 38 |
| Mineralization (HU) | 800 | |||||||||
Abbreviations: BMD, bone mineral density; BV/TV, bone volume/total volume; OA, osteoarthritis.
Table 4. Trabecular bone models simulating OA progress with increasing BMD (constant rod number, BMDup2).
| Model | 1 | 2 | 3 | 4 | 5 | 6 | 7 | 8 | 9 | 10 |
|---|---|---|---|---|---|---|---|---|---|---|
| Rod diameter (μm) | 200 | 220 | 240 | 260 | 280 | 300 | 320 | 340 | 360 | 380 |
| Rod number | 11 × 11 | |||||||||
| Plate thickness (μm) | 200 | |||||||||
| BV/TV (%) | 20 | 22 | 24 | 26 | 28 | 30 | 32 | 34 | 36 | 38 |
| Mineralization (HU) | 800 | |||||||||
Abbreviations: BMD, bone mineral density; BV/TV, bone volume/total volume; OA, osteoarthritis.
Table 5. Trabecular bone models simulating OA progress with decreasing BMD (BMDdown).
| Model | 1 | 2 | 3 | 4 | 5 | 6 | 7 | 8 | 9 | 10 |
|---|---|---|---|---|---|---|---|---|---|---|
| Rod diameter (μm) | 200 | |||||||||
| Rod number | 11 × 11 | |||||||||
| Plate thickness (μm) | 200 | |||||||||
| BV/TV (%) | 20 | |||||||||
| Mineralization (HU) | 800 | 721 | 680 | 638 | 602 | 568 | 525 | 499 | 475 | 452 |
Abbreviations: BMD, bone mineral density; BV/TV, bone volume/total volume; OA, osteoarthritis.
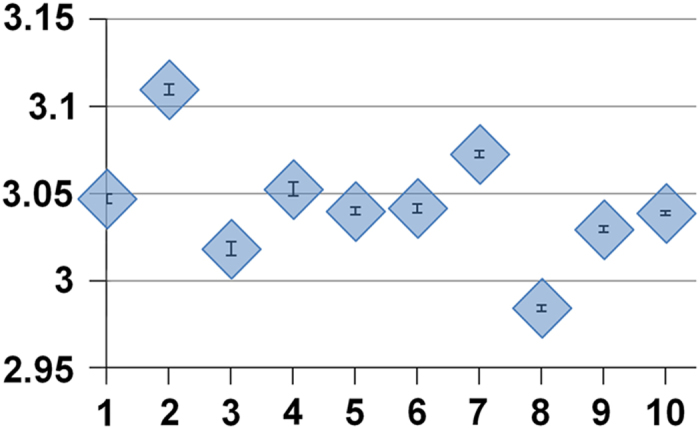
Figures 1, 2, 3, 4 show the results obtained in the different simulated models for voxel sizes of 10, 90 and 250 μm, respectively, when both the texture parameters and BMD were taken into account. In each diagram, the model number of the respective series is plotted on the x axis. Thus, OA progression proceeds from left to right. The illustrated data points are mean values of 10 measurements each, using random noise with a s.d. of 30 HU. The error bars represent the s.d. of the 10 measurements. However, with the exception of entropy, they were too small to be visible in the diagrams.
Figure 1.

Series BMDconst: Dependence of analysis parameters on OA structural changes for voxel sizes 10, 90 and 250 μm. x axis: OA model number; y axis: mean values from 10 simulations with noise level 30 HU; error bars are s.d. Except for entropy, error bars are too small to be visible in the diagrams. Percentage changes between values at model 1 and model 10 are given as Δ. Abbreviation: BMD, bone mineral density.
Figure 2.

Series BMDup1 (decreasing rod number): Dependence of analysis parameters on OA structural changes for voxel sizes 10, 90 and 250 μm. x axis: OA model number; y axis: mean values from 10 simulations with noise level 30 HU; Percentage changes between values at model 1 and model 10 are given as Δ. Abbreviation: BMD, bone mineral density.
Figure 3.

Series BMDup2 (constant rod number): Dependence of analysis parameters on OA structural changes for voxel sizes 10, 90 and 250 μm. x axis: OA model number; y axis: mean values from 10 simulations with noise level 30 HU; Percentage changes between values at model 1 and model 10 are given as Δ. Abbreviation: BMD, bone mineral density.
Figure 4.

Series BMDdown: Dependence of analysis parameters on OA structural changes for voxel sizes 10, 90 and 250 μm. x axis: OA model number; y axis: mean values from 10 simulations with noise level 30 HU; Percentage changes between values at model 1 and model 10 are given as Δ. Abbreviation: BMD, bone mineral density.
The analysis of variances (ANOVAs) carried out for each diagram in the four figures showed significant differences among all models of a given series and all voxel sizes for all texture parameters with the exception of entropy at 250 μm and of course for BMD in series BMDconst. The Tukey's HSD (honestly significant difference) tests confirmed that differences in texture or BMD between any two models were significant in all diagrams with the two exceptions listed above. This means that measures are different, but to select the parameter that described OA progression best, a multiple linear regression with forward selection was carried out for each model series.
In series BMDconst (Figure 1) all texture parameters, with the exception of anisotropy, were increasing or decreasing monotonically at all voxel sizes. Furthermore, their ‘curve shapes' were qualitatively constant among voxel sizes. The multiple linear regression analysis showed that global inhomogeneity best predicted OA structural changes at voxel sizes of 10 and 250 μm. At 90 μm, variogram slope performed slightly better compared with the other parameters. At all voxel sizes, just one texture parameter suffices to measure the structural variation. However, as obvious in Figure 1, all texture parameters showed nearly the same prediction. As expected, BMD was not able to predict OA progression in this model series.
Series BMDup1 (Figure 2) was constructed with increasing BMD and decreasing rod number. At 10 μm, all parameters were increasing or decreasing monotonically. Global inhomogeneity was the only parameter with qualitatively constant curve shapes throughout all voxel sizes. For entropy, structure-dependent changes were irregular at higher voxel sizes. For local inhomogeneity, anisotropy and variogram slope, the sign of the gradients changed between 10 and 250 μm. Comparing 10 and 250 μm voxel sizes, a decrease/increase in local inhomogeneity was accompanied by an increase/decrease in anisotropy and a decrease/increase in variogram slope. Of course, BMD could also be used to predict OA progression in this model series.
Series BMDup2 (Figure 3) was built with increasing BMD and constant rod number. At 10 μm, the curves for global inhomogeneity and entropy were almost identical to the corresponding curves in series BMDup1. In contrast, the slopes for local inhomogeneity, anisotropy and variogram slope had different signs at BMDup1 and BMDup2. At 90 μm, global inhomogeneity and anisotropy showed almost identical curves at BMDup1 and BMDup2, respectively. The other parameters did not show linear behavior at either model serie. At 250 μm, the curves for global inhomogeneity and variogram slope were qualitatively equal for BMDup1 and BMDup2. Again, global inhomogeneity showed qualitatively constant curve shapes at all voxel sizes with only slightly different slopes. BMD could also be used to predict OA progression in series BMDup2.
Series BMDdown (Figure 4) was built with decreasing BMD. Again, entropy was very sensitive to noise, especially at 250 μm, and different structures could not be distinguished, as confirmed by Tukey's HSD test. All other parameters showed qualitatively equal behavior among different voxel sizes.
Diagnostic power: impact of noise on the quantification of OA progression
Table 6 compares texture parameter changes caused by image noise with the changes of the same texture parameter caused by OA progression. Specifically, the numbers in the table show which change in image noise results in the same change in a texture parameter as structural differences between models 1 and 2, models 1 and 6 and models 1 and 10. Global inhomogeneity was only marginally affected by noise, whereas entropy and local inhomogeneity were very sensitive to noise. Results for anisotropy and variogram slope were in between. The results for diagnostic power according to equation 1 are also presented in Table 6. Global inhomogeneity clearly exceeded the performance of other texture parameters. Entropy showed the lowest diagnostic power.
Table 6. Noise sensitivity of texture parameters.
| Entropy | Global inhomogeneity | Local inhomogeneity | Anisotropy | Variogram slope | |
|---|---|---|---|---|---|
| Δ noise (10 μm) | 14 (10) [3.7] | 4343 (3179) [1576] | 3.3 (2.1) [0.7] | 70 (72) [17] | 293 (183) [65] |
| Δ noise (90 μm) | 17 (14) [6.5] | 212 (138) [76] | 27 (20) [7.5] | 30 (19) [7.2] | 130 (72) [21] |
| Δ noise (250 μm) | 15 (11) [3.5] | 129 (91) [33] | 27 (15) [4.3] | 29 (19) [1.9] | 67 (40) [7.1] |
| Power (10 μm) | 9.7 (4.5) [0.5] | 247390 (97251) [11 955] | 9.1 (3.6) [0.4] | 6.5 (7.1) [0.2] | 525 (205) [26] |
| Power (90 μm) | 9.9 (5.3) [0.8] | 7144 (2196) [442] | 374 (200) [30] | 155 (57) [7.8] | 1092 (336) [29] |
| Power (250 μm) | 3.9 (1.8) [0.1] | 4388 (1698) [127] | 313 (76) [5.6] | 74 (30) [0.3] | 413 (150) [4.6] |
The numbers show changes in image noise (in HU) that would result in identical changes of texture parameters as the structure variations between model 1 and model 10 (no brackets), between model 1 and model 6 (round brackets) and between model 1 and model 2 [square brackets] in series BMDconst at voxel sizes of 10, 90 and 250 μm. The original noise level was 30 HU. The last three rows show the corresponding diagnostic power of the texture parameters.
Discussion
As the trabecular network quickly adapts to alterations in joint loading, the quantification of trabecular subchondral bone structure may have a great impact on the diagnosis and monitoring of OA. Increasing efforts have been made to develop imaging biomarkers on the basis of conventional radiography5,14,15,16,17,18 and MRI19,20,21,22,23,24 to quantify subchondral bone architecture changes in vivo and microCT has often been used to assess trabecular structure in bone specimen.25,26,27,28 However, to the best of our knowledge, only one study used CT to investigate the structure of subchondral trabecular bone in vivo in human OA hips.29 The authors found significant correlations between bone structure and joint space parameters.
The use of texture parameters derived in CT images is challenging and therefore requires a thorough and systematic validation step. This has often been neglected. A digital bone model, such as the one used in the present work, is an essential tool to understand the response of texture parameters to changes in bone architecture during OA progression. This is also a promising approach for the investigation of trabecular bone changes in osteoporosis where recently also the resolution dependence of analysis parameters has been investigated.30,31 A literature search on the use of digital bone models for the validation of trabecular structure measurement resulted in two studies. In a study by Engelke et al.,32 a digital trabecular bone model was extracted from microCT data and used for the validation of histomorphometric parameters at various spatial resolutions. Krebs et al.33 constructed a digital trabecular bone model from rods and plates to evaluate the accuracy of HR-pQCT in measuring trabecular distances in vertebrae.
In the present work, four model series with different BMD gradients (BMDconst, BMDup1, BMDup2 and BMDdown) were examined. Together, they cover the large variation of bone structure modifications reported during OA progression. These models were used to investigate which surrogate parameters could be measured to assess changes in trabecular bone structure and mineralization during OA progression. On the basis of our results, we suggest a two-tiered approach to use BMD together with bone texture: at the first level, the type of structure modification causing OA progression is identified. At the second level, the OA progression is quantified in terms of structural modifications. In other words, at level 1 the model series is identified and at level 2 the 10 models within the selected series are differentiated. Selection of the best parameter(s) to measure was carried out for two scenarios: BMD and bone texture parameters used together (S1) or texture parameters used alone (S2) (Figure 5).
Figure 5.

Summary of statistical analysis steps to demonstrate abilities and limitations of BMD and texture parameters as surrogate measures for trabecular bone structure: at level 1, the type of structure modification (series) causing OA progression is identified. At level 2, the OA progression (model number in series) is quantified in terms of structural modifications. Abbreviation: BMD, bone mineral density.
BMD is a good starting point as it can be measured easily and with good precision with low radiation QCT.34 Obviously, longitudinal BMD measurements alone enable identification of the model series (level 1) but do not allow further discrimination of BMDup1 and BMDup2 (Figure 5). In addition, in series BMDconst, OA progression cannot be quantified by BMD (level 2). Thus, structural changes in OA progression cannot be identified by an isolated BMD measurement, except in the scenario of series BMDdown, where mineralization decreases with OA progression, whereas structure remains constant. In this case, the pair-wise separation of two models is not improved by adding information about the other texture parameters. However, if BMD increases or remains constant, additional measurements such as texture parameters are required if information on structural changes is desired. The results in Table 1 confirm that BMD alone is not an appropriate measurement to differentiate changes among bone structure parameters.
If BMD is available (S1), then the following analysis strategy will succeed: BMD plus anisotropy can be used to uniquely identify the model series (level 1). Then, quantification of structural modifications (level 2) can be performed using global inhomogeneity for series BMDconst (Figure 1), BMDup1 (Figure 2) and BMDup2 (Figure 3) or using BMD for series BMDdown (Figure 4).
If BMD cannot be derived (S2)––for example, because of the lack of calibration data––the analysis strategy becomes more difficult, in particular because it depends on spatial resolution. As shown in the result section, at 10 μm the combination of anisotropy and global and local inhomogeneity is necessary to identify the model series. At 90 μm, a combination of variogram slope, local inhomogeneity and entropy is the best, whereas at 250 μm, local inhomogeneity, anisotropy and entropy should be selected. Then, at level 2, global inhomogeneity is adequate in all cases to quantify structural modifications (Figure 5).
An important result from the present study is that BMD as well as any bone texture parameter used in isolation is inadequate to quantify structural changes with OA progression, whereas a combination of texture parameters without BMD is efficient for this purpose. This is confirmed in Table 1 reflecting the results of the multiple linear regression analysis for the differentiation of the trabecular bone structure independent of the association with a model series. Here results of all 40 models were included in one statistical analysis. Nevertheless, including a BMD measurement is advisable, despite the power of the texture parameters, in particular at lower spatial resolutions––that is, when using clinical whole-body CT scanners. Then, S1 in Figure 5 is the recommended analysis strategy.
As seen from Figure 5, global inhomogeneity is the most important texture parameter for the analysis of OA-related structural changes. Its low noise sensitivity was exemplified for series BMDconst in Table 6. Moreover, global inhomogeneity is the only texture parameter showing linear behavior in all model series, independent of spatial resolution, and is characterized by high percentage changes across models, which varied only slightly with spatial resolution.
The present study has limitations. One is the categorization into four different model series representing trabecular architecture changes associated with OA progression. It can be expected that in true OA progression additional irregular architectural changes appear, which could result in different responses of texture parameters. Also, mixture variations from the four model series will appear. Consequently, the analysis approach illustrated in Figure 5 has to be treated with caution and is not intended to be directly used in the treatment of knee OA patients. Nevertheless, the changes applied to the basic trabecular bone model in the present work are manifold and nicely match reported OA-related bone structure changes. Structural changes within a model series may also be smaller compared with simulated in the ten models, but determination of least significant changes was not the aim of this study.
A third limitation appears to be the limited number of texture parameters used in the analysis. Indeed, several other parameters characterizing structure can be found in the literature. For example, fractal parameters have been used to characterize trabecular structure on 2-D radiographs5,18,35,36 but have rarely been applied to three-dimensional CT data sets.37,38,39 The five texture parameters used in this study are easy to calculate, and their use in isolation or in combination with BMD was able to distinguish the model type and to quantify the change in the trabecular bone structure. Thus, we see no need for adding additional parameters unless a single new one was able to replace several of the parameters used in this study. We also did not evaluate the potential of direct structural measurements to quantify OA progression. For example, recently advanced imaging processing methods have been reported to quantify trabecular number accurately in in vivo images of the spine.33
In conclusion, the extensive simulations show that a combination of texture parameters is able to quantify OA-related structural changes in the human trabecular bone network of the knee, even at spatial resolutions achievable with clinical CT equipment. Even if BMD can be obtained, additional texture measurements are essential to fully characterize changes in the trabecular bone structure, whereas BMD as a single analysis parameter is not able to fulfill this task.
Materials and Methods
Trabecular bone model
The basic digital bone model used to simulate OA-related architectural changes of the trabecular bone network is shown in Figure 6. This model was constructed as a combination of plates and rods representing an average human trabecular bone structure. It consisted of 11 × 11 cylindrical rods with a diameter of 200 μm and a spacing of 700 μm. The rods were equidistantly interleaved by nine parallel plates with a thickness of 200 μm and a spacing of 1000 μm, which were arranged perpendicular to the rods. This construction resulted in a bone volume/total volume (BV/TV) of 20%. The CT values for bone and soft tissue/fat were 800 and −50 HU, respectively. The half cylinders were included to provide a more general bone model by partially breaking its symmetry. A more detailed description of the digital model can be found in an earlier publication.13 Image acquisitions were simulated by resampling the structure, resulting in voxel sizes of 10, 90 and 250 μm, respectively, matching typical voxel sizes of microCT, HR-pQCT and whole-body clinical CT scanners. Gaussian noise with a s.d. of 30 HU was added to the final data. This noise magnitude nicely matches values found in in vivo CT data sets with medium reconstruction kernels.40 Furthermore, different spatial resolutions and noise levels investigated in the present work simulate the effect of different reconstruction kernels.
Figure 6.

Basic trabecular bone model.
OA progression modifies trabecular bone structure in several ways, but published studies on this subject were often inconsistent, which was partly caused by discrepancies in experimental conditions such as differences in disease stage and heterogeneity of OA models. For example, it is unclear whether in OA BMD increases,41 decreases42 or does not change at all.43 There is evidence that BV/TV considerably increases along with hypomineralization of trabeculae,44,45 and most studies also reported an increase in trabecular thickness.46,47 In contrast, reported findings concerning changes in trabecular number are ambiguous: an increase44 as well as a reduction47 has been reported.
To address all options discussed in these publications, in the present study four different model series were created from modifications of the basic model to simulate OA progress. These four series cover the range of possible changes of bone mineralization and architecture during OA progression resulting in constant, increased or decreased BMD. All four series were constructed by modifying the basic trabecular model ninefold each, resulting in 10 different models per series. Therefore, overall 40 models (models 1–10 in four series) were examined. In each series, model 1 represented the basic model, which was identical in all four series.
In the first series, the rod diameter was increased stepwise by 20 μm, the rod number remained constant and the plate thickness was increased from 200 to 310 μm, resulting in an overall increase in BV/TV from 20 to 38% in steps of 2% (Table 2). Concurrently, mineralization was reduced, resulting in constant BMD in all 10 models. This series was named BMDconst. BMDconst, just like the series introduced in the following, consisted of 10 different models (named model 1 to model 10). In two other series, BMDup1 and BMDup2, BMD increased, which could result, for example, from an increase in BV/TV at constant tissue mineralization. BMD increases among models were identical in BMDup1 and BMDup2, but the underlying structural changes differed. In series BMDup1, the BV/TV increase was achieved by an increase in rod and plate thickness accompanied by a reduction in rod number (Table 3). In series BMDup2, the same BV/TV increase was achieved by an increase in rod thickness accompanied by constant plate thickness and rod number (Table 4).
In a fourth model series (BMDdown), decreasing BMD was simulated assuming hypomineralization without any structural changes and therefore constant BV/TV (Table 5). Here, BMD decreased at the same rate as it increased in BMDup1 and BMDup2.
Impact of image noise
Gaussian noise with a s.d. of 30 HU as measured in typical in vivo images40 was added to the models of all four series. The randomness of the noise distribution was simulated by adding noise repetitively 10 times, each time using different starting conditions of the random generator. In summary, for each of the 40 models, 10 different data sets were generated. For a given model, mean values and s.d. of these 10 data sets are reported for each texture parameter and for BMD. To examine the robustness of texture parameters with respect to noise, these s.d. were compared with the changes caused by variation of structure (models 1–10 in each series).
Analysis
Texture parameters. Five texture parameters described in detail in Lowitz et al.13 were used for the quantification of bone architecture: entropy, global and local inhomogeneity, anisotropy, and variogram slope. They were directly calculated from the gray value distribution of the data sets without prior binarization. These five texture parameters were preselected from a larger number of parameters. A detailed description of the preselection process is beyond the scope of this manuscript, but, briefly, parameters were in particular selected on the basis of their monotonic response to changes of OA-related structure modifications across different spatial resolutions. A detailed study on non-OA-related changes of bone structure has been published earlier.13 Practically, in each of the four model series a texture parameter should show a progressive increase or decrease with the change from model 1 to 10. The parameters excluded in the preselection process, such as fractal dimension (using differential box-counting48) (Figure 7) or lacunarity,48 violated this condition.
Figure 7.
Series BMDup1: Dependence of fractal dimension on OA structural changes for a voxel size of 250 μm. x axis: OA model number; y axis: mean values from 10 simulations with noise level 30 HU; error bars are s.d.
In addition to a monotonic response, the variation of noise should have lower impact on the surrogate measurements compared with structural changes. Varying noise levels may occur between longitudinal acquisitions with differences in image acquisition or reconstruction protocols. In summary, a surrogate parameter should demonstrate highly linear variation with OA-related structural changes and should only slightly depend on noise.
Statistics. The first part of the analysis was dedicated to the differentiation of the four different series. Linear discriminant analyses were carried out to determine how well texture parameter combinations could differentiate the four series BMDconst, BMDup1, BMDup2 and BMDdown. Results are given as hit ratios representing the ratio of correctly classified series by the discriminant functions. In the discriminant analysis, the texture parameters served as independent and the four series as dependent parameters. A four-class classification was used instead of a multiple pair-wise classifications. One hundred texture parameter measurements were used for each series––that is, 10 model series by 10 measurements. BMD was not included in this part of the analysis as by definition of the series BMD can be used to exactly differentiate BMDconst, BMDdown and the combined series BMDup1 and BMDup2. A second discriminant analysis using texture parameters to differentiate BMDup1 and BMDup2, which cannot be separated by BMD, concluded the first part of the analysis.
A more subtle question is whether any of the parameters including BMD can detect changes of the underlying structural modifications independent of the somewhat artificial division into series? This may be important to understand the pathology of OA and the effect of pharmacological treatment. Thus, in a second analysis part a multilinear regression analysis was applied using the structural parameters as dependent and BMD and/or texture parameters as independent variables.
In the third analysis part for each model series a multiple linear regression analysis with forward selection was performed to determine those texture parameters that best predicted OA structural changes. Consequently, for each analysis parameter 400 measurements were included––that is, 4 models series by 10 models by 10 measurements with different starting conditions of the random generator simulating noise. This was a valid approach as the aim of this analysis was to reveal the ability of BMD and texture measurements to determine structural parameters independent of specific model series. Then again for all series, but now separately for each texture parameter, an ANOVA was performed to investigate whether noise had a significant influence on the results of the texture parameters. If this was the case, a post hoc Tukey's HSD test was added to test pair-wise differences among the 10 models of the series.
All analyses were carried out independently for the three different voxel sizes 10, 90 and 250 μm. For all statistical tests, a P-value of <0.05 was considered statistically significant. All statistical analyses were carried out using IBM SPSS Statistics version 21.0.49
Diagnostic power. Finally, in analogy to the diagnostic power defined in,50 a figure of merit was calculated from the BMDconst series using the following relation:
 |
 |
As shown earlier,13 a change in noise (Δnoise) changes the absolute value of a texture parameter. Thus, it is of interest what noise-related change in a texture parameter would result in an equal change (responsediag) caused by structural differences between models. A higher noise sensitivity of a parameter results in lower diagnostic power. Three different responsediag values were calculated: between models 1 and 2; models 1 and 6; and models 1 and 10, respectively. This selection covers small, intermediate and large structure variations. The required Δnoise to give the same response in a given texture parameter was calculated from noise–texture relationships published earlier.13
Footnotes
The authors declare no conflict of interest.
References
- Intema F, Hazewinkel HA, Gouwens D, Bijlsma JW, Weinans H, Lafeber FP et al. In early OA, thinning of the subchondral plate is directly related to cartilage damage: results from a canine ACLT-meniscectomy model. Osteoarthritis Cartilage 2010;18:691–698. [DOI] [PubMed] [Google Scholar]
- Wolff J. The Law of Bone Remodeling. Springer: Berlin Heidelberg New York, 1986. [Google Scholar]
- Boyd SK, Muller R, Matyas JR, Wohl GR, Zernicke RF. Early morphometric and anisotropic change in periarticular cancellous bone in a model of experimental knee osteoarthritis quantified using microcomputed tomography. Clin Biomech (Bristol, Avon) 2000;15:624–631. [DOI] [PubMed] [Google Scholar]
- Ding M, Odgaard A, Hvid I. Changes in the three-dimensional microstructure of human tibial cancellous bone in early osteoarthritis. J Bone Joint Surg Br 2003;85:906–912. [PubMed] [Google Scholar]
- Wolski M, Podsiadlo GW, Stachowiak LS, Lohmander, Englund M. Differences in trabecular bone texture between knees with and without radiographic osteoarthritis detected by directional fractal signature method. Osteoarthritis Cartilage 2010;18:684–690. [DOI] [PubMed] [Google Scholar]
- Neogi T. Clinical significance of bone changes in osteoarthritis. Ther Adv Musculoskelet Dis 2012;4:259–267. [DOI] [PMC free article] [PubMed] [Google Scholar]
- Martin RB, Burr DB, Sharkey NA. Skeletal Tissue Mechanics Springer-Verlag: New York, Inc. 1998. [Google Scholar]
- Turunen MJ, Prantner V, Jurvelin JS, Kroger H, Isaksson H. Composition and microarchitecture of human trabecular bone changes with age and differs between anatomical locations. Bone 2013;54:118–125. [DOI] [PubMed] [Google Scholar]
- Hildebrand T, Laib A, Muller R, Dequeker J, Ruegsegger P. Direct three-dimensional morphometric analysis of human cancellous bone: microstructural data from spine, femur, iliac crest, and calcaneus. J Bone Miner Res 1999;14:1167–1174. [DOI] [PubMed] [Google Scholar]
- Showalter C, Clymer BD, Richmond B, Powell K. Three-dimensional texture analysis of cancellous bone cores evaluated at clinical CT resolutions. Osteoporos Int 2006;17:259–266. [DOI] [PubMed] [Google Scholar]
- Phan CM, Macklin EA, Bredella MA, Dadrich M, Flechsig P, Yoo AJ et al. Trabecular structure analysis using C-arm CT: comparison with MDCT and flat-panel volume CT. Skeletal Radiol 2011;40:1065–1072. [DOI] [PubMed] [Google Scholar]
- Hansen S, Beck Jensen JE, Rasmussen L, Hauge EM, Brixen K. Effects on bone Effects on bone geometry, density, and microarchitecture in the distal radius but not the tibia in women with primary hyperparathyroidism: A case-control study using HR-pQCT. J Bone Miner Res 2010;25:1941–1947. [DOI] [PubMed] [Google Scholar]
- Lowitz T, Museyko O, Bousson V, Kalender WA, Laredo JD, Engelke K. A Digital Model to Simulate Effects of Bone Architecture Variations on Texture at Spatial Resolutions of CT, HR-pQCT, and μCT Scanners. J Med Eng 2014;2014: Article ID 946574. [DOI] [PMC free article] [PubMed] [Google Scholar]
- Messent EA, Ward RJ, Tonkin CJ, Buckland-Wright C. Differences in trabecular structure between knees with and without osteoarthritis quantified by macro and standard radiography, respectively. Osteoarthritis Cartilage 2006;14:1302–1305. [DOI] [PubMed] [Google Scholar]
- Kraus VB, Feng S, Wang S, White S, Ainslie M, Brett A et al. Trabecular morphometry by fractal signature analysis is a novel marker of osteoarthritis progression. Arthritis Rheum 2009;60:3711–3722. [DOI] [PMC free article] [PubMed] [Google Scholar]
- Kraus VB, Feng S, Wang S, White S, Ainslie M, Le Graverand MP et al. Subchondral bone trabecular integrity predicts and changes concurrently with radiographic and MRI determined knee osteoarthritis progression. Arthritis Rheum 2013;65:1812–1821. [DOI] [PMC free article] [PubMed] [Google Scholar]
- Woloszynski T, Podsiadlo P, Stachowiak GW, Kurzynski M, Lohmander LS, Englund M. Prediction of progression of radiographic knee osteoarthritis using tibial trabecular bone texture. Arthritis Rheum 2012;64:688–695. [DOI] [PubMed] [Google Scholar]
- Podsiadlo P, Dahl L, Englund M, Lohmander LS, Stachowiak GW. Differences in trabecular bone texture between knees with and without radiographic osteoarthritis detected by fractal methods. Osteoarthritis Cartilage 2008;16:323–329. [DOI] [PubMed] [Google Scholar]
- Beuf O, Ghosh S, Newitt DC, Link TM, Steinbach L, Ries M et al. Magnetic resonance imaging of normal and osteoarthritic trabecular bone structure in the human knee. Arthritis Rheum 2002;46:385–393. [DOI] [PubMed] [Google Scholar]
- Lindsey CT, Narasimhan A, Adolfo JM, Jin H, Steinbach LS, Link T et al. Magnetic resonance evaluation of the interrelationship between articular cartilage and trabecular bone of the osteoarthritic knee. Osteoarthritis Cartilage 2004;12:86–96. [DOI] [PubMed] [Google Scholar]
- Bolbos RI, Zuo J, Banerjee S, Link TM, Ma CB, Li X et al. Relationship between trabecular bone structure and articular cartilage morphology and relaxation times in early OA of the knee joint using parallel MRI at 3 T. Osteoarthritis Cartilage 2008;16:1150–1159. [DOI] [PMC free article] [PubMed] [Google Scholar]
- Marques J, Genant HK, Lillholm M, Dam EB. Diagnosis of osteoarthritis and prognosis of tibial cartilage loss by quantification of tibia trabecular bone from MRI. Magn Reson Med 2012;70:568–575. [DOI] [PubMed] [Google Scholar]
- Lo GH, Tassinari AM, Driban JB, Price LL, Schneider E, Majumdar S et al. Cross-sectional DXA and MR measures of tibial periarticular bone associate with radiographic knee osteoarthritis severity. Osteoarthritis Cartilage 2012;20:686–693. [DOI] [PMC free article] [PubMed] [Google Scholar]
- Shen Y, Zhang YH, Shen L. Postmenopausal women with osteoporosis and osteoarthritis show different microstructural characteristics of trabecular bone in proximal tibia using high-resolution magnetic resonance imaging at 3 tesla. BMC Musculoskelet Disord 2013;14:136. [DOI] [PMC free article] [PubMed] [Google Scholar]
- Chiba K, Nango N, Kubota S, Okazaki N, Taguchi K, Osaki M et al. Relationship between microstructure and degree of mineralization in subchondral bone of osteoarthritis: a synchrotron radiation microCT study. J Bone Miner Res 2012;27:1511–1517. [DOI] [PubMed] [Google Scholar]
- Djuric M, Zagorac S, Milovanovic P, Djonic D, Nikolic S, Hahn M et al. Enhanced trabecular micro-architecture of the femoral neck in hip osteoarthritis vs. healthy controls: a micro-computer tomography study in postmenopausal women. Int Orthop 2013;37:21–26. [DOI] [PMC free article] [PubMed] [Google Scholar]
- Li ZC, Dai LY, Jiang LS, Qiu S. Difference in subchondral cancellous bone between postmenopausal women with hip osteoarthritis and osteoporotic fracture: implication for fatigue microdamage, bone microarchitecture, and biomechanical properties. Arthritis Rheum 2012;64:3955–3962. [DOI] [PubMed] [Google Scholar]
- Bauer JS, Link TM, Burghardt A, Henning TD, Mueller D, Majumdar S et al. Analysis of trabecular bone structure with multidetector spiral computed tomography in a simulated soft-tissue environment. Calcif Tissue Int 2007;80:366–373. [DOI] [PubMed] [Google Scholar]
- Chiba K, Ito M, Osaki M, Uetani M, Shindo H. In vivo structural analysis of subchondral trabecular bone in osteoarthritis of the hip using multi-detector row CT. Osteoarthritis Cartilage 2011;19:180–185. [DOI] [PubMed] [Google Scholar]
- Bauer JS, Sidorenko I, Mueller D, Baum T, Issever AS, Eckstein F et al. Prediction of bone strength by muCT and MDCT-based finite-element-models: 480 how much spatial resolution is needed? Eur J Radiol 2014;83:e36–e42. [DOI] [PubMed] [Google Scholar]
- Kim N, Lee JG, Song Y, Kim HJ, S. Yeom J, Cho G. Evaluation of MRI resolution affecting trabecular bone parameters: determination of acceptable resolution. Magn Reson Med 2012;67:218–225. [DOI] [PubMed] [Google Scholar]
- Engelke K, Song SM, Gluer CC, Genant HK. A digital model of trabecular bone. J Bone Miner Res 1996;11:480–489. [DOI] [PubMed] [Google Scholar]
- Krebs A, Graeff C, Frieling I, Kurz B, Timm W, Engelke K et al. High resolution computed tomography of the vertebrae yields accurate information on trabecular distances if processed by 3D fuzzy segmentation approaches. Bone 2009;44:145–152. [DOI] [PubMed] [Google Scholar]
- Zerfass P, Lowitz T, Museyko O, Bousson V, Laouisset L, Kalender WA et al. An integrated segmentation and analysis approach for QCT of the knee to determine subchondral bone mineral density and texture. IEEE Trans Biomed Eng 2012;59:2449–2458. [DOI] [PubMed] [Google Scholar]
- Benhamou CL, Poupon S, Lespessailles E, Loiseau S, Jennane R, Siroux V et al. Fractal analysis of radiographic trabecular bone texture and bone mineral density: two complementary parameters related to osteoporotic fractures. J Bone Miner Res 2001;16:697–704. [DOI] [PubMed] [Google Scholar]
- Lespessailles E, Poupon S, Niamane R, Loiseau-Peres S, Derommelaere G, Harba R et al. Fractal analysis of trabecular bone texture on calcaneus radiographs: effects of age, time since menopause and hormone replacement therapy. Osteoporos Int 2002;13:366–372. [DOI] [PubMed] [Google Scholar]
- Majumdar S, Weinstein RS, Prasad RR. Application of fractal geometry techniques to the study of trabecular bone. Med Phys 1993;20:1611–1619. [DOI] [PubMed] [Google Scholar]
- Dougherty G, Henebry GM. Fractal signature and lacunarity in the measurement of the texture of trabecular bone in clinical CT images. Med Eng Phys 2001;23:369–380. [DOI] [PubMed] [Google Scholar]
- Dougherty G. A comparison of the texture of computed tomography and projection radiography images of vertebral trabecular bone using fractal signature and lacunarity. Med Eng Phys 2001;23:313–321. [DOI] [PubMed] [Google Scholar]
- Kalender WA. Computed Tomography, Fundamentals, System Technology, Image Quality, Applications. 3rd edn. Publicis: Erlangen, 2011. [Google Scholar]
- Akamatsu Y, Mitsugi N, Taki N, Kobayashi H, Saito T. Medial versus lateral condyle bone mineral density ratios in a cross-sectional study: a potential marker for medial knee osteoarthritis severity. Arthritis Care Res (Hoboken) 2012;64:1036–1045. [DOI] [PubMed] [Google Scholar]
- Karvonen RL, Miller PR, Nelson DA, Granda JL, Fernandez-Madrid F. Periarticular osteoporosis in osteoarthritis of the knee. J Rheumatol 1998;25:2187–2194. [PubMed] [Google Scholar]
- Abdin-Mohamed M, Jameson K, Dennison EM, Cooper C, Arden NK, Hertfordshire G. Volumetric bone mineral density of the tibia is not increased in subjects with radiographic knee osteoarthritis. Osteoarthritis Cartilage 2009;17:174–177. [DOI] [PubMed] [Google Scholar]
- Chappard C, Peyrin F, Bonnassie A, Lemineur G, Brunet-Imbault B, Lespessailles E et al. Subchondral bone micro-architectural alterations in osteoarthritis: a synchrotron micro-computed tomography study. Osteoarthritis Cartilage 2006;14:215–223. [DOI] [PubMed] [Google Scholar]
- Grynpas MD, Alpert B, Katz I, Lieberman I, Pritzker KP. Subchondral bone in osteoarthritis. Calcif Tissue Int 1991;49:20–26. [DOI] [PubMed] [Google Scholar]
- Bobinac D, Spanjol J, Zoricic S, Maric I. Changes in articular cartilage and subchondral bone histomorphometry in osteoarthritic knee joints in humans. Bone 2003;32:284–290. [DOI] [PubMed] [Google Scholar]
- Kamibayashi L, Wyss UP, Cooke TD, Ze B. Trabecular microstructure in the medial condyle of the proximal tibia of patients with knee osteoarthritis. Bone 1995;17:27–35. [DOI] [PubMed] [Google Scholar]
- Barros Filho MN, Sobreira FJA. Accuracy of lacunarity algorithms in texture classification of high spatial resolution images from urban areas. The International Archives of the Photogrammetry, Remote Sensing and Spatial Information Sciences 2008;37:417–422. [Google Scholar]
- IBM Corp. Released 2012. IBM SPSS Statistics for Windows IBM Corp: Veterans Affairs, New York. [Google Scholar]
- Engelke K, Gluer CC. Quality and performance measures in bone densitometry: part 1: errors and diagnosis. Osteoporos Int 2006;17:1283–1292. [DOI] [PubMed] [Google Scholar]