

Significance
The extremely short and bright X-ray pulses produced by X-ray free-electron lasers unlock new opportunities in crystallography-based structural biology research. Efficient methods to deliver crystalline material are necessary due to damage or destruction of the crystal by the X-ray pulse. Crystals for the first experiments were 5 µm or smaller in size, delivered by a liquid injector. We describe a highly automated goniometer-based approach, compatible with crystals of larger and varied sizes, and accessible at cryogenic or ambient temperatures. These methods, coupled with improvements in data-processing algorithms, have resulted in high-resolution structures, unadulterated by the effects of radiation exposure, from only 100 to 1,000 diffraction images.
Keywords: femtosecond diffraction, crystallography, XFEL, structural biology
Abstract
The emerging method of femtosecond crystallography (FX) may extend the diffraction resolution accessible from small radiation-sensitive crystals and provides a means to determine catalytically accurate structures of acutely radiation-sensitive metalloenzymes. Automated goniometer-based instrumentation developed for use at the Linac Coherent Light Source enabled efficient and flexible FX experiments to be performed on a variety of sample types. In the case of rod-shaped Cpl hydrogenase crystals, only five crystals and about 30 min of beam time were used to obtain the 125 still diffraction patterns used to produce a 1.6-Å resolution electron density map. For smaller crystals, high-density grids were used to increase sample throughput; 930 myoglobin crystals mounted at random orientation inside 32 grids were exposed, demonstrating the utility of this approach. Screening results from cryocooled crystals of β2-adrenoreceptor and an RNA polymerase II complex indicate the potential to extend the diffraction resolution obtainable from very radiation-sensitive samples beyond that possible with undulator-based synchrotron sources.
Using extremely bright, short-timescale X-ray pulses produced by X-ray free-electron lasers (XFELs), femtosecond crystallography (FX) is an emerging method that expands the structural information accessible from very small or very radiation-sensitive macromolecular crystals. Central to this method is the “diffraction before destruction” (1) process in which a still diffraction image is produced by a single X-ray pulse before significant radiation-induced electronic and atomic rearrangements occur within the crystal (1–3). At the Linac Coherent Light Source (LCLS) at SLAC, a single ∼50-fs–long X-ray pulse can expose a crystal to as many X-ray photons as a typical synchrotron beam line produces in about a second. Exposing small crystals to these intense ultrashort pulses circumvents the dose limitations of conventional X-ray diffraction experiments (4) and may produce useful data to resolutions beyond what is achievable at synchrotrons (5). This innovation provides a pathway to obtain atomic information from proteins that only form micrometer- to nanometer-sized crystals, such as many membrane proteins and large multiprotein complexes. Moreover, XFELs enable “diffraction before reduction” data collection to address another major challenge in structural enzymology by providing a means to determine catalytically accurate structures of acutely radiation-sensitive metalloenzyme active sites (6), such as high-valency reaction intermediates that may be significantly photoreduced during a single X-ray exposure at a synchrotron, even at very small doses (7–11). Furthermore, the use of short (tens of femtoseconds) X-ray pulses further complements the structural characterization of biochemical reaction processes by providing access to a time domain two to three orders of magnitude faster (12, 13) than currently accessible using synchrotrons.
A single X-ray pulse from the LCLS damages the illuminated sample volume and also some of the sample in the immediate vicinity, requiring the combination of measurements from discrete volumes or units of crystalline material to obtain a complete dataset (14). The first FX experiments were carried out in vacuum at the LCLS using a gas dynamic virtual nozzle (GDVN) liquid injector (15), which delivered crystals of submicron to a few microns in size, suspended in carrier solution to a series of X-ray pulses produced at up to a 120-Hz repetition rate. These pioneering experiments demonstrated the utility of serial femtosecond crystallography (SFX) and the use of crystals of less than 5 μm in size, often termed “nanocrystals” (NCs), for macromolecular structure determination to high resolution (16, 17). As NCs may be a ubiquitous but generally overlooked outcome of commercial crystallization screens that fail to produce larger crystals (18), FX may open up many systems to crystallographic analysis. However, to develop FX into a generally applicable method, a number of challenges in the areas of sample preparation, data collection, and data processing must be overcome.
Obtaining a sufficient supply of crystals in an appropriate carrier solution is a first hurdle to conducting a SFX experiment. In addition to the GDVN (2, 3, 14, 16, 17, 19, 20), other injectors such as a nanoflow electrospinning injector (21) and a lipidic cubic phase (LCP) injector (22), have been developed that have a reduced flow rate and lower sample consumption. However, because injectors deliver a continuous stream of solution containing a random distribution of crystals, and the X-ray pulses are extremely short, often only a small percentage of pulses hit a crystal and produce a useful diffraction pattern. Carrying out these experiments at room temperature avoids the difficulties associated with cryoprotection, and datasets obtained at ambient temperatures can provide insight on the functional motions of protein molecules (23). However, there are different and often more complex optimization steps associated with specific injector technologies. Solutions containing a mixture of crystal sizes may require filtering to avoid clogging in the injector nozzle, and delicate crystals may be damaged from the pressures and shear forces of the delivery process itself (24). For experiments conducted in vacuo, stream formation may be disrupted by solution bubbling, drying, or freezing as it exits the injector and enters the vacuum chamber. Drop-on-demand methods that deliver single drops containing crystals to individual X-ray pulses have the potential to significantly reduce sample consumption are in development, such as acoustic and micropiezo activated technologies, but implementation has been complicated by a variety of factors, including difficulties imposed by viscous solutions and unpredictable trajectories of drops that contain crystals of varied shapes and sizes.
Here, we describe an alternative strategy for FX experiments that leverages the well-established benefits of the highly automated goniometer-based setups used at state-of-the-art microfocus synchrotron beam lines, and expands these technologies to take full advantage of the unique capabilities of XFEL sources. Key to this approach is the coupling of highly automated instrumentation with specialized sample containers and customized software for efficient data collection with minimal sample consumption. High-density sample containers, such as microfluidic chips or microcrystal traps (25) for room temperature studies or grids for experiments at cryogenic temperatures, hold samples in known locations. These sample holders enable very rapid and precise positioning of crystals into the X-ray interaction region for consistent production of diffraction patterns. To optimize data completeness and resolution, data may be collected using a range of crystal sizes with a variety of X-ray beam sizes, and different regions of larger crystals may be exposed in different orientations. When small crystals align with the sample holder in a preferred orientation, exposing each crystal at varied angles to the holder surface may take advantage of this effect to enhance completeness. When the X-ray pulse mean diameter is greater than about 8 μm or is highly attenuated, the protein crystal may remain intact after exposure to the X-ray pulse and still diffract, but usually to a lower resolution as a result of radiation damage. In these cases, it is possible to rotate the crystal and collect additional diffraction patterns to use as an aid in indexing and scaling the partially recorded reflections of the initial still diffraction pattern.
Instrumentation
The experimental setup (Fig. 1 and Fig. S1) combines equipment developed both at the LCLS and by the Structural Molecular Biology group at the Stanford Synchrotron Radiation Lightsource (SSRL). The setup was built into the LCLS X-ray pump/probe instrument (XPP) using its X-ray optical and diagnostics components and energy spectrometer (26). Beryllium compound refractive lenses (27) were used to focus the LCLS self-amplified spontaneous emission beam down to sizes of 5 µm. An SSRL microdiffractometer (goniometer) enables precise and rapid positioning of crystals into the X-ray beam interaction region for data collection (SI Materials and Methods and Table S1). A sample mounted on the microdiffractometer is viewed along the X-ray propagation direction by an in-line camera system. This camera supplies a live video image to the control software, which provides a click-to-center system: clicking on the image of the sample causes the clicked point to move to the rotation center of the microdiffractometer. The Stanford automated mounter (SAM) (28) is used for sample exchange and includes storage locations for 288 sample mounts at cryogenic temperatures and 6 at room temperature. Other equipment includes a beamstop and scatter guard assembly, and a Rayonix MX325HE CCD detector mounted in a positioning cradle. The sample handling and crystallography experiment is controlled through the Blu-Ice/DCS software (29), which can request pulses from LCLS and initiate synchronized data streams with the DAQ software through the use of LCLS-provided EPICS interface. This highly automated system enables the experiment to be performed from the XPP control room without depending on personnel access to the experimental area. Diffraction images were analyzed in quasi-real time to determine unit cell parameters, diffraction resolution, and dataset completeness using the cctbx.xfel package (30).
Fig. 1.

Schematic representations of the experimental environment. (A) An overview of the experimental setup illustrating the microdiffractometer on the experimental table, the SAM sample exchange robot with sample storage Dewar, the Rayonix 325 CCD detector in a motorized positioning cradle, and the on-axis cryocooler nozzle (orange) for measurements at cryogenic temperatures. (B) A close-up view of the sample environment showing a sample holder (orange) mounted on the diffractometer and the beamstop/collimator assembly (dark blue) inserted for data collection. (C) A close-up view of the sample environment with the beamstop/collimator assembly retracted, side illumination (yellow), and the backlight (green) inserted and for sample viewing with the in-line camera system, that consists of a drilled mirror (aqua) that directs an image of the sample onto a motorized zoom assembly and CCD (purple).
Data Collection Protocols
Macromolecular crystals have a variety of characteristics such as size, shape, mechanical and chemical stress response, and radiation sensitivity. Therefore, a portfolio of sample holders and data collection strategies was developed to meet different experimental requirements and to optimize efficiency. To this end, data collection modes for serial crystallography were developed and incorporated into the Blu-Ice/DCS graphical user interface and experimental control software (29). These modes include click-and-shoot (exposure to a single X-ray pulse at a selected position), raster (automated translation of the sample between exposures), helical (automated translation and rotation of the sample), and a highly efficient multicrystal data collection mode that combines the capabilities of the previous modes, with automated positioning of crystals inside high-density sample holders (such as grids) for rapid multicrystal experiments. For each mode, the photon energy distribution of each X-ray pulse used to collect a diffraction pattern may be recorded using the energy spectrometer (SI Materials and Methods and Fig. S2).
Raster Data Collection
The rastering mode of data collection was developed to collect still diffraction images from crystals mounted on meshes, nylon loops, and grids with the goal of extending the resolution obtained from very radiation-sensitive samples. After a sample is robotically mounted on the microdiffractometer, the experimenter uses the software to define a single position (click-and-shoot) or an area of the sample to use for data collection (Fig. S3). Single-shot images are collected within this area, with the translation between shots specified through the user interface. Typically, a focused XFEL pulse with beam sizes of ∼8 µm or less will vaporize the sample (Fig. 2), leaving a hole larger than the beam size. An appropriate translation distance is selected to ensure that each shot interacts with an unaffected part of the sample.
Fig. 2.
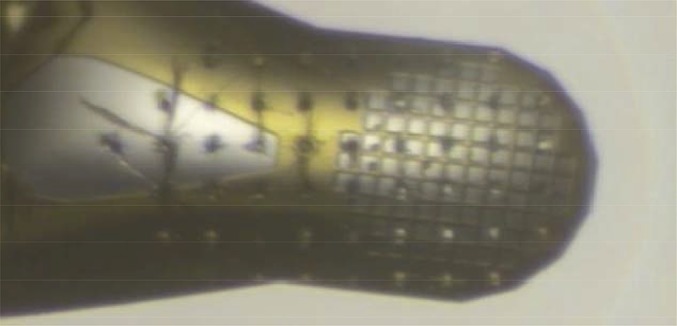
A sample mesh after raster data collection using a 3-µm beam size and a larger step size showing areas vaporized by the X-ray pulse.
Diffraction quality screening experiments were carried out using the rastering mode of data collection and grids containing micrometer-sized crystals of a multiprotein complex, composed of RNA polymerase II (Pol II), general transcription factor IIB (TFIIB), and a large nucleic acid scaffold (NAS) (SI Materials and Methods). Diffraction patterns of superior resolution (3.3 Å) were observed when using the microdiffractometer setup at LCLS XPP at 100 K than were previously measured at LCLS-CXI or at the synchrotron (Table S2). The lower diffraction resolution observed (4.0 Å) during screening experiments at LCLS CXI using smaller crystals and the GDVN injector suggests that a larger sample volume may be required to obtain higher resolution diffraction, or that the crystals were damaged during injection, potentially a consequence of their high solvent content (24). The best diffraction resolution (3.7 Å) observed at SSRL BL12-2 from these crystals (grown in same crystallization batch as used at LCLS XPP), suggests that Pol II–TFIIB–NAS crystals suffer significant radiation damage during the exposure time needed to deliver an equivalent dose at a synchrotron.
Improved diffraction resolution was also observed for β2-adrenoreceptor/nanobody complex crystals collected at 100 K at LCLS XPP using the microdiffractometer. The best diffraction resolution obtained was 2.3 Å (Fig. 3), and overall screening results indicate a dataset of 2.8-Å resolution could be collected given sufficient time. In contrast, the best resolution observed, using crystals from the same crystallization batch, was 2.9 Å at the Advanced Photon Source 23ID, where a 3.2-Å dataset was obtained (31).
Fig. 3.

β2-Adrenoreceptor:nanobody complex diffraction pattern collected during diffraction quality screening experiments at LCLS-XPP.
Helical Data Collection
A helical data collection mode was developed to efficiently determine “radiation damage-free” structures of sensitive metalloenzymes that form conventionally sized and ideally long crystals. A single X-ray pulse will initiate photoreduction within the exposed region of the crystal, so dataset completeness is optimized by using a beam size smaller than the crystal size and collecting multiple still diffraction patterns from different areas across the crystal. To begin, the experimenter draws a line defining the length and position of the crystal that is overlaid on the real-time sample video display within Blu-Ice (Fig. 4 and Fig. S4), and optionally defines a position on the end of the crystal to collect a still diffraction pattern to use for a strategy calculation (SI Materials and Methods). During data collection, the crystal is rotated to a new orientation, determined by taking into account the mosaicity of the crystal such that there is full coverage of reciprocal space, and translated to place an unexposed region of the crystal into the X-ray beam. Additional space is left between each area exposed to ensure each still diffraction pattern is not compromised by the prior X-ray exposure. The photoelectrons produced by each X-ray pulse will travel only a few microns through the crystal (32), but the crystal may also undergo thermal or mechanical damage requiring a larger step size.
Fig. 4.

Screen capture image of the Blu-Ice GUI showing a video display of a Cpl crystal setup for helical data collection. The yellow line defines the crystal length, and the overlaid boxes depict the locations for future exposure to a single 50-µm X-ray pulse.
The helical mode of data collection was used to collect a 92% complete dataset to 1.6-Å resolution using only five, 1- to 3-mm–long, crystals of the monomeric iron-containing hydrogenase (CpI) from Clostridium pasteurianum (SI Materials and Methods). Crystals were translated by 70 µm and rotated by 0.5° between exposure to an unattenuated 50-µm X-ray pulse. The structure was solved by molecular replacement using this dataset, and the Fe-S clusters, which were not included in the molecular replacement (MR) search model, were readily identifiable in both 2Fo − Fc and Fo − Fc electron density maps following REFMAC refinement (Fig. 5 A and B). Superposition of the model refined with the LCLS data, against a hydrogenase CpI model refined using synchrotron data [Protein Data Bank (PDB) ID code 3C8Y] showed that they were essentially identical (0.2 Å rmsd for all 574 Cα atoms). Data-processing and some preliminary refinement statistics are given in Table S3.
Fig. 5.

Electron density maps calculated from still images. (A) 2Fo − Fc (blue, contoured at 1.0 σ) and Fo − Fc (red, contoured at 3.0 σ) difference density maps calculated for Cpl at the site of one of the Fe-S clusters, following molecular replacement using data processed by cctbx-xfel. (B) A with the Fe-S cluster from the refined Cpl structure overlaid. (C) 2Fo − Fc density (blue, contoured at 1.0σ) for myoglobin, showing the density corresponding to the heme group edge-on, which was omitted from the refinement. The myoglobin molecule is shown as a green ribbon, and two histidine residues are indicated. (D) Face-on view of the 2Fo − Fc omit density shown in C, with the refined structure of the heme group overlaid. The water molecule coordinated to the heme iron (orange) is shown as a cyan ball, hydrogen bonded to the side chain of His64.
Grid Data Collection
The sample mounting grid (Fig. 6 and Fig. S5) is a high-density sample holder developed at SSRL for automated data collection from a large number of crystals that will only survive a few X-ray exposures. Each grid contains multiple holes (ports) that can hold either larger crystals in known locations or groups of smaller crystals. The location of each port may be automatically positioned in the X-ray beam, for efficient automated multicrystal experiments. The ports in the grid that contain a crystal may be entered into an Excel spreadsheet and uploaded into the experimental control software before the experiment. The grid is compatible with automation for sample mounting and can reliably fit inside a universal puck or SSRL cassette. Grids may be manually filled with crystals and flash frozen. Automated methods have also been developed for in situ grid crystallization.
Fig. 6.

High density sample mounting grid. A comparison of the form factor of a grid assembly and a Hampton-style copper-magnetic pin assembly. The grid contains 125-, 200-, and 400-µm–diameter holes for mounting crystals.
Data collection using grids starts with a semiautomated alignment procedure including fiducialization of the grid (SI Materials and Methods and Fig. S6). The locations of the grid ports are calculated and overlaid on the video view of the grid. In cases where the crystal size is close to the size of the grid port, the automated data collection system centers each port containing a crystal into the X-ray interaction region and collects a still diffraction pattern. Alternatively, after translating to a new port, a different area of the port may be identified by the experimenter and centered to use for data collection. If many smaller crystals are in a port, an area may be specified for raster data collection, or an option to raster the entire port area may be selected (Fig. S3).
Oscillation Data
Depending on the beam size, beam intensity, and crystal properties, at cryogenic temperatures the crystal may remain intact after exposure to a single X-ray pulse. In these cases, to aid in processing the resulting still diffraction pattern, the data collection modes include options for collecting additional data from the crystal.
“Oscillation” images are produced by rotating the sample at a constant velocity of 1°/s while exposing the crystal to attenuated X-ray pulses at 120 Hz (Fig. S7). Therefore, a single 1° oscillation image is comprised of 120 overlaid still diffraction patterns. When feasible, 5–11° of oscillation images are collected, centered on the orientation of the first still diffraction pattern. The oscillation data mimic rotation data typically collected at a synchrotron, enabling the use of conventional data analysis programs, such as XDS (33), MOSFLM (34), and POINTLESS (35) to define the unit cell and orientation matrix. This information may then be applied to the corresponding still diffraction pattern to improve estimates of reflection partiality, resolve indexing ambiguities of some space groups that can result in apparent twinning when merging still diffraction patterns from different crystals, and improve scaling of the corresponding still diffraction data.
Hexagonal (P6) myoglobin is an example where an indexing ambiguity between crystals was overcome by the use of oscillation data, which enabled the processing of 739 still diffraction images collected at full intensity (SI Materials and Methods). This approach resulted in a radiation damage-free dataset complete to 1.48 Å and extending to 1.36 Å (Table S4). Following structure solution by molecular replacement (MR) using a monoclinic myoglobin model (PDB ID code 1VXA), the heme group, which was omitted in the MR search model, was clearly visible in the resultant 2Fo − Fc (Fig. 5C) electron density map. The structure was refined to a total R factor of 15.9% and free R factor of 18.8%; the location of the refined heme group in the original MR electron density is shown (Fig. 5D).
Discussion
The collection of high redundancy data are particularly important for FX experiments, as these datasets are produced from scaled partial observations of each reflection. The goniometer-based instrumentation described here provides an efficient and flexible framework with which to carry out these experiments, using automated strategies tailored to handle a variety of sample requirements, crystal sizes, and experimental goals. These developments, coupled with recent improvements in data-processing algorithms (30), make it possible to derive high-resolution structures, unadulterated by the effects of radiation exposure, using only 100–1,000 still diffraction images. The exposure of over 930 randomly oriented myoglobin crystals using only 32 grids demonstrates the utility of high-density sample containers, such as grids to optimize throughput and sample consumption. These experiments have also shown that the collection of oscillation data following the collection of a single still diffraction pattern offers a very reliable way to resolve indexing ambiguities using conventional software. Although oscillation data can be collected and indexed even from severely damaged crystals, it is necessary that the crystal retains physical integrity after the first still shot, which precludes this approach when a focused beam of ∼8 µm or less is used. In cases where an isomorphous dataset from a conventional source is not available, constructing a dataset from the oscillation images collected from each crystal can help with processing the still data. This also provides performance benchmarks for the development of more sophisticated methods for single-shot data scaling and postrefinement.
The mean photon energy used for analyzing each still diffraction image of the myoglobin dataset was determined by calculating the centroid of the energy spectrum of each X-ray pulse measured by the single-shot spectrometer. In the most typical mode of LCLS operation, each X-ray pulse varies in intensity and energy distribution within a window of about 60 eV. Data quality may be improved through the development of algorithms that take the intensity and entire energy spectrum of individual pulses into account. However, variation in quality and nonisomorphism between crystals and even between areas within larger crystals, which can experience uneven stresses across the sample mount, may in some cases have a significantly more harmful effect.
When long crystals are available, helical data collection is a very efficient method of data collection at XFEL sources. Recently, a 1.9-Å resolution structure of cytochrome c oxidase was determined using 1,107 still diffraction images from 76 crystals (36). In the case of rod-shaped hydrogenase crystals in tetragonal space group P43212, only five crystals and about a half an hour of LCLS beam time were used to obtain the 125 still diffraction patterns used to produce a high quality electron density map to 1.6-Å resolution.
Diffraction quality screening results from Pol II–TFIIB–NAS and β2-adrenoreceptor GPCR crystals illustrate the utility of a microdiffractometer setup at LCLS to extend the resolution that can be obtained from very radiation-sensitive samples. However, it should be noted that, for a number of other crystals, improvements in diffraction resolution were not observed at LCLS XPP compared with the diffraction measured at the synchrotron using an equivalent X-ray dose. Furthermore, for a few proteins, exposure to a higher X-ray dose at the synchrotron produced diffraction patterns of superior resolution. It is possible that brighter XFEL pulses may further improve diffraction for these cases. Alternatively, for many conventionally sized crystals, the diffraction obtained on a single image may be limited by the intrinsic order of the crystal rather than radiation damage. As the FX field is in its infancy, systematic testing is necessary to refine the method and sample selection process. Screening crystals of a few microns and larger in size for radiation sensitivity and amenability to cryopreservation at the synchrotron will be valuable steps to identify which samples would benefit most from the FX approach with currently available sources. As many of these will be challenging systems, goniometer-based experimentation provides a reliable and efficient delivery method to conduct FX experiments compatible with fragile crystals of limited quantity at both cryogenic and ambient temperatures.
The use of specifically designed sample holders, the implementation of the CSPAD (37), which can produce images at 120 Hz, or future improved versions of this detector with better dynamic range, and an upgrade of the microdiffractometer will enable data collection rates that match the maximum pulse frequency of 120 Hz delivered by the LCLS XFEL. An upgraded version of the microdiffractometer with faster translation axes will target samples spaced 250 µm apart at 120 Hz while accommodating inclinations off the horizontal axis of up to 1 part in 10.
Although these efforts will be important to improve sample throughput, the limited amount of beam time available will remain a serious factor impeding progress of the FX field as a whole. The construction of new sources (38) will help to alleviate this situation. Multiplexing XFEL pulses to multiple experimental instruments is another attractive option to increase access to beam time at LCLS. To take advantage of multiplexing modes (SI Materials and Methods), a dedicated experimental station with similar highly automated remote-access capable goniometer-based instrumentation, is currently being built and will enable the experimenter to preassign data collection strategies, premap sample locations for data collection, and will have the option to use cryogenically cooled samples that may be easily stored and robotically mounted on the microdiffractometer at a moment’s notice.
Materials and Methods
Two types of crystals were selected for screening experiments using the rastering mode of data collection: (i) Pol II–TFIIB–NAS, a multiprotein complex, composed of Pol II, transcription factor TFIIB, and a large NAS, and (ii) β2-adrenoreceptor bound to the agonist BI167107 and a nanobody that stabilizes the active state (Nb6B9) (SI Materials and Methods). β2-Adrenoreceptor/nanobody complex crystals were mounted onto micromeshes and flash frozen. A batch of Pol II–TFIIB–NAS crystals were grown inside grids using a specialized crystallization tray and flash frozen. Two types of radiation-sensitive metalloenzyme crystals were selected for data collection: (i) CpI [FeFe]-hydrogenase from Clostridium pasteurianum and (ii) sperm whale myoglobin (SI Materials and Methods). Myoglobin crystals were harvested from hanging drops, covered with a thin coat of Paratone-N (Parabar 10312; Hampton Research), and placed inside a grid port, and the grid was flash frozen. CpI [FeFe]-hydrogenase crystals were grown using the microcapillary batch diffusion method, mounted in cryoloops, and flash frozen (SI Materials and Methods). Diffraction data for all crystals were collected at 100 K using the goniomemeter-based setup at LCLS XPP (SI Materials and Methods). Datasets were processed using both cctbx.xfel (30) and IPMOSFLM/SCALA (34), and the structures were solved using molecular replacement (SI Materials and Methods).
Supplementary Material
Acknowledgments
Portions of this research were carried out at the Linac Coherent Light Source (LCLS), a National User Facility operated by Stanford University on behalf of the US Department of Energy, Office of Basic Energy Sciences. The XPP and CXI instruments were funded through the LCLS Ultrafast Science Instruments project funded by the US Department of Energy, Office of Basic Energy Sciences. Use of the Stanford Synchrotron Radiation Lightsource (SSRL), SLAC National Accelerator Laboratory, is supported by the US Department of Energy, Office of Science, Office of Basic Energy Sciences under Contract DE-AC02-76SF00515. The SSRL Structural Molecular Biology Program is supported by the US Department of Energy Office of Biological and Environmental Research, and by the National Institutes of Health (NIH), National Institute of General Medical Sciences (including P41GM103393). A.T.B., A.Y.L., M.U., O.B.Z., and W.I.W. were supported in part by a Howard Hughes Medical Institute Collaborative Innovation Award that also provided funds for the purchase of the microdiffractometer. N.K.S. acknowledges the support of NIH Grants GM095887 and GM102520 for data-processing methods. J.M.H. was supported by NIH Grants GM073210, GM082250, and GM094625. This work is supported as a part of the Biological and Electron Transfer and Catalysis EFRC, an Energy Frontiers Research Center funded by the US Department of Energy, Office of Science (DE-SC0012518).
Footnotes
The authors declare no conflict of interest.
Data deposition: The atomic coordinates and structure factors have been deposited in the Protein Data Bank, www.pdb.org (PDB ID code 4PNJ).
See Commentary on page 16986.
This article contains supporting information online at www.pnas.org/lookup/suppl/doi:10.1073/pnas.1418733111/-/DCSupplemental.
References
- 1.Neutze R, Wouts R, van der Spoel D, Weckert E, Hajdu J. Potential for biomolecular imaging with femtosecond X-ray pulses. Nature. 2000;406(6797):752–757. doi: 10.1038/35021099. [DOI] [PubMed] [Google Scholar]
- 2.Lomb L, et al. Radiation damage in protein serial femtosecond crystallography using an x-ray free-electron laser. Phys Rev B. 2011;84(21):214111. doi: 10.1103/PhysRevB.84.214111. [DOI] [PMC free article] [PubMed] [Google Scholar]
- 3.Barty A, et al. Self-terminating diffraction gates femtosecond X-ray nanocrystallography measurements. Nat Photonics. 2012;6(1):35–40. doi: 10.1038/nphoton.2011.297. [DOI] [PMC free article] [PubMed] [Google Scholar]
- 4.Owen RL, Rudiño-Piñera E, Garman EF. Experimental determination of the radiation dose limit for cryocooled protein crystals. Proc Natl Acad Sci USA. 2006;103(13):4912–4917. doi: 10.1073/pnas.0600973103. [DOI] [PMC free article] [PubMed] [Google Scholar]
- 5.Holton JM, Frankel KA. The minimum crystal size needed for a complete diffraction data set. Acta Crystallogr D Biol Crystallogr. 2010;66(Pt 4):393–408. doi: 10.1107/S0907444910007262. [DOI] [PMC free article] [PubMed] [Google Scholar]
- 6.Alonso-Mori R, et al. Energy-dispersive X-ray emission spectroscopy using an X-ray free-electron laser in a shot-by-shot mode. Proc Natl Acad Sci USA. 2012;109(47):19103–19107. doi: 10.1073/pnas.1211384109. [DOI] [PMC free article] [PubMed] [Google Scholar]
- 7.Peters JW, Lanzilotta WN, Lemon BJ, Seefeldt LC. X-ray crystal structure of the Fe-only hydrogenase (CpI) from Clostridium pasteurianum to 1.8 angstrom resolution. Science. 1998;282(5395):1853–1858. doi: 10.1126/science.282.5395.1853. [DOI] [PubMed] [Google Scholar]
- 8.Yano J, et al. X-ray damage to the Mn4Ca complex in single crystals of photosystem II: A case study for metalloprotein crystallography. Proc Natl Acad Sci USA. 2005;102(34):12047–12052. doi: 10.1073/pnas.0505207102. [DOI] [PMC free article] [PubMed] [Google Scholar]
- 9.Corbett MC, et al. Photoreduction of the active site of the metalloprotein putidaredoxin by synchrotron radiation. Acta Crystallogr D Biol Crystallogr. 2007;63(Pt 9):951–960. doi: 10.1107/S0907444907035160. [DOI] [PubMed] [Google Scholar]
- 10.Meharenna YT, Doukov T, Li H, Soltis SM, Poulos TL. Crystallographic and single-crystal spectral analysis of the peroxidase ferryl intermediate. Biochemistry. 2010;49(14):2984–2986. doi: 10.1021/bi100238r. [DOI] [PMC free article] [PubMed] [Google Scholar]
- 11.Davis KM, Kosheleva I, Henning RW, Seidler GT, Pushkar Y. Kinetic modeling of the X-ray-induced damage to a metalloprotein. J Phys Chem B. 2013;117(31):9161–9169. doi: 10.1021/jp403654n. [DOI] [PMC free article] [PubMed] [Google Scholar]
- 12.Kim Y-J, Hill JP, Kim J, Casa D. Hard X-ray resonant inelastic X-ray scattering at the advanced photon source. Synchrotron Radiat News. 2012;25(4):3–8. [Google Scholar]
- 13.Schmerge JF, et al. SSRL performance enhancements. 11th International Conference on Synchrotron Radiation Instrumentation (Sri 2012) J Phys Conf Ser. 2013;425(2013):042011. [Google Scholar]
- 14.Chapman HN, et al. Femtosecond X-ray protein nanocrystallography. Nature. 2011;470(7332):73–77. doi: 10.1038/nature09750. [DOI] [PMC free article] [PubMed] [Google Scholar]
- 15.DePonte DP, et al. Gas dynamic virtual nozzle for generation of microscopic droplet streams. J Phys D Appl Phys. 2008;41(19):195505. [Google Scholar]
- 16.Boutet S, et al. High-resolution protein structure determination by serial femtosecond crystallography. Science. 2012;337(6092):362–364. doi: 10.1126/science.1217737. [DOI] [PMC free article] [PubMed] [Google Scholar]
- 17.Redecke L, et al. Natively inhibited Trypanosoma brucei cathepsin B structure determined by using an X-ray laser. Science. 2013;339(6116):227–230. doi: 10.1126/science.1229663. [DOI] [PMC free article] [PubMed] [Google Scholar]
- 18.Stevenson HP, et al. Use of transmission electron microscopy to identify nanocrystals of challenging protein targets. Proc Natl Acad Sci USA. 2014;111(23):8470–8475. doi: 10.1073/pnas.1400240111. [DOI] [PMC free article] [PubMed] [Google Scholar]
- 19.Johansson LC, et al. Lipidic phase membrane protein serial femtosecond crystallography. Nat Methods. 2012;9(3):263–265. doi: 10.1038/nmeth.1867. [DOI] [PMC free article] [PubMed] [Google Scholar]
- 20.Barends TR, et al. De novo protein crystal structure determination from X-ray free-electron laser data. Nature. 2014;505(7482):244–247. doi: 10.1038/nature12773. [DOI] [PubMed] [Google Scholar]
- 21.Sierra RG, et al. Nanoflow electrospinning serial femtosecond crystallography. Acta Crystallogr D Biol Crystallogr. 2012;68(Pt 11):1584–1587. doi: 10.1107/S0907444912038152. [DOI] [PMC free article] [PubMed] [Google Scholar]
- 22.Liu W, et al. Serial femtosecond crystallography of G protein-coupled receptors. Science. 2013;342(6165):1521–1524. doi: 10.1126/science.1244142. [DOI] [PMC free article] [PubMed] [Google Scholar]
- 23.Fraser JS, et al. Accessing protein conformational ensembles using room-temperature X-ray crystallography. Proc Natl Acad Sci USA. 2011;108(39):16247–16252. doi: 10.1073/pnas.1111325108. [DOI] [PMC free article] [PubMed] [Google Scholar]
- 24.Stevenson HP, et al. Transmission electron microscopy as a tool for nanocrystal characterization pre- and post-injector. Philos Trans R Soc Lond B Biol Sci. 2014;369(1647):20130322. doi: 10.1098/rstb.2013.0322. [DOI] [PMC free article] [PubMed] [Google Scholar]
- 25.Dhouib K, et al. Microfluidic chips for the crystallization of biomacromolecules by counter-diffusion and on-chip crystal X-ray analysis. Lab Chip. 2009;9(10):1412–1421. doi: 10.1039/b819362b. [DOI] [PubMed] [Google Scholar]
- 26.Zhu D, et al. A single-shot transmissive spectrometer for hard x-ray free electron lasers. Appl Phys Lett. 2012;101(3):034103. [Google Scholar]
- 27.Snigirev A, Kohn V, Snigireva I, Lengeler B. A compound refractive lens for focusing high-energy X-rays. Nature. 1996;384(6604):49–51. doi: 10.1364/ao.37.000653. [DOI] [PubMed] [Google Scholar]
- 28.Cohen AE, Ellis PJ, Miller MD, Deacon AM, Phizackerley RP. An automated system to mount cryo-cooled protein crystals on a synchrotron beam line, using compact sample cassettes and a small-scale robot. J Appl Cryst. 2002;35(6):720–726. doi: 10.1107/s0021889802016709. [DOI] [PMC free article] [PubMed] [Google Scholar]
- 29.McPhillips TM, et al. Blu-ice and the distributed control system: Software for data acquisition and instrument control at macromolecular crystallography beamlines. J Synchrotron Radiat. 2002;9(Pt 6):401–406. doi: 10.1107/s0909049502015170. [DOI] [PubMed] [Google Scholar]
- 30.Hattne J, et al. Accurate macromolecular structures using minimal measurements from X-ray free-electron lasers. Nat Methods. 2014;11(5):545–548. doi: 10.1038/nmeth.2887. [DOI] [PMC free article] [PubMed] [Google Scholar]
- 31.Ring AM, et al. Adrenaline-activated structure of β2-adrenoceptor stabilized by an engineered nanobody. Nature. 2013;502(7472):575–579. doi: 10.1038/nature12572. [DOI] [PMC free article] [PubMed] [Google Scholar]
- 32.Nave C, Hill MA. Will reduced radiation damage occur with very small crystals? J Synchrotron Radiat. 2005;12(Pt 3):299–303. doi: 10.1107/S0909049505003274. [DOI] [PubMed] [Google Scholar]
- 33.Kabsch W. XDS. Acta Crystallogr D Biol Crystallogr. 2010;66(Pt 2):125–132. doi: 10.1107/S0907444909047337. [DOI] [PMC free article] [PubMed] [Google Scholar]
- 34.Leslie AGW, Powell HR, Read RJ, Sussman JL. Processing diffraction data with MOSFLM. In: Read RJ, Sussman JL, editors. Evolving Methods for Macromolecular Crystallography. Vol 245. Springer; New York: 2007. pp. 41–51. [Google Scholar]
- 35.Evans P. Scaling and assessment of data quality. Acta Crystallogr D Biol Crystallogr. 2006;62(Pt 1):72–82. doi: 10.1107/S0907444905036693. [DOI] [PubMed] [Google Scholar]
- 36.Hirata K, et al. Determination of damage-free crystal structure of an X-ray-sensitive protein using an XFEL. Nat Methods. 2014;11(7):734–736. doi: 10.1038/nmeth.2962. [DOI] [PubMed] [Google Scholar]
- 37.Hart P, et al. 2012. The CSPAD megapixel x-ray camera at LCLS. X-ray free-electron lasers: Beam diagnostics, beamline instrumentation, and applications. Proc SPIE 8504:85040C.
- 38.Anonymous 2013. IPAC2013: Proceedings of the 4th International Particle Accelerator Conference. Available at accelconf.web.cern.ch/AccelConf/IPAC2013/. Accessed August 1, 2014.
Associated Data
This section collects any data citations, data availability statements, or supplementary materials included in this article.