

Abstract
What is the organization of cerebral microvascular oxygenation and morphology that allows adequate tissue oxygenation at different activity levels? We address this question in the mouse cerebral cortex using microscopic imaging of intravascular O2 partial pressure and blood flow combined with numerical modeling. Here we show that parenchymal arterioles are responsible for 50% of the extracted O2 at baseline activity and the majority of the remaining O2 exchange takes place within the first few capillary branches. Most capillaries release little O2 at baseline acting as an O2 reserve that is recruited during increased neuronal activity or decreased blood flow. Our results challenge the common perception that capillaries are the major site of O2 delivery to cerebral tissue. The understanding of oxygenation distribution along arterio-capillary paths may have profound implications for the interpretation of BOLD fMRI signal and for evaluating microvascular O2 delivery capacity to support cerebral tissue in disease.
INTRODUCTION
A unique and highly specialized vascular network supports the metabolic needs of the cerebral cortex – a computationally advanced and energetically demanding part of the brain responsible for our higher cognitive functions. Since the cortex relies almost exclusively on oxidative metabolism of glucose,1 an uninterrupted supply of oxygen to the brain tissue is likely one of the key requirements that defines the structural organization of the cerebrovascular network and blood flow control. The global architecture of the blood supply to the cortex consists of a planar mesh of pial arteries and veins that dive into the cortex supplying the complex microvascular network and draining the blood back to the surface. However, in spite of extensive efforts in brain2-4 and in other organs,5-10 the detailed intravascular oxygen distribution along the microvascular paths that connect pial arteries and veins remains largely unknown.11 Therefore, we have limited knowledge about the mechanisms that secure sufficient oxygen delivery in microvascular domains during brain activation, and provide some metabolic reserve capacity in diseases that affect either microvascular networks or the regulation of cerebral blood flow (CBF). Such information is therefore critical for our understanding of not only normal brain physiology, but also the relation between progression of microvascular dysfunction and neurodegeneration in various brain diseases,12 and for attempts to develop a quantitative interpretation of existing and emerging brain imaging modalities.13-15
Until recently the limited knowledge about cortical microvascular oxygen distribution was largely due to a lack of imaging tools for high-resolution deep imaging of cortical oxygenation. To address this challenge, we developed and applied a multi-modal microscopy imaging setup based on “Two-Photon PO2 Microscopy” – a recently developed technology that can provide maps of oxygen partial pressure (PO2) with sub-capillary resolution in cortical arterioles, capillaries, venules, and tissue.16-19 We used Two-Photon Microscopy to measure PO2 in a large subset of arterioles, venules, and capillaries at different levels of CBF, and to obtain microvascular morphology. We also incorporated in the multimodal imaging setup a Doppler Optical Coherence Tomography (Doppler OCT) imaging setup,20 which was exploited to acquire CBF in penetrating arterioles and surfacing venules in order to confirm either induced changes in CBF or maintenance of stable CBF during PO2 measurements. The measurements were combined with a detailed analysis of the microvascular morphology and with computation of oxygen delivery from an anatomical vascular model under different levels of oxygen metabolism in order to address two basic questions related to cerebral microvascular oxygenation distribution under baseline conditions and during blood flow and metabolic perturbations: We asked “how much oxygen is extracted from cortical arterioles?” to examine the conventional notion that capillaries are the dominant sites of oxygen delivery to brain tissue under baseline conditions. We also asked “how is oxygen distributed along the arteriolar and capillary paths at different levels of CBF and tissue oxygen metabolism?” The results of these inquires reveal the way in which the three-dimensional cortical microcirculation ensures tissue oxygenation during baseline conditions, as well as the dynamic shift of oxygen extraction along the arterio-capillary path that ensures a safe margin of cerebral tissue oxygenation during metabolic and blood flow perturbations.
We have found that arterioles are responsible for 50% of the extracted O2 at baseline activity. Most of the remaining O2 exchange is taking place at the level of the first few capillary branches after precapillary arterioles, while majority of the capillaries (those of higher branching orders) on average release little O2 at rest. Our measurements and modeling results support this finding showing that high branching order capillaries may act as a dynamic O2 reserve that is recruited on demand to ensure adequate tissue oxygenation during increased neuronal activity or decreased blood flow. Our results challenge the common perception that O2 is almost exclusively released from the capillaries and provide a novel understanding of the distribution and dynamics of O2 extraction along the capillary paths in the cortex.
RESULTS
Microvascular oxygenation at normal and elevated CBF
We applied Two-Photon PO2 Microscopy to obtain high-resolution PO2 maps in microvascular segments in primary somatosensory (SI) cortex down to a cortical depth of 450 μm through a sealed cranial window in mice under isoflurane anesthesia. Two data sets were obtained representing baseline microvascular oxygenation at normal and elevated CBF (Fig. 1). In the first group of animals (n = 3), mice were maintained within the normal range of physiological parameters (i.e. normoxic normocapnia). In the second group of animals (n = 3) CBF was globally elevated by maintaining mild hypercapnia (systemic arterial PCO2 = 45 – 51 mmHg) via inhalation of ~5% CO2. Elevation of the blood flow (~30% increase) during hypercapnia was confirmed by using Doppler OCT images of CBF coregistered with the Two-Photon Microscopy (TPM) data (Supplementary Fig. 1). Microvascular structure was mapped by TPM at the end of experiments. Based on structural images, the microvasculature was segmented, a mathematical graph-representation of the microvascular tree was computed, and arterioles, venules, and capillaries were labeled (Fig. 1b,d). Intravascular PO2 measurements during normocapnia and hypercapnia were subsequently overlaid on the structural microvascular images for further analysis (Fig. 1c,e). As expected, an increase in CBF in the absence of a significant change in the cerebral metabolic rate of oxygen consumption (CMRO2) during hypercapnia led to significant increase in the intravascular PO2 (compare Fig. 1c to Fig. 1e).
Figure 1. Imaging setup and representative images of the microvascular structures and oxygenation.

(a) Multi-modal microscopy setup. Two-Photon Microscope (TPM) and Spectral Domain OCT are coupled into the same microscope objective (MO). D1 and D2 – dichroic mirrors; EOM – electro-optic modulator; TPM and OCT scanners – galvanometer-mirror-based scanners together with the scan and tube lenses. (b, d) Top views of the two cortical microvascular stacks with the labeled microvascular segments: arterioles (red), capillaries (green), and venules (blue). (c, e) PO2 measurements during normocapnia (c) and hypercapnia (e) overlaid over microvascular structures presented in b and d, respectively. Black squares in b and d represent PO2 measurement fields of view presented in c and e, respectively. In gray-colored vessels PO2 was not estimated. Scale bars, 200 μm.
Arterioles deliver significant oxygen to the cortical tissue
Our measurements provided two types of evidence that oxygen is readily extracted from the cortical arterioles at baseline conditions: 1) Dense cross-sectional PO2 maps inside the diving cortical arterioles during normocapnia revealed pronounced PO2 gradients from the vessel centers to the vessel walls (Fig. 2), indicating oxygen supply to the tissue from the arterioles (for simulation results supporting this observation please see Supplementary Fig. 2). This is consistent with previously documented significant tissue PO2 gradients3,16,18 and a marked absence of capillaries in the vicinity of penetrating arterioles.21 2) Our measurements along diving arterioles and their branches showed that oxygenation rapidly decreased as blood moved downstream along the arteriolar tree (Fig. 3). PO2 in normocapnia started from above 100 mmHg (SO2 ≈ 0.95) in larger pial arterioles with diameter ≥40 μm and decayed to ≈65 mmHg (SO2 ≈ 0.73) in the smallest arterioles with diameters below 10 μm, with a decay rate that increased rapidly with decreasing vessel diameter. The mean PO2 from all precapillary arterioles – arteriolar segments immediately proximal to the capillaries – was 66 mmHg (SO2 = 0.78), indicating ΔSO2 = 0.17 from the arteriolar segments during normocapnia. This represents 50% of the SO2 difference between large pial arterioles and venules with diameters ≥40 μm (ΔSO2,A-V = 0.33). A similar observation can be made by examining the PO2 and SO2 variation with microvascular segment branching order and distance along the microvascular paths with respect to the pial vessels (Supplementary Fig. 3).
Figure 2. PO2 distribution measured inside the penetrating arterioles during normocapnia.
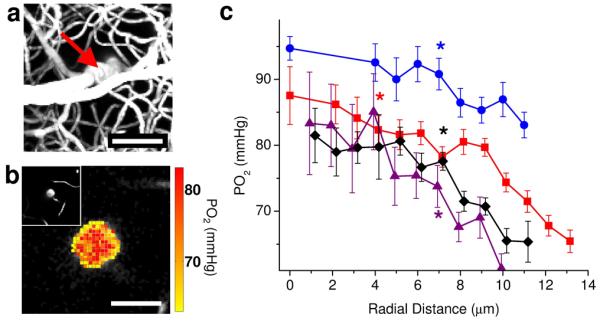
(a) Maximum intensity projection of the microvascular structure obtained by TPM showing diving arteriole at the center (red arrow). Scale bar, 50 μm. (b) PO2 map inside the penetrating arteriole in a, 100 μm below the cortical surface. Scale bar, 20 μm. Insert in the upper left hand side of the panel b shows a two-dimensional image from a microvascular stack (a) at the PO2 imaging depth (100 μm below the cortical surface). (c) Radial intra-arteriolar PO2 profiles (radial distance calculated from the vessel axis (vessel center) to the vessel wall) from 4 penetrating arterioles similar to the example vessel presented in a and b. For each PO2 profile, a star indicates the smallest radius where the mean PO2 is significantly lower than the PO2 at the vessel center (two-sample t-test; P <= 0.034). Data are expressed as mean ± s.e.m., calculated as detailed in the methods. Results are presented for n = 3 mice.
Figure 3. Oxygen content in arterioles and venules as a function of vessel diameter.

(a, b) Intravascular PO2 and SO2, respectively, as a function of arteriolar and venular diameters during normocapnia (solid symbols) and hypercapnia (empty symbols). Inverted triangle symbols represent mean values in precapillary arterioles. All mean PO2 and SO2 during hypercapnia experiments are statistically larger than mean PO2 and SO2 during normocapnia (Student t-test, P < 0.04, pairwise comparison for diameters < 25 μm and between combined measurements for diameters > 25 μm). Data are expressed as mean ± s.e.m. and were estimated averaging over all vessels over all animals. There were n = 3 mice for each group.
An interesting trend of mean PO2 and SO2 increase with increasing venular diameter was observed (Fig. 3), regardless of the exclusion of the pial venules (Supplementary Fig. 4). Further in the Results and in the Discussion sections we provide an explanation for this observation and the impact it has on interpreting results from various imaging modalities.
Finally, during hypercapnia we measured a decrease in oxygen extraction fraction (OEF) from the microvasculature. OEF during hypercapnia was 26% (ΔSO2,A-V = 0.25) in comparison with OEF = 35% (ΔSO2,A-V = 33%) during normocapnia. The decrease in OEF was paralleled by a measured ~30% increase in CBF, confirming the expected negligible change in CMRO2. However, under hypercapnia arteriolar oxygen delivery caused only a 0.08 decrease in SO2 (32% of ΔSO2,A-V), in comparison with 0.17 decrease in SO2 (50% of ΔSO2,A-V) during normocapnia, indicating a significantly increased fractional contribution of capillaries to the oxygen delivery (68% of ΔSO2,A-V) during elevated blood flow compared to ~50% during normocapnia.
Capillary oxygenation adapts to CBF and CMRO2 perturbations
To address oxygen extraction of capillaries of different branching orders, we analyzed the capillary morphology in segmented microvascular networks. This analysis revealed that in the investigated cortical area, the capillary paths between precapillary arterioles and postcapillary venules consisted of, on average, 6 capillary segments (capillary sections between two consecutive bifurcation points) with a total pathlength of ~340 μm. There was a good agreement between capillary PO2 measurements at branching orders 2, 3, 4, 5, and 6 going downstream from the precapillary arterioles and capillary PO2 measurements at branching orders 5, 4, 3, 2, and 1 going upstream from the postcapillary venules, respectively (Supplementary Fig. 5). This confirmed that PO2 measurements in the first 6 capillary segments following precapillary arterioles (Fig. 4) accurately represented the PO2 distribution along the entire capillary path from precapillary arterioles to postcapillary venules.
Figure 4. Number of capillary segments and capillary oxygen content as a function of branching order and distance from the precapillary arterioles.

(a, b) Histograms of the capillary segment number. (c-f) PO2 and SO2 inside the capillary segments. Solid and empty symbols in c-f represent measurements during normocapnia and hypercapnia, respectively. Average PO2 and SO2 values in precapillary arterioles (purple triangle symbols) were plotted inside the shaded regions on the left hand side of the graphs. At each branching order and distance from precapillary arteriole, mean PO2 and SO2 during hypercapnia experiments are statistically larger than mean PO2 and SO2 during normocapnia (Student t-test, P<0.006). Data are expressed as mean ± s.e.m. and were estimated averaging over all vessels over all animals. n = 6 mice were used for (a) and (b) and n = 3 mice were used for each group in (c-f).
Two important observations can be made from the mean arteriolar and capillary PO2 and SO2 distribution measurements (Figs. 3 and 4): 1) the average capillary segment PO2 and SO2 profile along the capillary path at baseline was strongly nonlinear (Fig. 4c-f). PO2 and SO2 intravascular longitudinal gradients (i.e. the rate of PO2 and SO2 decrease along the microvascular segments) in precapillary arterioles and along the first 2-3 capillary segments after precapillary arterioles (i.e. low branching order capillaries) were significantly higher than the PO2 and SO2 gradients along capillaries closer to venules (i.e. high branching order capillaries). This suggests that under baseline conditions precapillary arterioles and low branching order capillaries release on average much more oxygen to the tissue than high branching order capillaries; 2) An increase in CBF during hypercapnia demonstrated that while the highly oxygenated arterioles can only modestly increase SO2 (ΔSO2 = 0.11 in precapillary arterioles), capillaries have the ability to dramatically increase SO2 (up to ΔSO2 = 0.30 in high branching order capillaries) and possibly their contribution to tissue oxygen supply during functional hyperemia. The following analysis, which is based on these measurements in combination with numerical simulations of oxygen delivery in realistic microvascular anatomical networks, reveals a novel view of cortical oxygen supply in which the cerebral microcirculation keeps tissue oxygen concentration with a safe margin under baseline conditions as well as during increased metabolic demand or reduced blood flow.
We first asked the question: What governs oxygen distribution along the capillary path at baseline conditions? We hypothesized that the nonlinear average SO2 distribution along the capillary paths (Fig. 4) is largely due to greater tissue territories being supplied by low branching order, better oxygenated capillaries. To confirm this hypothesis we relied on measurements of microvascular morphology and oxygenation, as well as simulations of the blood flow in realistic microvascular networks. We started by considering a simple approximation for the SO2 change along a capillary segment: ΔSO2 ≈ CMRO2×L×R2t×Π / (CBF×4×CHb), where L is capillary segment length, Rt is the tissue radius, assuming that each vessel supplies an ideal tissue cylinder, and CHb is the hemoglobin concentration in blood. By using this equation and by starting from the SO2 in precapillary arterioles, the SO2 distribution along the capillary branches can be obtained by subsequently subtracting the ΔSO2 for consecutive capillary branching orders. We assumed that CMRO2 and CHb are constant and we used the measured capillary SO2 distribution at rest (Fig. 4e), the measured capillary segment length distribution (Supplementary Fig. 6), and the simulated capillary CBF distribution (Supplementary Fig. 6) and fit the above equation for the tissue radius Rt. We estimated an approximately linear Rt decrease from ~60 μm to ~10 μm for the capillary segments adjacent to precapillary arterioles and postcapillary venules, respectively (Supplementary Fig. 6), consistent with our hypothesis that more oxygenated low branching order capillaries release on average much more oxygen to the tissue than high branching order capillaries due to the greater size of their supplied tissue territories. It is interesting to note that the average capillary segment length L changes only slightly from 65.5 ± 6.2 μm for the low branching order capillaries to 81.4 ± 4.4 μm (mean ± s.e.m.) for the high branching order capillaries (Supplementary Fig. 6). Our measurements also revealed a remarkably uniform filling of space by the capillaries (Supplementary Figs. 6 and 7). If the tissue closest to each capillary segment is deformed into a cylinder, the computed average cylinder radius varies only between 24.2 ± 2.2 μm and 22.3 ± 1.2 μm (mean ± s.e.m.) for the low branching order and high branching order capillary segments, respectively. However, our results show that the tissue volumes supplied by the capillaries are not given by the shortest tissue distances to vessels. If they were, Rt would be approximately constant and independent from the capillary branching order. Further, the capillary SO2 distribution would be widely different from the observed SO2 trend (Fig. 4e) as it would be governed by the capillary blood flow distribution and exhibit a concave instead of the measured convex shape of SO2 versus branching order. Instead, the tissue territory supplied by the vessels with higher PO2 is greatly enlarged, overtaking the tissue territory surrounding less oxygenated vessels. Simple numerical analysis for realistic distances between capillaries (Supplementary Fig. 8) confirms that the tissue territory supplied by the more oxygenated vessel can grow to include the less oxygenated vessel.
After elucidating the role of precapillary arterioles and low and high branching order capillaries in baseline tissue oxygen supply, we further asked: “What governs oxygen distribution along the capillary path during CBF and CMRO2 perturbations?” In particular, it is critical to consider the responses to decreased CBF or increased CMRO2 – the changes in oxygen supply and consumption encountered during both pathological events and normal brain activation, which have the potential to compromise tissue oxygenation and brain function. Each of these changes, if they happen without significant changes in other physiological parameters, lead to increased OEF and consequently lowering the PO2 and SO2 in the microvascular segments, with the high branching order capillaries experiencing the largest decrease in oxygenation due to cumulative SO2 changes along the microvascular paths. Measurements of the oxygenation distribution along the capillary paths (Fig. 4c-f) revealed that lower CBF was associated with both larger SO2 longitudinal gradients in high branching order capillaries and their increased fractional contribution to the oxygen release to the tissue. In addition, a simple theoretical analysis shows that even when the oxygen sources (microvascular segments) are kept at constant PO2, an increase in CMRO2 leads to an enlargement of tissue territory supplied by the lower PO2 sources (Supplementary Fig. 8). Our simulations in realistic vascular anatomical networks (Supplementary Fig. 9) confirmed that an increase in CMRO2 leads to an increased fractional contribution of downstream capillaries to oxygen delivery and consequently to an increase in their supply territory (Fig. 5). Therefore, in response to the oxygen supply decrease and/or oxygen consumption increase, the less oxygenated high branching order capillaries may experience both an oxygenation decrease and an increase in supplied tissue territory – coordinated changes that may compromise tissue oxygenation. In experiments we observed very high heterogeneity of the capillary oxygenation (Fig. 6), which further emphasizes the importance of keeping the high average PO2 in high branching order capillaries at baseline conditions, since the tissue around capillaries with poorly oxygenated blood may be particularly vulnerable to an OEF increase. In this situation, under baseline conditions, keeping a high SO2 for high branching order capillaries and their longitudinal SO2 gradients low (i.e. reduced tissue territory supplied by them) may serve as an effective oxygen buffer – a reserve that can be exploited to keep tissue oxygenation in the most vulnerable microvascular domains above a critical level. In addition, we demonstrated the ability of the microvascular network to significantly increase oxygenation in the high branching order capillaries during a CBF increase (Fig. 4). This suggests that during functional hyperemia – i.e. a CBF increase in response to functional activation and elevated metabolism – a further adjustment of oxygen delivery is taking place that results in raising the oxygenation in high branching order capillaries to restore the pre-activation state and to preserve a safe margin of tissue oxygenation.
Figure 5. Influence of CMRO2 changes on capillary oxygen distribution.

Capillary PO2 (a) and SO2 (b) distributions simulated in realistic vascular anatomical network at different levels of CMRO2 and constant CBF. Mean PO2 and SO2 were calculated from the groups of capillaries with different branching order from precapillary arteriole. Data are expressed as mean ± s.e.m and were estimated over all vessels of n = 1 VAN.
Figure 6. Capillary PO2 and SO2 histograms.

Histograms of measured capillary PO2 (a) and SO2 (b) during normocapnia (solid bars) and hypercapnia (empty bars). There were n = 3 mice for each group.
Average SO2 underestimates microvascular oxygen content
Our observation of the venular PO2 increase with cortical vessel diameter (Fig. 3) is similar to observations of other groups in the past in different organs.7 Several hypotheses have been proposed to explain why mixed venous blood in larger caliber venules has higher oxygenation than capillaries and postcapillary venules: 1) the existence of vascular shunts that will bypass the capillary network and allow direct oxygen advection from arterioles to venules; 2) oxygen diffusion from tissue back to venules, when venules are either close to arterioles or in tissue regions where average PO2 is high; 3) blood oxygenation and flow in a complex microvascular network are highly heterogeneous and microvascular paths with higher blood flow have higher PO2 and SO2 due to the inverse relation between capillary flow and extraction efficacy. The last hypothesis of a positive correlation between flow and SO2 in microvascular paths implies that the mean SO2 of a population of microvascular segments is lower than the flow-weighted mean SO2 of the same segments because the segments with high SO2 (and high flow) account for a large fraction of the oxygen transported through all segments. Pial venous SO2, in turn, represents the summed contribution of flow-weighted SO2 from many individual microvascular paths, and is therefore always higher than the mean SO2 in the feeding capillaries and postcapillary venules.
Our and other groups’ analysis of microvascular morphology22 does not provide evidence of microvascular shunts in the cortex. On the other hand side, oxygen diffusion from the cortical tissue back to venules is taking place, at least sporadically, in the heterogeneously oxygenated cortex.19 Tissue PO2 may be higher on the cortical surface23 due to the influence of large pial arterioles and reduced cortical layer I metabolism. This could cause an increase in pial venular PO2. However, the results from this study confirm a steady PO2 increase in ascending venules below the cortical tissue (Supplementary Fig. 4), away from the influence of pial arterioles. In addition, the ascending venules in primary SI cortex are unlikely targets for sufficient oxygen diffusion from tissue to venules due to their already relatively high flow (i.e. short transient time) and reduced ratio of surface to volume. Moreover, our measurements of tissue PO2 in the forepaw area of primary SI cortex in rats demonstrate small but significant oxygen diffusion from ascending venules to tissue.18 While these data suggest that oxygen efflux from tissue into the venules is not the major cause of increasing PO2 in the venules, we believe that it is likely that efflux does occur in the high branching order capillaries where we have observed flat longitudinal PO2 gradients.
Finally, our results show that the discrepancy between SO2 in pial veins and SO2 in postcapillary venules and downstream capillaries can be largely explained by the difference between a mean SO2 and a flow-weighted mean SO2. Based on our measurements during normocapnia, average capillary path SO2 decreases significantly as the number of capillary segments between precapillary arteriole and postcapillary venule increases (Fig. 7). In the same capillary paths, our vascular anatomical network (VAN) modeling shows that average capillary path blood flow follows the same trend (Fig. 7), demonstrating that shorter capillary paths indeed have higher SO2 and blood flow on average. Such a characteristic SO2 and flow distribution in the microvasculature results in the mean SO2 in high branching order capillaries and postcapillary venules to always be lower than in pial veins. In our VAN modeling we observed up to a 15% discrepancy between the mean SO2 and flow-weighted mean SO2 in capillaries (Supplementary Figs. 6b and 10), suggesting that this effect alone may largely explain why mixed venous blood SO2 is higher than SO2 in postcapillary venules and high-branching order capillary segments.
Figure 7. Correlation between SO2 and blood flow along the capillary paths.
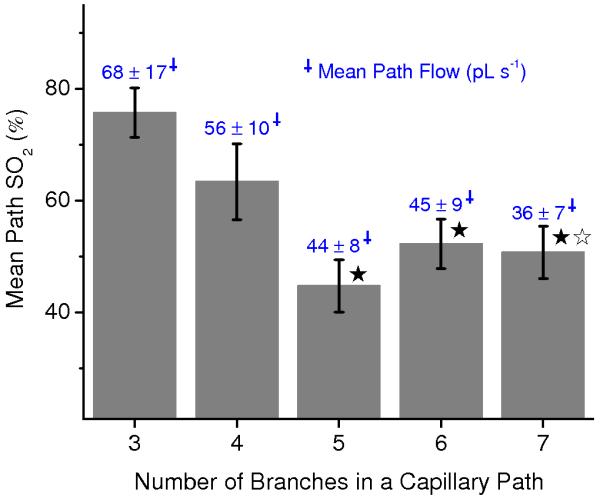
Dependence of the mean measured SO2 along the capillary path on a number of branches in a capillary path between precapillary arteriole and postcapillary venule. Simulated blood flow averaged along the same capillary paths is indicated above each bar (blue numbers). Star symbols indicate significant difference (Student’s t-test, P<0.05) when comparing to the results for 3 capillary branches (black asterisk – SO2; white asterisk – blood flow). Data are expressed as mean ± s.e.m. and were estimated averaging over all vessels over all animals. There were n = 3 mice.
DISCUSSION
We applied a set of novel imaging and analysis tools to assess microvascular oxygenation in mouse primary SI cortex. Until recently, most evidence about cerebral microvascular oxygen distribution was obtained by invasive polarographic microelectrode measurements in the upper several tens of micrometers of the cortex. Our combination of recently developed Two-Photon PO2 Microscopy with TPM imaging of microvascular morphology, Doppler OCT imaging of CBF, microvascular segmentation algorithms, and oxygen delivery modeling based on anatomically accurate microvascular structures, allowed us to obtain very detailed maps of microvascular oxygenation over a substantial depth of the mouse cortex, to quantify the contribution of different microvascular segments to oxygen release to the tissue, and to elucidate shifts in their oxygen delivery during flow and metabolic perturbations.
Our measurements suggest that, contrary to the conventional notion of capillaries being the only sites of oxygen exchange,24 cortical arterioles represent a significant source of oxygen extraction (~50%) to the tissue at baseline conditions. Precapillary arterioles and low branching order capillaries release most of the oxygen to the cortical tissue at baseline, while high branching order capillaries with their low resting longitudinal SO2 gradients and reduced supplied tissue territory act as an oxygen delivery buffer which can be utilized during oxygen consumption increase and blood flow decrease by increasing their delivery contribution to secure an adequate level of tissue oxygenation (Fig. 8).
Figure 8. Simplified representation of the cortical microvascular path, intravascular oxygenation, and supplied tissue territories.
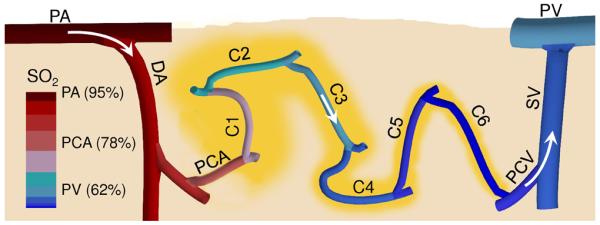
A vertical cross section through the cortical tissue revealing one microvascular path close to the cortical surface including pial arteriole (PA), diving arteriole (DA), precapillary arteriole (PCA), capillary path (C1-C6) with the low branching order capillaries (C1-C3) and high branching order capillaries (C4-C6), postcapillary venule (PCV), surfacing venule (SV), and pial venule (PV). Arrows represent the direction of the blood flow. Vascular segment colors represent approximate average segment SO2. Tissue territories supplied by capillary segments were outlined in yellow.
Cerebral microvascular oxygenation has been investigated for many decades (for a detailed review relevant to this work see Tsai et al.7). Arteriolar oxygen extraction in cat and rat cortex2-4 as well as in other tissues5 were indicated in the past. However, the notion of arteriolar oxygen loss has been questioned due to methodological limitations (e.g. limited accuracy of the polarographic electrode oxygen measurements, bias introduced by puncture of vascular walls with the electrode, oxygen consumption by the electrodes, and limited number of point measurements near the cortical surface in an open brain preparation) as well as a lack of understanding of the relations between microvascular morphology and the suggested novel view of arteriolar and capillary contribution to oxygen delivery. Some modeling efforts came to the conclusion that significant arteriolar oxygen delivery is present in the skeletal muscles,25 but without support from the detailed measurements of the microvascular oxygenation and without using the exact microvascular morphology. We believe that our extensive measurement data sets in combination with a detailed analysis of the microvascular morphology and modeling provide the comprehensive evidence for a revised understanding of the roles of cerebral arterioles and capillaries in oxygen delivery at rest and during metabolic and hemodynamic perturbations.
Understanding the different roles of arterioles, low and high branching order capillaries in oxygen supply, as well as the dynamic adjustments in the tissue territories that they supply, provides a new perspective on cortical microvascular network organization. The energetically demanding cerebral cortex has a large baseline CBF and low OEF, resulting in high intravascular PO2 that can drive oxygen delivery over increased tissue distances. Taking into account low tissue oxygen diffusivity and high CMRO2, increased cortical tissue distances from vessels in a complex capillary network with very heterogeneous flow and oxygenation (Fig. 6a) may be associated with a greater risk of creating hypoxic tissue islets, the existence of which may be highly undesirable in the brain even for a very brief period of time. Low oxygen delivery from the high branching order capillaries in comparison to precapillary arterioles and low branching order capillaries suggests that potentially a significant amount of oxygen diffuses from the tissue back into high branching order capillaries and that this may play a role as an oxygen “mixer’ which smoothens the roughness of the tissue oxygenation, reducing the risk of hypoxic tissue islets. This is consistent with previous findings of oxygen exchange between arterioles and capillaries in skeletal muscles.25,26 In addition, the large capacity of the microvascular network to increase SO2 in high branching order capillaries during hyperemia in combination with dynamic shifting of the tissue supply territories and increase in fractional contribution of high branching order capillaries to oxygen delivery during elevated CMRO2 or reduced CBF ensures that cortical tissue oxygenation is securely maintained in a dynamic brain environment.
Two observed characteristics of the capillary network – 1) a remarkably uniform tissue partitioning by the capillaries independent of the position along the capillary path (Supplementary Fig. 5a) and 2) that high branching order capillaries are not contributing much to oxygen delivery at baseline – are raising interesting questions about the signaling that defines the development of the capillary network. It has been shown by modeling that a very basic set of rules such as intense new microvessel sprouting due to tissue hypoxia induced VEGF production in combination with subsequent pruning based on mechanical stimuli and metabolic state can lead to the generation of a functional vascular network.8,27,28 Since high branching order capillaries are not contributing much to total oxygen release at baseline conditions, the average baseline state tissue oxygenation may not be responsible for their sprouting. It is possible that tissue oxygen fluctuations in a metabolically dynamic brain may generate sufficient VEGF to shape the morphology of the high branching order capillaries. In addition, the mechanical stimuli (e.g. vessel wall shear stress and intravascular pressure) may play an important role in their development as the highly interconnected capillary network achieves rebalancing of flow and asymptotic resistance over distances corresponding to only few capillary segments.22 Finally, the remarkably uniform tissue partitioning by the capillaries presents the possibility that their development is partially governed by tissue proximity to a source of glucose,29 which has a more uniform distribution along the microvasculature than oxygen, or by removal of the products of metabolism.
The reasons for a large CBF increase during functional hyperemia which causes lower OEF and higher capillary SO2 than in a resting state has been debated for many years.30 Some recent evidence13,18 suggests that the role of such a high CBF increase is to maintain PO2 at or above the baseline during sustained activation in tissue regions farther away from the microvasculature. The data we present here details two additional conditions in which a large CBF increase is needed to prevent compromising decreases in tissue PO2. First, capillary PO2 is highly heterogeneous and some capillary segments possibly always have low oxygenation at rest (Fig. 6), which potentially makes tissue in their proximity particularly vulnerable to a sustained increase in oxygen demand. Second, an increase in CMRO2 leads to an enlargement of supplied tissue territories around low-oxygenated capillaries, further exacerbating the problem of maintaining baseline tissue PO2. These statements may need further experimental confirmation since the capillary blood flow regulation during functional activation is multifactorial31,32 and potentially not all regulation mechanisms were involved in our steady-state measurements.
The three-dimensional seemingly spatially random structure of the capillary network seems to be important for enabling the close proximity of low and high branching order capillary segments such that their tissue supply territories can interact. In spite of the oxygen mixing in the high branching order capillaries due to both flow mixing and oxygen diffusion from tissue back to the capillary blood, capillary PO2 is very heterogeneous (Fig. 6a). This is likely a natural result of the complex capillary network. Moreover, in each data set we found a number of single capillaries as well as groups of connected capillaries (Fig. 1c) with fairly low PO2 (<15 mmHg). This may not mean that tissue PO2 is compromised around these capillary segments as critical tissue PO2 may only be a few mmHg.21,33,34 However, it opens the question whether the tissue pockets associated with these capillary domains of lower PO2 may be particularly vulnerable to pathological perturbations such as reduced CBF in stroke and brain trauma and/or alterations in the capillary morphology in microvasculopathies such as chronic hypertension, diabetes mellitus, and Alzheimer’s disease.12 Under pathological stress, these tissue domains may be the initial sites of cortical injury that can further exacerbate the progression of the disease.
We have found that average SO2 in capillaries and postcapillary venules is significantly lower than SO2 in large pial veins – an observation previously made in other tissues.7 By using both measurements and modeling we confirmed that this observation can be largely explained by the strong positive correlation between oxygenation and flow along the microvascular paths, such that flow-weighted mean SO2 is significantly higher than the mean SO2 of a population of the microvascular segments. This may be important to consider when assessing oxygen extraction in a number of established brain imaging modalities that are sensitive to hemoglobin concentration, such as functional Magnetic Resonance Imaging (fMRI) and Diffuse Optical Tomography (DOT), or emerging technologies such as Photoacoustic Tomography (PAT). Especially, care should be taken when interpreting the data from the parenchyma below the pial surface, where the discrepancy may be the largest. Further measurements and modeling may allow us to gain a detailed understanding of the discrepancy in the mean vs. flow-weighted mean SO2 measurements, to develop effective algorithms to correct for it, and to exploit it for development of novel imaging biomarkers. In addition, our detailed quantification of microvascular oxygen distribution at baseline and during elevated CBF as well as further measurements during functional activation may significantly influence BOLD-fMRI signal modeling and interpretation,13 and the development of novel MRI techniques for detailed quantitative oxygenation measurements in brain.14,15
METHODS
The multimodal microscopy imaging setup
We used a custom-built multi-modal microscope setup in this study (Fig. 1a). The microscope was constructed with a goal to image in vivo cerebral physiology in small rodents and it was designed as a combination of spectral domain Optical Coherence Tomography (OCT) and laser scanning Two-Photon Microscope (TPM). The optimal functioning of each component of the multi-modal setup (e.g. OCT and TPM) requires significantly different optical beam properties and scanning protocols. Therefore, to achieve maximal flexibility when designing the experiments and to take full advantage of each imaging modality, OCT and TPM modules were designed with separate scanning arms and their probing optical beams were coupled into the same microscope objective by a movable dichroic mirror. The details of the TPM and OCT designs can be found in Sakadzic et al.16 and Srinivasan et al.,20 respectively.
The TPM setup
The TPM optical beam was scanned in the x-y plane by galvanometer scanners (6215H, Cambridge Technology, Inc.). An electro-optic modulator (ConOptics, Inc.; extinction ratio ~500) served to gate the output of a Ti:Sapphire oscillator (840 nm, 80 MHz, 110 fs, Mai-Tai, Spectra-Physics). The pulse duration was ~350 fs (assuming a sech2 pulse shape), as measured at the sample. The emission was reflected by a dichroic mirror (LP 735 nm; Semrock) and detected with a large collection efficiency (~15 mm2 sr) by a detector array, consisting of four independent photomultiplier tubes (PMTs). The phosphorescence output was passed through a 680 ± 30 nm bandpass filter and forwarded to a photon-counting PMT module (H10770PA-50; Hamamatsu), whose output was acquired by a 50 MHz digital board (NI PCle-6537; National Instruments) and saved for later processing. To determine the phosphorescence lifetime, we fitted the phosphorescence intensity decay with a single-exponential function using the nonlinear least-squares method. The lifetime was converted to PO2 using the calibration plot obtained in independent oxygen titration experiments.17
The OCT setup
A superluminescent diode (model EX8705-2411, Exalos Inc.) with a center wavelength of 856 nm, bandwidth of 54 nm and a power of 5 mW was used as the light source. The axial (depth) resolution was approximately 6.4 μm in air (4.8 μm in tissue) after spectral shaping. The power on the sample was 1.5 mW, enabling a maximum sensitivity of 99 dB. A home-built spectrometer using a 2048 pixel, 12-bit line scan camera (Aviiva SM2 camera, e2v Semiconductors) enabled an imaging speed of 22,000 axial scans per second and an axial imaging range of 2.5 mm in air. The transverse resolution was 11 μm.
Two pairs of the galvanometer mirrors (Cambridge Technology, Inc.) were used to independently scan TPM and OCT beams (Fig. 1a). The galvanometer mirrors were relay imaged onto the back focal plane of a microscope objective (Olympus XLUMPLFL20XW/IR, 0.95 NA, water immersion, 2 mm working distance). The TMP and OCT optical beams were coupled into the microscope objective by a movable dichroic mirror. A motorized stage controlled the focal position by moving the objective along the vertical axis (Z). Both TPM and OCT systems were controlled by custom-designed software written in LabView (National Instruments).
Animal preparation
For imaging of PO2 in the microvasculature, C57BL/6 mice (male, 25-30 g, 10-12 weeks old) were anesthetized by isoflurane (1-2% in a mixture of O2 and air) and tracheotomized under constant temperature (37 °C). We then opened a 2.5-mm-wide cranial window over the primary somatosensory cortex with the center of the window in the parietal bone 2 mm posterior from the bregma and 2 mm lateral from midline, removed the dura, and sealed the window with a 150-μm-thick microscope coverslip. We used a catheter in the femoral artery to administer the dyes, to continuously monitor the blood pressure and heart rate, and to sample systemic blood gases (PCO2 and PO2) and pH. A capnometer (Micro-CapnoGraph CI240, Columbus Instruments) was used to continuously monitor end-tidal PCO2. A small metal bar was glued to the exposed animal skull and used to both hold the animal head steady under the microscope and adjust the tilt of the head such that the brain surface inside the imaging window is perpendicular to the microscope objective axis.
Animal experiments
Two groups of animals were used to perform the measurements under normocapnic and hypercapnic conditions. During the measurement period, the isoflurane anesthesia was reduced to 0.7 – 1.2%. The oxygen-sensitive dye (PtP-C343) was injected into the vasculature targeting 10-15 μM initial concentration in the blood. During the normocapnia experiments, mice were ventilated with a mixture of air and oxygen and the following physiological parameters were maintained: arterial PO2 = 130 ± 20 mmHg, arterial PCO2 = 37 ± 3 mmHg, and mean arterial blood pressure (MAP) = 80-100 mmHg. During the hypercapnia experiments, we added ~5% of CO2 to the mixture of air and oxygen to achieve arterial PCO2 = 48 ± 3 mmHg. When physiological parameters fell outside the specified ranges during the experiment, we rejected the whole experiment.
The experimental protocol for each animal consisted of ~10-min-long OCT imaging of CBF followed by the ~30-min-long TPM imaging of intravascular PO2 and an additional OCT imaging of CBF. The experiments were rejected if the blood flow was not maintained steady as indicated by the CBF change for more than 10% before and after PO2 measurement. At the end of each experiment we labeled the blood plasma with the fluorescein isothiocyanate (FITC) conjugated with dextran and used TPM to obtain the high-resolution structural image of the microvasculature inside a 725 × 725 μm wide and ~650 μm deep region of interest. We also obtained a larger image of the surface microvasculature (2 mm × 2 mm), which was later used for easier tracing of the pial arterioles and venules. We performed normocapnia and hypercapnia experiments on different animal groups due to the challenges of maintaining very stable anesthetized mouse physiology for a long time, which will be required to perform both measurements in the same animal. However, the measurement results within each animal group (i.e. normocapnic and hypercapnic animals) were highly reproducible with the well separated means between the groups, which abolished the need for the within-animal comparisons.
The details of the OCT scanning protocol for the imaging of CBF can be found in Srinivasan et al.20 For the TPM imaging of the intravascular PO2, we excited phosphorescence by trains of femtosecond pulses from a Ti:Sapphire oscillator, gated by an electro-optic modulator, and acquired decays by averaging multiple excitation cycles. Each cycle consisted of a 10-μs excitation gate, followed by 290-μs collection period. At each imaging plane we performed detection in two steps. First, we raster-scanned the excitation beam over the field of view, rendering two-dimensional survey maps of the integrated phosphorescence emission intensity (250 × 250 pixels, acquired in ~19 s), which revealed the position of the microvasculature in the plane. We then averaged ~2000 phosphorescence decays in selected locations in the vasculature for accurate PO2 determination, resulting in 0.6 s per single-point PO2 measurement. PO2 data was collected during 30-40 min at 400-500 locations in 30-50 μm separated planes up to the 450 μm depth. The high similarity of the TPM microvascular structural images of blood plasma labeled by FITC and based on phosphorescence survey scans allowed a simple co-registration of the PO2 measurements with the 3D microvascular stack.
All experimental procedures were approved by the Massachusetts General Hospital Subcommittee on Research Animal Care.
Microvascular segmentation and data co-registration
The segmentation of the microvasculature from the 3D FITC stacks obtained by TPM was performed by using a combination of the custom-written software for manual and semi-automatic graphing35 and publicly available VIDA software.36 After obtaining the mathematical graph-representation of the microvasculature, all microvascular segments (microvascular sections between two consecutive bifurcation points) were labeled as arterioles, venules, or capillaries (Fig. 1a,c). All arterioles and venules were labeled manually by following them from the pial surface into the cortical depth. After labeling the arterioles and venules, all remaining microvessels were labeled as capillaries and then individually visualized and inspected. The identification of the pial arterioles and venules was done based on their morphology and PO2 measurements, and confirmed by tracing them in the larger field of view TPM images (~2×2 mm) of the surface vasculature. Pial arterioles are straighter than pial veins, and they more gradually branch into smaller vessels. They can be easily distinguished from pial veins, which are curvier, thicker, and frequently sprouting smaller vessels of random calibers. Capillaries were typically identified starting one or two segments away from the diving arterioles and surfacing venules based on their morphology (i.e. smaller diameters and higher tortuosity).
We used the Floyd-Warshall algorithm37 to calculate the shortest distance by either branching order or pathlength along the vascular segments between any two vertices (end-points of the vascular segments) in a graph of segmented microvasculature. In addition, we computed the predecessor matrix which provides for each pair of graph vertices (m, n) an index of the vertice (k) that precedes vertice n along the shortest path between m and n. This information was used to simply determine all segments along the shortest path between each pair of vertices. We subsequently computed for each vascular segment its minimal branching order and minimal pathlength to the manually identified pial arterioles and venules. We also computed for each capillary segment its minimal branching order and minimal pathlength to the closest precapillary arteriole and postcapillary venule.
The co-registration of TPM and OCT data was performed by using the custom-written software in Matlab (MathWorks, Inc.). We manually identified numerous pairs of points in both 3D velocity projection map obtained by OCT and microvascular stack obtained by TPM, with each pair of points representing the same location in the microvasculature. Based on the selected pairs of points, the OCT velocity projection map and computed absolute flow in selected vascular segments were spatially transformed onto the TPM microvascular stack (Supplementary Fig. 1).
Numerical simulations
We utilized a vascular anatomical (VAN) model developed by Fang et al.35 and Gagnon et al.38 to compute the resting state flow and resting state oxygenation in both microvasculature and tissue in four microvascular stacks obtained in our normocapnia and hypercapnia experiments. We removed the capillary segments cut by the limits of the vascular stacks to obtain a closed graph between the pial arteries and veins and to reduce the number of places where the boundary conditions must be set.39 We fixed CBF in computations to obtain a perfusion of ~1 mL g−1 min−1 in our volumes – a value recently reported in mouse cortices under the same anesthesia.40,41 We also fixed PO2 in the pial arterioles to ~100 mmHg and tissue CMRO2 to ~2.3 μmol O2 g−1 min−1 in order to obtain a reasonable match between computed and measured intravascular oxygen distributions. The oxygen advection was run with constant inputs until steady-state was achieved (typically after 15 sec in model time). To avoid the artifacts due to the vascular stack boundaries, only the computed variables from the central region of the microvascular stacks (up to 100 μm inside from the lateral sides and from the upper 450 μm of each stack) were used in statistical analyses.
PO2 fitting and calculation of SO2
In all measurements, we compared the phosphorescence survey scans taken immediately before and after PO2 point measurements in each plane and inspected collected phosphorescence decays for signs of sudden intensity or decay slope change during acquisition, which could indicate motion artifact during the measurement. To determine the phosphorescence lifetime, we fitted the phosphorescence intensity decay with a single-exponential function using the nonlinear least-squares method. The lifetime was converted to PO2 using the calibration plot obtained in independent oxygen titration experiments.17 The standard deviation of the PO2 measurement generally increased with PO2 up to 4 mmHg at high PO2 values. We rejected PO2 measurements with a relative standard error greater than 15%. PO2 inside the capillaries was estimated in the blood plasma adjacent to the red blood cells (RBCs), following the procedure outlined in Parpaleix et al.42 We subsequently computed the SO2 based on the Hill equation, with Hill coefficients specific for C57BL/6 mice (h = 2.59 and P50 = 40.2 mmHg).43
Statistical analysis of the capillary branching orders and pathlengths
Based on mathematical graph-representation of the microvasculature in 6 microvascular stacks, we first identified vascular segment vertices that separate arteriolar and capillary segments. We subsequently computed for each capillary segment its minimal branching order and minimal distance along the capillary path to the closest precapillary arteriole and postcapillary venule, taking into account only microvascular paths without arteriolar and venular segments. In addition, in order to minimize the effect of incomplete capillary paths due to a finite size of microvascular stacks, we considered only the capillary segments 100 μm away from the lateral boundaries of the field of view and up to 450 μm deep from the cortical surface. The findings about capillary branching orders and pathlengths based only on microvascular morphology were further confirmed by following the capillary paths along the downstream blood flow computed by VAN modeling in four realistic microvascular networks.
Estimation of the intra-arteriolar radial PO2 profiles
Intra-arteriolar measurements were performed in three mice (normoxic normocapnia), in 4 diving arterioles, 50-150 μm below the cortical surface. The PO2 inside the vessel cross section was measured in a dense rectangular grid (Fig. 2b). Typically more than 200 PO2 measurements were obtained. Starting from the center of the vessel, measurements from 1-μm-thick rings were grouped and used to calculate the mean PO2 and standard error at different radial distances from the vessel center (Fig. 2c). Starting from the center of each measured arteriole, measurements from 3-μm-thick rings were grouped and Student t-test was performed to find a minimal radius with the mean PO2 significantly lower (α=0.05) than PO2 at the vessel center.
Construction of composite images
We color-coded the vascular segments in composite images (Fig. 1) by assigning a mean measured PO2 value in that segment to the whole vessel segment between two branching points. In addition, to allow more complete visualization of the oxygenation in the vascular tree when creating the composite images, for segments that did not have a measurement but joined at both ends with segments that had measurements within 100 μm, we assigned the average PO2 value of the connecting segments.
Supplementary Material
ACKNOWLEDGMENTS
We would like to thank Sergei A. Vinogradov and Emmanouil Rousakis for providing the oxygen-sensitive dye and for their help with the PO2 imaging. We would also like to thank a support from the American Heart Association (grant SDG7600037) and from the National Institute of Health (grants EB000790, NS055104, NS057476, and K99AG042026).
Footnotes
COMPETING FINANCIAL INTEREST
The authors declare no competing financial interests.
AUTHOR CONTRIBUTIONS
SS and DAB designed the study with input from AD, CA, ETM, MA Yaseen, VJS, EHL, AMD, and KEH; SS analyzed the data and wrote the manuscript with help from DB and all other authors; SS, ETM, and KEH performed the experiments; SS, MA Yaseen, and VJS built the microscope; LG, SS and DAB performed the numerical simulations; JJM, SS, LG, MA Yucel, JL, and FL carried out segmentation of the microvascular stacks.
REFERENCES
- 1.Attwell D, Laughlin SB. An energy budget for signaling in the grey matter of the brain. J. Cereb. Blood Flow Metab. 2001;21:1133–1145. doi: 10.1097/00004647-200110000-00001. [DOI] [PubMed] [Google Scholar]
- 2.Duling B, Kuschinsky W, Wahl M. Measurements of the Perivascular PO2 in the Vicinity of the Pial Vessels. Pflugers Arch.-Eur. J. Physiol. 1979;383:29–34. doi: 10.1007/BF00584471. [DOI] [PubMed] [Google Scholar]
- 3.Vovenko E. Distribution of oxygen tension on the surface of arterioles, capillaries and venules of brain cortex and in tissue in normoxia: an experimental study on rats. Pflugers Arch.-Eur. J. Physiol. 1999;437:617–623. doi: 10.1007/s004240050825. [DOI] [PubMed] [Google Scholar]
- 4.Vazquez AL, Masamoto K, Fukuda M, Kim S-G. Cerebral Oxygen Delivery and Consumption During Evoked Neural Activity. Front. Neuroenergetics. 2010;2:11. doi: 10.3389/fnene.2010.00011. [DOI] [PMC free article] [PubMed] [Google Scholar]
- 5.Duling BR, Berne RM. Longitudinal Gradients in Periarteriolar Oxygen Tension A Possible Mechanism For the Participation of Oxygen in Local Regulation of Blood Flow. Circ. Res. 1970;27:669–678. doi: 10.1161/01.res.27.5.669. [DOI] [PubMed] [Google Scholar]
- 6.Krogh A. The supply of oxygen to the tissues and the regulation of the capillary circulation. J. Physiol.-Lond. 1919;52:457–474. doi: 10.1113/jphysiol.1919.sp001844. [DOI] [PMC free article] [PubMed] [Google Scholar]
- 7.Tsai AG, Johnson PC, Intaglietta M. Oxygen gradients in the microcirculation. Physiol. Rev. 2003;83:933–963. doi: 10.1152/physrev.00034.2002. [DOI] [PubMed] [Google Scholar]
- 8.Secomb TW, Alberding JP, Hsu R, Dewhirst MW, Pries AR. Angiogenesis: An Adaptive Dynamic Biological Patterning Problem. PLoS Comput. Biol. 2013;9:e1002983. doi: 10.1371/journal.pcbi.1002983. [DOI] [PMC free article] [PubMed] [Google Scholar]
- 9.Pittman R. Oxygen Transport and Exchange in the Microcirculation. Microcirculation. 2005;12:59–70. doi: 10.1080/10739680590895064. [DOI] [PubMed] [Google Scholar]
- 10.Popel A. Theory of Oxygen-Transport to Tissue. Crit. Rev. Biomed. Eng. 1989;17:257–321. [PMC free article] [PubMed] [Google Scholar]
- 11.Goldman D. Theoretical Models of Microvascular Oxygen Transport to Tissue. Microcirculation. 2008;15:795–811. doi: 10.1080/10739680801938289. [DOI] [PMC free article] [PubMed] [Google Scholar]
- 12.Zlokovic BV. Neurovascular pathways to neurodegeneration in Alzheimer’s disease and other disorders. Nat. Rev. Neurosci. 2011;12:723–738. doi: 10.1038/nrn3114. [DOI] [PMC free article] [PubMed] [Google Scholar]
- 13.Buxton RB. Interpreting oxygenation-based neuroimaging signals: the importance and the challenge of understanding brain oxygen metabolism. Front. Neuroenergetics. 2010;2:8. doi: 10.3389/fnene.2010.00008. [DOI] [PMC free article] [PubMed] [Google Scholar]
- 14.Bolar DS, Rosen BR, Sorensen AG, Adalsteinsson E. QUantitative Imaging of eXtraction of Oxygen and TIssue Consumption (QUIXOTIC) Using Venular-Targeted Velocity-Selective Spin Labeling. Magn. Reson. Med. 2011;66:1550–1562. doi: 10.1002/mrm.22946. [DOI] [PMC free article] [PubMed] [Google Scholar]
- 15.Ma D, et al. Magnetic resonance fingerprinting. Nature. 2013;495:187–192. doi: 10.1038/nature11971. [DOI] [PMC free article] [PubMed] [Google Scholar]
- 16.Sakadzic S, et al. Two-photon high-resolution measurement of partial pressure of oxygen in cerebral vasculature and tissue. Nat. Methods. 2010;7:755–U125. doi: 10.1038/nmeth.1490. [DOI] [PMC free article] [PubMed] [Google Scholar]
- 17.Finikova OS, et al. Oxygen microscopy by two-photon-excited phosphorescence. Chemphyschem. 2008;9:1673–1679. doi: 10.1002/cphc.200800296. [DOI] [PMC free article] [PubMed] [Google Scholar]
- 18.Devor A, et al. ‘Overshoot’ of O2 Is Required to Maintain Baseline Tissue Oxygenation at Locations Distal to Blood Vessels. J. Neurosci. 2011;31:13676–13681. doi: 10.1523/JNEUROSCI.1968-11.2011. [DOI] [PMC free article] [PubMed] [Google Scholar]
- 19.Lecoq J, et al. Simultaneous two-photon imaging of oxygen and blood flow in deep cerebral vessels. Nat. Med. 2011;17:893–U262. doi: 10.1038/nm.2394. [DOI] [PMC free article] [PubMed] [Google Scholar]
- 20.Srinivasan VJ, et al. Quantitative cerebral blood flow with Optical Coherence Tomography. Opt. Express. 2010;18:2477–2494. doi: 10.1364/OE.18.002477. [DOI] [PMC free article] [PubMed] [Google Scholar]
- 21.Kasischke KA, et al. Two-photon NADH imaging exposes boundaries of oxygen diffusion in cortical vascular supply regions. J. Cereb. Blood Flow Metab. 2011;31:68–81. doi: 10.1038/jcbfm.2010.158. [DOI] [PMC free article] [PubMed] [Google Scholar]
- 22.Blinder P, et al. The cortical angiome: an interconnected vascular network with noncolumnar patterns of blood flow. Nat. Neurosci. 2013;16:889–897. doi: 10.1038/nn.3426. [DOI] [PMC free article] [PubMed] [Google Scholar]
- 23.Masamoto K, Kurachi T, Takizawa N, Kobayashi H, Tanishita K. Successive depth variations in microvascular distribution of rat somatosensory cortex. Brain Res. 2004;995:66–75. doi: 10.1016/j.brainres.2003.09.055. [DOI] [PubMed] [Google Scholar]
- 24.Hall JE. Guyton and Hall Textbook of Medical Physiology. Saunders; 2010. [Google Scholar]
- 25.Secomb TW, Hsu R. Simulation of O2 transport in skeletal muscle: diffusive exchange between arterioles and capillaries. Am. J. Physiol.-Heart Circ. Physiol. 1994;267:H1214–H1221. doi: 10.1152/ajpheart.1994.267.3.H1214. [DOI] [PubMed] [Google Scholar]
- 26.Ellsworth M, Pittman R. Arterioles Supply Oxygen to Capillaries by Diffusion as Well as by Convection. Am. J. Physiol. 1990;258:H1240–H1243. doi: 10.1152/ajpheart.1990.258.4.H1240. [DOI] [PubMed] [Google Scholar]
- 27.Munn LL, Kunert C, Tyrrell JA. In: Math. Methods Models Biomed. Ledzewicz U, Schättler H, Friedman A, Kashdan E, editors. Springer; 2012. pp. 117–148. [Google Scholar]
- 28.Pries AR, Secomb TW. Compr. Physiol. John Wiley & Sons, Inc.; 2011. pp. 3–36. [Google Scholar]
- 29.Paulson OB, Hasselbalch SG, Rostrup E, Knudsen GM, Pelligrino D. Cerebral blood flow response to functional activation. J. Cereb. Blood Flow Metab. 2010;30:2–14. doi: 10.1038/jcbfm.2009.188. [DOI] [PMC free article] [PubMed] [Google Scholar]
- 30.Fox P, Raichle M. Focal Physiological Uncoupling of Cerebral Blood-Flow and Oxidative-Metabolism During Somatosensory Stimulation in Human-Subjects. Proc. Natl. Acad. Sci. U. S. A. 1986;83:1140–1144. doi: 10.1073/pnas.83.4.1140. [DOI] [PMC free article] [PubMed] [Google Scholar]
- 31.Hall CN, et al. Capillary pericytes regulate cerebral blood flow in health and disease. Nature. 2014;508:55–60. doi: 10.1038/nature13165. [DOI] [PMC free article] [PubMed] [Google Scholar]
- 32.Jespersen SN, Ostergaard L. The roles of cerebral blood flow, capillary transit time heterogeneity, and oxygen tension in brain oxygenation and metabolism. J. Cereb. Blood Flow Metab. 2012;32:264–277. doi: 10.1038/jcbfm.2011.153. [DOI] [PMC free article] [PubMed] [Google Scholar]
- 33.Chance B. Cellular Oxygen Requirements. Fed. Proc. 1957;16:671–680. [PubMed] [Google Scholar]
- 34.Wilson DF, Harrison DK, Vinogradov SA. Oxygen, pH, and mitochondrial oxidative phosphorylation. J. Appl. Physiol. 2012;113:1838–1845. doi: 10.1152/japplphysiol.01160.2012. [DOI] [PubMed] [Google Scholar]
- 35.Fang Q, et al. Oxygen advection and diffusion in a three- dimensional vascular anatomical network. Opt. Express. 2008;16:17530–17541. doi: 10.1364/oe.16.17530. [DOI] [PMC free article] [PubMed] [Google Scholar]
- 36.Tsai PS, et al. Correlations of Neuronal and Microvascular Densities in Murine Cortex Revealed by Direct Counting and Colocalization of Nuclei and Vessels. J. Neurosci. 2009;29:14553–14570. doi: 10.1523/JNEUROSCI.3287-09.2009. [DOI] [PMC free article] [PubMed] [Google Scholar]
- 37.Floyd R. Algorithm-97 – Shortest Path. Commun. Acm. 1962;5:345–345. [Google Scholar]
- 38.Gagnon L, et al. Biomed. Opt. 2014. Optical Society of America; 2014. Underpinning the microvascular origin of BOLD-fMRI with two-photon microscopy. BT4A.1. doi:10.1364/BIOMED.2014.BT4A.1. [Google Scholar]
- 39.Lorthois S, Cassot F, Lauwers F. Simulation study of brain blood flow regulation by intra-cortical arterioles in an anatomically accurate large human vascular network: Part I: Methodology and baseline flow. Neuroimage. 2011;54:1031–1042. doi: 10.1016/j.neuroimage.2010.09.032. [DOI] [PubMed] [Google Scholar]
- 40.Wehrl HF, et al. Simultaneous assessment of Perfusion with [15O] water PET and arterial spin labeling MR using a hybrid PET/MR device. Proc Intl Soc Mag Reson Med. 2010;18:715. [Google Scholar]
- 41.Zheng B, Lee PTH, Golay X. High-sensitivity cerebral perfusion mapping in mice by kbGRASE-FAIR at 9.4 T. NMR Biomed. 2010;23:1061–1070. doi: 10.1002/nbm.1533. [DOI] [PubMed] [Google Scholar]
- 42.Parpaleix A, Houssen YG, Charpak S. Imaging local neuronal activity by monitoring PO2 transients in capillaries. Nat. Med. 2013;19:241–246. doi: 10.1038/nm.3059. [DOI] [PubMed] [Google Scholar]
- 43.Uchida K, Reilly MP, Asakura T. Molecular stability and function of mouse hemoglobins. Zoolog. Sci. 1998;15:703–706. [Google Scholar]
Associated Data
This section collects any data citations, data availability statements, or supplementary materials included in this article.