Abstract
Precise shaping of the eye is crucial for proper vision. Here, we use experiments on chick embryos along with computational models to examine the mechanical factors involved in the formation of the optic vesicles (OVs), which grow outward from the forebrain of the early embryo. First, mechanical dissections were used to remove the surface ectoderm (SE), a membrane that contacts the outer surfaces of the OVs. Principal components analysis of OV shapes suggests that the SE exerts asymmetric loads that cause the OVs to flatten and shear caudally during the earliest stages of eye development and later to bend in the caudal and dorsal directions. These deformations cause the initially spherical OVs to become pear-shaped. Exposure to the myosin II inhibitor blebbistatin reduced these effects, suggesting that cytoskeletal contraction controls OV shape by regulating tension in the SE. To test the physical plausibility of these interpretations, we developed 2-D finite-element models for frontal and transverse cross-sections of the forebrain, including frictionless contact between the SE and OVs. With geometric data used to specify differential growth in the OVs, these models were used to simulate each experiment (control, SE removed, no contraction). For each case, the predicted shape of the OV agrees reasonably well with experiments. The results of this study indicate that differential growth in the OV and external pressure exerted by the SE are suffcient to cause the global changes in OV shape observed during the earliest stages of eye development.
Keywords: eye development, finite-element model, growth
Introduction
In the vertebrate embryo, the primitive eyes initially develop as bilateral bulges that grow outward from the part of the prosencephalon (forebrain) that later becomes the ventral diencephalon. As these optic vesicles (OVs) elongate, they come into contact with the surrounding surface ectoderm (SE), and both layers then invaginate to create the optic cup (prospective retina) and lens vesicle (Martinez-Morales and Wittbrodt, 2009). The initial shaping of the OVs sets the stage for these later events.
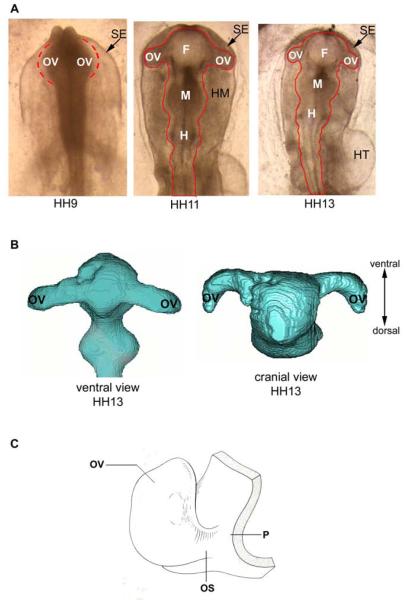
This paper deals with the mechanics of OV morphogenesis in the chick embryo before the onset of invagination. At Hamburger-Hamilton (HH) stage 9 (30 h of a 21-day incubation period) (Hamburger and Hamilton, 1951), the OVs are relatively spherical (Fig. 1A). By HH13 (50 h), they become pear shaped and bend toward the caudal and dorsal sides of the embryo (Fig. 1B,C). The open connection to the forebrain forms the optic stalk, which later becomes the optic nerve.
Figure 1.
Eye development in early chicken embryo. (A) Embryos at stages HH9, HH11, and HH13. Major subdivisions of the brain include three vesicles: forebrain (F), midbrain (M), and hindbrain (H). The optic vesicles (OV) grow as protrusions from the forebrain. The brain is surrounded by head mesenchyme (head mesencyme) and surface ectoderm (SE). HT = heart tube (dorsal view). (B) 3-D reconstruction of anterior part of HH13 brain lumen obtained from OCT images (ventral and cranial views) (courtesy Ben Filas). Note prominent dorsal bending of OVs in the cranial view. (C) Schematic diagram of optic vesicle (OV) at stage HH13. Reprinted from Schook (1980). OS = optic stalk; P = prosencephalon (forebrain).
Recent studies in fish have shown that cells are added to the OVs during evagination through both cell division and migration from the prosencephalon, with migration playing the greater role (Kwan et al., 2012; Rembold et al., 2006). Although further study is needed, some evidence suggests that cells move similarly in chick OVs (Kwan et al., 2012). Regardless of the specific mechanism, it appears that addition of new cells to the OVs drives evagination, rather than, for example, active changes in cell shape. In addition, Hilfer et al. (1981) speculated that OV shape is influenced by external constraints on its expansion, but this idea apparently has heretofore not been confirmed.
Here, we examine the hypothesis that OV morphogenesis is driven by differential growth constrained by contact with the SE. First, we use mechanical and chemical perturbations to determine how the SE affects OV shape. Then, we develop computational models to simulate the growing OV with and without the SE. The results indicate that a combination of differential growth in the OV and external pressure exerted by the SE are sufficient to cause the global changes in OV shape observed during early eye development.
2 Methods
2.1 Embryo preparation
Fertilized white Leghorn chicken eggs were incubated in a humidified, forced draft incubator at 37 °C for 33–52 hours to yield embryos between HH stages 9 and 13 (Hamburger and Hamilton, 1951). Whole embryos were removed from the eggs using a filter paper method (Voronov and Taber, 2002). To preserve the stresses normally present in the tissue, the embryo and underlying vitelline membrane were kept intact. Each embryo was then placed in a 35 mm culture dish, completely submerged under a thin layer of liquid culture media, and incubated at 37° C in 95% O2 and 5% CO2. This method prevents artifacts caused by fluid surface tension, which alter the mechanical stresses in the embryo (Voronov and Taber, 2002).
2.2 Perturbations
To determine the effects of the SE on OV shape, the SE was dissected from the OV in the region of contact. At early stages (HH9–10), there is not yet significant adherence between the OV and SE, and we were able to perform the dissection using microscissors and thin glass needles after first removing the vitelline membrane for access. As a control, embryos cultured with only the vitelline membrane removed appeared to develop normally. To loosen the relatively strong adherence at later stages (HH13), we first applied 2% Nile Blue sulphate. After a few seconds, the surface ectoderm blistered and could be easily removed (Araujo et al., 1998; Hyer et al., 2003). To inhibit diffusion of Nile Blue during topical application, the embryo was temporarily placed in albumen before being transferred to culture media for subsequent incubation.
In selected experiments, cytoskeletal contraction was suppressed by culturing embryos in the dark in media containing blebbistatin (bleb, 50 μM), which is a nonmuscle myosin II inhibitor.
2.3 Optical Coherence Tomography (OCT)
Cross-sectional images of living embryos were acquired using a Thorlabs (Newton, NJ) OCT system coupled to a Nikon FN1 microscope. Image stacks were acquired at approximately 10 μm resolution in a 3×3 mm scanning window. Subsequent image analysis (including image cropping, contrast optimization, and noise filtering) was performed using Volocity software (PerkinElmer, Inc.) and ImageJ. Three-dimensional volumes were generated automatically by cropping surrounding tissue and thresholding the inner cavity of the brain tube.
2.4 Shape Analysis
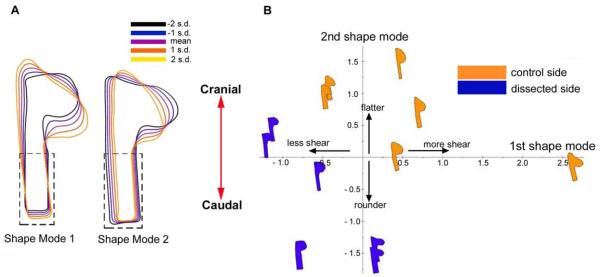
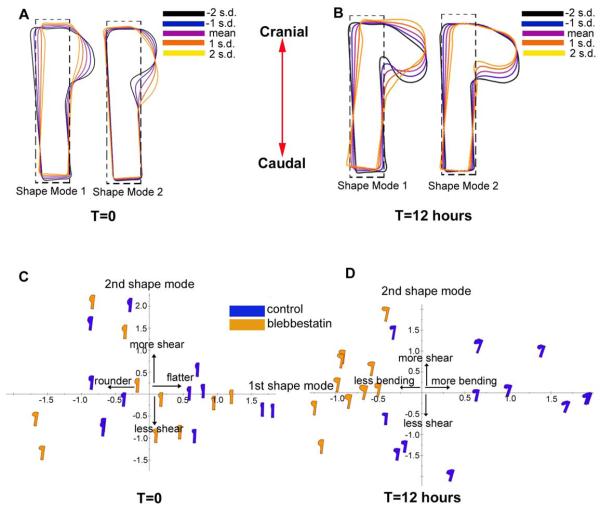
To analyze tissue shape, the OVs and forebrain were manually outlined using ImageJ, and tracings were filled and converted to binary files. We then used the open source software Celltool (Pincus and Theriot, 2007) to quantitatively analyze shapes from contours extracted from the binary images. This software performs a principal components analysis (PCA) on aligned 2-D contours to generate and statistically compare shape mode distributions. To minimize rigid-body rotation, a rectangle of equal size was added to each image prior to analysis (see Figs. 5A and 6A,B).
Figure 5.
Principal components analysis of effects of SE on OV morphology (HH10, dorsal view). To minimize spurious rotations, a rectangular region was added to the forebrain (dashed line). (A) Shape modes for OV at HH9–10 (n = 6). The first shape mode (caudal shearing) and second shape mode (compression) describe 29.2% and 18.2% of the total variance in the data, respectively. Colors indicate mean (purple) and standard deviations (s.d.). (B) Shape-space distribution. Dissected and control sides are separated along modes 1 and 2, indicating that the OVs became less sheared and compressed immediately after removing the SE.
Figure 6.
Principal components analysis of effects of contraction on OV morphology (dorsal view). Blebbistatin (50 μM) was used to inhibit cytoskeleton contraction. (A) Shape modes for forebrain at HH9–10 before culture (n = 11). The first shape mode (compression) and second shape mode (caudal shearing) describe 55.5% and 31.7% of the total variance in the data, respectively. Colors indicate mean (purple) and standard deviations (s.d.). To minimize spurious rotations, a rectangular region was added to the OV (dashed line). (B) Same embryos after 12 hours of culture (all embryos; control, n = 6; treated, n = 5). The first shape mode (caudal bending) and second shape mode (caudal shear) describe 66.1% and 19.2% of the total variance in the data, respectively. (C) Shape-space distribution before culture. The samples are randomly distributed along modes 1 and 2 (media or media + bleb), indicating no significant difference between control and treated embryos at the beginning of the experiment. (D) Shape-space distribution after 12 hours of culture. Control and bleb-treated samples are separated along mode 1, indicating that contraction caused more bending. Lack of separation along mode 2 indicates little effect on shear.
2.5 Computational Modeling
Model Geometry and Boundary Conditions
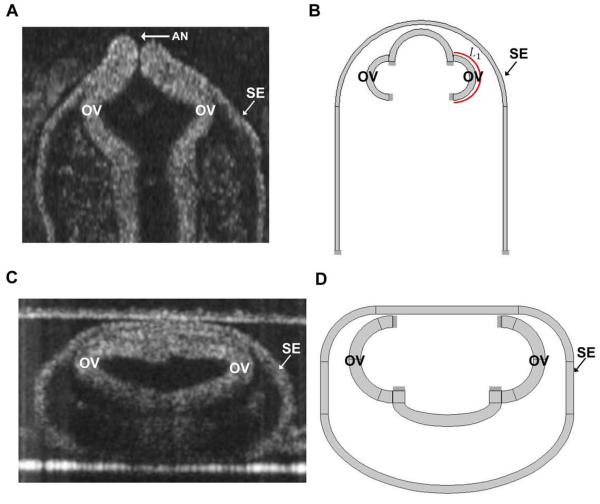
To study the mechanics of OV morphogenesis, we created finite-element models using the software COMSOL Multiphysics (version 4.3a). As a first approximation, the models are 2-D (plane strain) and represent frontal and transverse cross sections of the forebrain containing the OVs (Fig. 2). Since morphology varies somewhat between embryos at the same stage of development, representative parameters defining the reference geometry at stage HH9 were obtained from OCT images like those shown in Fig. 2. In each model, morphogenesis is simulated for half the embryo with appropriate symmetry conditions enforced. We ignore the localized effects of the anterior neuropore (see Fig. 2A), an opening at the tip of the forebrain that closes by HH11.
Figure 2.
Cross sections and model geometry for forebrain of HH9 chick embryo. (A) OCT section of frontal plane. (B) Frontal-plane model. L1 = circumferential length of OV (C) OCT section of transverse plane. (D) Transverse-plane model. The SE and OVs are fixed at their ends. OV = optic vesicle; SE = surface ectoderm; AN = anterior neuropore.
Each model consists of an OV, part of the brain tube, and a membrane representing the SE. Frictionless contact is enforced between these structures using an augmented Lagrangian approach to solve for the contact pressure. Otherwise, all boundaries are free except for the OV-brain junction and the end of the SE, which are taken as fixed. The calculations include both geometric and material nonlinearities for large pseudoelastic deformation.
The logic behind fixing the OV at the junction with the brain stems from using a 2-D model to represent a 3-D structure. In 3-D, the entire circumference at the OV base is attached to the side of the brain tube, which would constrain radial motion of the base. To a first approximation, therefore, the base of the OV is taken as fixed in both the frontal and transverse planes.
Growth, Contraction, and Material Properties
The morphogenetic processes of growth and active contraction were simulated using the theory for finite volumetric growth of Rodriguez et al. (1994). In this theory, active contraction is simulated as negative growth (Taber, 2009). The total deformation gradient tensor is written as
| (1) |
where G is the growth tensor and F* is the elastic deformation gradient tensor relative to the current zero-stress state. During growth, G defines the zero-stress configuration for each infinitesimal material element and F* enforces compatibility between these elements. Methods for implementing this theory in an earlier version of COMSOL are described in Taber (2008). Later versions of COMSOL (4.x) require some modifications, which are described in the appendix.
As in previous studies, the material properties of the early brain tube are assumed to be approximately isotropic and nearly incompressible (Filas et al., 2012; Xu et al., 2010a). Because stress is associated only with elastic deformation, the constitutive relation for a compressible pseudoelastic material can be written in the form (Taber, 2004)
| (2) |
where W(C*) is the strain-energy density function, C* = F*T · F* is the right Cauchy-Green deformation tensor relative to the current zero-stress state, and J* = det F* is the volume ratio (Taber, 2004). Here, we take
| (3) |
where the strain invariants are defined as . In addition, μ and ν represent the shear modulus and Poisson’s ratio, respectively, in the limit of small strain (Taber, 2004). For near incompressibility (ν → 0.5), this form for W is essentially equivalent to the modified neo-Hookean form suggested by the experiments of Xu et al. (2010b), who used microindentation to measure the material properties of embryonic chick brains at HH11–13. Although computed stresses (not studied here) may be slightly different, we have found that predicted shapes, which are of paramount importance in morphogenesis, are relatively insensitive to the specific form used for W (Shi et al., 2014).
The morphological behavior of the model depends on relative differences in stiffness and growth between the OV and SE, not on their numerical values. Stiffness of a shell or membrane depends on the wall thickness (d) and modulus (μ). From measurements of OCT images (e.g., Fig. 2), we take dOV /dSE = 1.5, and since mechanical properties of the SE have not yet been measured, we assume μSE = μOV and νSE = νOV = 0.45. As confirmed numerically, specific values for μ would affect only stress, which is not considered here.
For convenience, the brain tube is divided into sections (Fig. 2B,D) with the growth tensor specified as a function of time in each section. The walls of the brain tube and OVs are epithelia consisting of a single layer of columnar cells. In both models, we assume that the OVs grow primarily in the tangential direction and take the (2-D) growth tensor in the form
| (4) |
where Gt is a function of space and time, with et and en being unit vectors tangent and normal to the OV in the reference configuration.
The frontal-plane model was discretized into 1782 triangular elements. (Numerical accuracy was confirmed by running models with finer meshes.) Because of a lack of available data, we assume that OV growth is uniform in this model and increases linearly with time during development. Moreover, since rate effects are not included, time t is normalized by culture time so that t = 0, 1 represent the beginning and end of an experiment, respectively. Thus, we take Gt = 1 + (Gf − 1)t, where Gf = Gt(1). Stages of development are defined by relative time increments based on morphological characteristics of the embryo (Hamburger and Hamilton, 1951). The value of Gf was approximated as the measured ratio of the final length (L2 at t = 1) to the initial length (L1 at t = 0) of the OV circumference in the frontal plane (see Figs. 8B and 2B).
Figure 8.
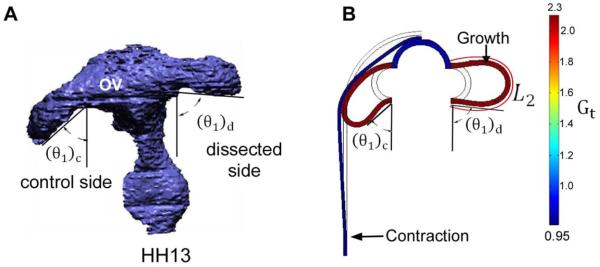
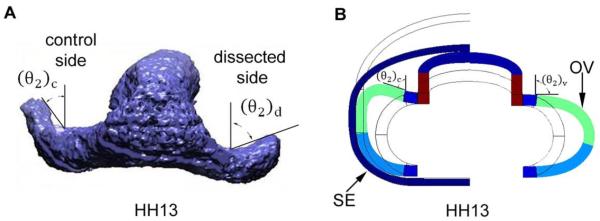
Computational model for effects of surface ectoderm (SE) on optic vesicle (OV) shape (ventral view). (A) 3-D reconstruction after dissection of SE from one OV (stage HH13). After removing SE, the OV angle θ1 increased relative to the control side. The caudal bending angle in this plane, defined as φ1 = 90 − θ1, decreased from 33 ± 8° on the control side to 5 ± 4° on the dissected side (n = 5). (B) Frontal-plane model at HH13 for control case (left side) and without SE (right side). Uniform tangential growth is specified in OV with isotropic contraction in SE. The bending angle is 42° on the control side and 8° on dissected side. L2 = circumferential length of OV.
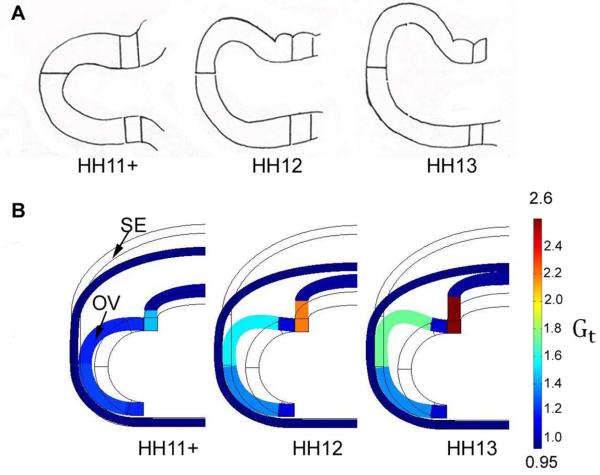
The transverse-plane model includes 5540 elements, and we used the measurements of Hilfer et al. (1981) to define the growth in different regions of the OV (Fig. 2D). These authors provided measurements of the circumferential lengths of the regions of the OV shown in Fig. 9A. In the model, we used HH11+ as a reference and divided the measured mean lengths at HH12 and HH13 by the corresponding values at HH11+ to obtain Gt for each region. The growth of the small part of the brain outside the OV was estimated from our OCT images at these stages. For each region, Gt is taken in the form given above for the frontal-plane model, with Gf (defined at HH13) varying between regions (see Fig. 9B).
Figure 9.
Computational model for OV morphogenesis (cranial view). Model includes regionally varying tangential growth in OV and uniform isotropic contraction in SE. (A) Schematic diagrams of OV shape at stages HH11+−13. Reprinted from Hilfer et al. (1981). (B) Transverse-plane model results for same stages with regional values of G determined from data provided in Hilfer et al. (1981).
Contraction in Surface Ectoderm
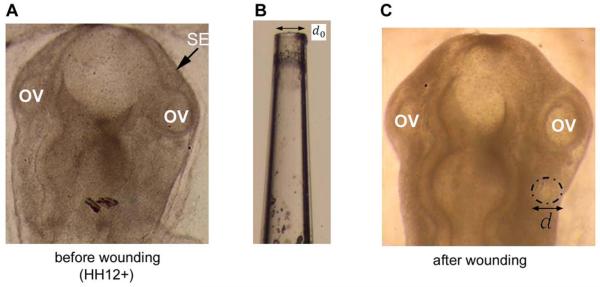
To determine the tensor G for contraction in the SE, we used a pulled glass micropipette to punch circular holes in this membrane (Fig. 3). The size and shape of the resulting hole immediately after wounding indicates the state of stress (Varner and Taber, 2010). Wounds larger than the pipette tip indicate tension, whereas ellipticity of the wound indicates stress anisotropy. In our experiments, wounds near the OVs were relatively circular and larger than the pipette tip at all stages, suggesting a general state of isotropic tension in the SE. Accordingly, we took G = Gxexex + Gyeyey in global Cartesian coordinates with Gx = Gy.
Figure 3.
Tension estimate in surface ectoderm (SE). (A) Dorsal view of HH12+ chicken embryo before wounding. OV=optic vesicle. (B) Glass needle used to make hole in surface ectoderm. Internal diameter is d0 = 90 μm. (C) Same embryo immediately after wounding SE. Dash-dot line outlines the wound, which is relatively circular with a diameter d larger than the pipette tip (d = 97 ± 3.0 μm, n = 8), indicating nearly isotropic tension.
The value of Gx was determined from the measured ratio of the diameter of the wound (d) to the inner diameter of the pipette (d0). For stages HH10, HH12+, and HH13, our measurements gave d/d0 = 1.05 (n = 11), d/d0 = 1.06 (n = 8), and d/d0 = 1.07 (n = 9), respectively (Fig. 3). Since the change is relatively independent of stage, we used the value 1.06 for all stages, corresponding to an isotropic in-plane stretch ratio of λ = 1.05 relative to the zero-stress state (Varner and Taber, 2010). Then, for isotropic contraction, Gx = Gy =1/λ =0.95.
To confirm the effects of bleb, we repeated these experiments on bleb-treated embryos. The value of λ was reduced as expected, although the effect was not statistically significant. Since the amount of contraction is relatively small in control embryos, our dissection method may not be sensitive enough to detect decreases in SE contractility.
3 Results
3.1 Normal Morphogenesis of Optic Vesicle
At stage HH9 (30 h), the OVs in the chick embryo are relatively spherical evaginations protruding from the lateral sides of the forebrain (Fig. 1A). Within a few hours, the elongating OVs become constricted at their bases to create the optic stalks. The distal ends of the OVs come into contact with the SE at about HH10 (33 h) and adhere tightly to the SE by HH11 (40 h) (Fig. 1A). By HH13 (50 h), the OVs bend caudally and dorsally and become pear shaped (Fig. 1B,C), and then the OV and SE layers invaginate in the region of contact to create the primitive retina (optic cup) and lens, respectively (Hyer et al., 2003). During these stages of development, the OVs are hollow shells with lumens that are continuous with the lumen of the brain tube. The current study focuses on OV development prior to invagination (HH9–13).
3.2 Effects of Surface Ectoderm on OV Shape
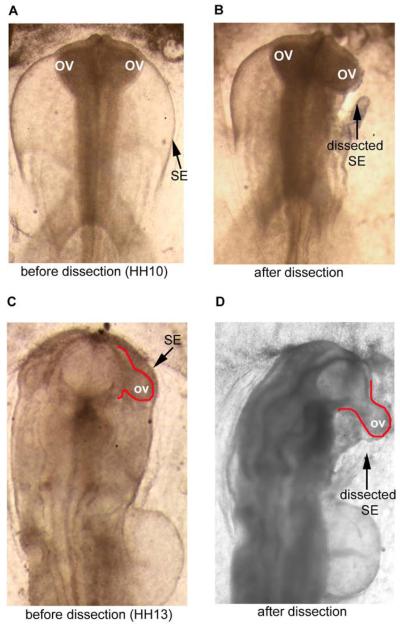
To determine how the SE affects the shape of the OV, we dissected the SE from one OV while leaving the SE intact over the other OV (for control). When the SE was removed at HH10, i.e., soon after the initial contact between these structures, the OV immediately became rounder (Fig. 4A,B).
Figure 4.
Effect of surface ectoderm (SE) on shape of optic vesicle (OV) (dorsal view). (A)-(B) HH10 embryo before and approximately 5–10 minutes after SE dissection. OV on dissected side becomes rounder than OV on intact side. (C-D) HH13 embryo before and after dissection. After SE is removed, the OV immediately pops out from forebrain.
PCA was used to compare OV shapes between the dissected and control sides. In the dorsal view, shape mode 1 corresponds mainly to a caudal shearing of the OV, whereas mode 2 captures compression by the SE (Fig. 5A). This result is reflected in shape space, where separation along modes 1 and 2 indicates that OVs on the control side were sheared and compressed more than those on the dissected side (Fig. 5B). Overlaying mean OV shapes for the dissected and control sides makes these effects more clear (see Fig. 7C).
Figure 7.
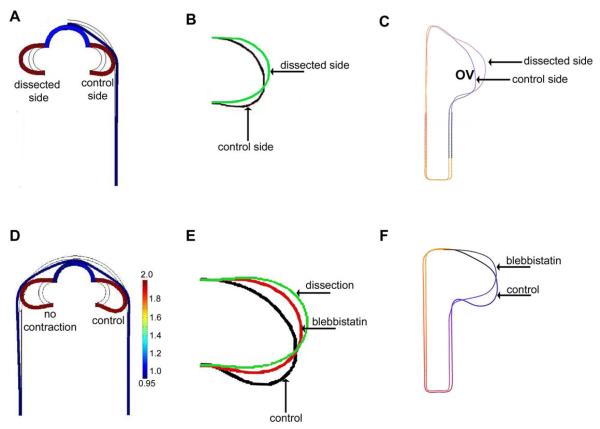
Comparison of experimental and model-predicted OV shapes (dorsal view). (A) Frontal-plane model at stage HH10 showing control OV (right side) and OV without SE (left side). (B) Direct comparison of OV shapes from model in (A). (C) Experimental mean OV shapes given by PCA for control and dissected sides (n = 6, see Fig. 5). As in the model, the OV is flatter and sheared with SE intact. (D) Frontal-plane model at stage HH12 for control case (right side) and with contraction turned off (left side). (E) Direct comparison of OV shapes from model in (D), along with dissected case from (B). (F) Experimental mean OV shapes given by PCA for control and bleb-exposed (contraction inhibited) embryos (n = 11, see Fig. 6). As in the model, the control OV undergoes more bending.
For later stage (HH13) embryos, the asymmetric geometry of the OV complicates matters somewhat. Here, rather than flattening the surface of the OV, the forces exerted by the SE mainly cause the optic stalk to bend in both the frontal and transverse planes (see Figs. 4C,D, 8A, and 10A). To quantify this deformation, we used a bending angle to characterize the amount of OV bending caused by the SE in each plane (Figs. 8A and 10A). The bending angle is defined as φi = 90° − θi, where θi is the OV angle relative to the centerline of the brain tube (i = 1 for frontal plane and i = 2 for transverse plane; see Figs. 8 and 10). After the SE was dissected, the bending angle decreased from 33 ± 8 ° to 5 ± 4 ° (n = 5) in the frontal plane and from 43 ± 7 ° to 14 ± 9 ° (n = 5) in the transverse plane.
Figure 10.
Computational model for effects of surface ectoderm (SE) on optic vesicle (OV) shape (cranial view). (A) 3-D reconstruction of HH13 brain after SE dissection on one side. The dorsal bending angle in the cranial plane, defined as φ2 = 90 − θ2, is 43 ± 7° for the control side and 14 ± 9° for the dissected side. (B) Transverse-plane model for forebrain at HH13 with and without SE (same model shown in figure 9). The bending angles are 50° for the control side and 2° for the dissected side.
3.3 Effects of Contraction on OV Shape
Cytoskeletal contraction is involved in numerous morphogenetic processes (Ettensohn, 1985; Filas et al., 2012; Martin, 2010). To explore the possible role of contraction in OV morphogenesis, we cultured HH9 embryos in bleb for 12 h and used PCA to compare OV shapes between bleb-treated and control embryos. For technical convenience, this analysis was done only on dorsal-view images acquired by light microscopy.
PCA was used to compare OV shapes between control and bleb-treated embryos at the beginning (T = 0) and end (T = 12 h) of the experiments. At T = 0, mode 1 corresponds to lateral compression, and mode 2 captures shear in the caudal direction (Fig. 6A). At T = 12 h, modes 1 and 2 correspond to caudal bending and shear, respectively (Fig. 6B). Shape space plots reveal a relatively random distribution of shape modes at T = 0 (Fig. 6C), suggesting that OV shapes were initially similar for both groups. At T = 12 h, however, bleb-treated OVs were less bent than controls, while shear deformation was similar (Fig. 6D). The difference in the amount of bending is clearly seen in the mean OV shapes at T = 12 h (see Fig. 7F). These results indicate that contraction causes considerable bending of the OV.
To examine the effects of bleb on OV growth, we measured the changes in circumferential length (L) and thickness (d) of the OV wall in control (n = 3) and bleb-treated (n = 4) embryos during culture for 7 h from HH9. The ratio of final to initial dimension was computed from OCT images. For d, the ratios were 1.07 ± 0.07 and 1.04 ± 0.06 in control and bleb-treated embryos, respectively. For L, the respective ratios were 1.46 ± 0.06 and 1.49 ± 0.09. These values were not statistically different (t-test), suggesting that exposure to bleb had relatively little effect on tissue growth.
Taken together, the results from our experiments suggest that the SE exerts off-axis compressive loads on the OVs that are generated by cytoskeletal contraction in the SE. We reasoned that contraction generates tension within the SE that is converted into a compressive load on the OVs through direct contact between these structures and the geometric effects of curvature. To explore the physical feasibility of this hypothesis, we used computational modeling.
3.4 Model Results
To test the feasibility of our hypothesis for the effects of the SE on OV shape, we used 2-D finite-element models (see Fig. 2B,D). The models are based on idealized geometry from frontal and transverse sections of the embryo and include growth in the OVs, contraction in the SE, and frictionless contact between these structures.
In the frontal-plane model, the OV is assumed to grow uniformly in the tangential direction. As discussed in the Methods section, the points of attachment to the forebrain are taken as fixed in this 2-D representation of a 3-D structure. Without the SE, the OV grows outward and becomes elliptical in shape (Figs. 7A,B and 8B). When the SE is present (control), the OV grows until it contacts and is compressed by the SE (Figs. 7A,B and 8B). This load also causes the OV to shear (Fig. 7B) and, as it grows longer, to bend (Fig. 8B) in the caudal direction. When contraction is turned off in the SE to simulate bleb exposure, the amount of bending at later stages is reduced (Fig. 7D,E). The model-predicted OV morphologies for all these cases are similar to the corresponding mean experimental OV shapes given by PCA (n = 6 for dissection experiment; n = 11 for contraction experiment) (Fig. 7C,F).
For SE dissection in HH13 embryos, the model-predicted value for the bending angle φ1 in the frontal plane on the control (intact) side is 42 °, which is similar to the experimental value of 33 ±8 ° (n = 5) (Fig. 8A,B). The predicted and experimental bending angles for the dissected side are 8 ° and 5 ± 4 ° (n = 5), respectively (Fig. 8A,B).
In the transverse-plane model, the brain tube and OV are divided into sections with tangential growth specified separately in each section according to the measurements of Hilfer et al. (1981) (see Methods section). Comparing the predicted shapes of the OV at various stages with corresponding sketches provided in Hilfer et al. (1981) reveals reasonably good agreement (Fig. 9). Our experimental results give a dorsal bending angle (φ2)of 43 ± 7 ° (n = 5) for the control side (SE intact) and 14 ±9 ° (n = 5) for the dissected side (SE removed) (Fig. 10). The bending angles given by the model are somewhat smaller, 25 ° for the control side and 0 ° for the dissected side (Fig. 10), perhaps because the experimental OVs continued to undergo viscoelastic deformation after load removal.
Taken together, these results generally support the physical plausibility of our hypothesis.
Discussion
The results of the present study suggest that OV shape in the early chick embryo is determined primarily by a combination of differential growth within the OV and constraints on lateral expansion imposed by the SE. In the frontal plane, the SE causes the OV to flatten, shear, and bend caudally. When the SE is removed, these deformations decrease immediately (see Figs. 4, 8A, and 10A). Regionally asymmetric growth in the transverse plane generates a slight dorsal curvature that is enhanced by SE forces, which cause the OV to undergo considerable dorsal bending. Although such a combination of forces has been proposed in the past (Hilfer et al., 1981), this study apparently represents the first test of this idea.
It now appears that the SE is a major factor throughout the early stages of eye development. In addition to creating the lens vesicle, the SE plays an important role in shaping the OV during evagination, the formation of the retinal placode (Huang et al., 2011), and the invagination that creates the optic cup (Hyer et al., 2003). These findings are consistent with recent studies in the development of other organs, where forces exerted by adjacent membranes are essential in bending and twisting of the heart and gut tubes (Savin et al., 2011; Taber, 2006). Hence, external loads may play a larger role in organogenesis than previously thought.
Studies have shown that both cell division and influx of cells contribute to OV growth during the period of evagination (Rembold et al., 2006), although the relative contributions may be species dependent. Evagination proceeds unimpeded when cell division is inhibited in fish and frogs, although the eyes are smaller than normal. However, the shape and organization of the eyes in these experiments are relatively normal in fish but abnormal in frogs (Harris and Hartenstein, 1991). Moreover, some data indicate that cell movements also occur in the chick OV, although these motions are less dramatic than those seen in fish (Kwan et al., 2012).
To a first approximation, we simulate the addition of cells to the OV, whether by cell migration or proliferation, as volumetric growth at the tissue scale. Although a detailed analysis of the effects of cell migration are likely important in fish (Kwan et al., 2012; Rembold et al., 2006), the evidence for significant migration in the chick embryo is less clear and warrants further study. To account for the motions of individual cells, models such as those used to study cell sorting and patterning (Brodland, 2002) are needed. In addition, the two-dimensional nature of our models limits the strength of our conclusions. Three-dimensional measurements of morphogenetic OV strains, as well as 3-D models of OV morphogenesis, would provide a more complete picture.
Our results do not rule out the participation of other mechanisms in early OV morphogenesis. For example, after the brain tube seals at HH11 (40 h), cerebrospinal fluid accumulates in the lumen and induces a period of rapid expansion (Gato and Desmond, 2009). Experimentally increasing the pressure induces an increase in cell proliferation rate, whereas relieving the pressure severely retards growth of both the brain and eye (Coulombre, 1969; Coulombre and Coulombre, 1958; Desmond and Jacobson, 1977; Desmond et al., 2005). Hence, intraocular pressure can affect both viscoelastic expansion and growth of the OVs. In addition, cytoskeletal contraction of cell apexes (facing the lumen) may help refine OV shape (Coulombre, 1969; Schook, 1980; Svoboda and O’Shea, 1987).
It is important to note the limitations of using 2-D models to simulate such a complex 3-D morphogenetic process. For example, a cylindrical ring is not an adequate representation for the cross section of a spherical shell undergoing axisymmetric invagination (Taber, 2008). Hoop stresses, which are present in the sphere but not the cylinder, make the sphere a much stiffer structure. For the present problem, developing a realistic 3-D model would require 3-D data (e.g., curvature and strain maps) that do not yet exist. Hence, we used 2-D models in two orthogonal planes as first approximations. As a 2-D approximation for a 3-D effect, we fixed the radius of the base of the OV where it connects to the brain tube. We also assumed uniform growth in the frontal plane because of a lack of data. We expect that 3-D effects would alter the present results quantitatively, although the basic behavior should be similar to that given by our 2-D models.
In addition, we have neglected the loads exerted on the OVs by the head mesenchyme (see Fig. 1A). This tissue is composed of relatively loose cells that probably behave more like a fluid than a solid and thus can be pushed away by membrane forces. Moreover, a recent study from our lab has shown that removing these cells causes only a small change in the cross section of the brain tube. On the other hand, this small change in loading can trigger a significant contractile response within a couple of hours (Filas et al., 2011). For this reason, we analyzed OV geometry within a few minutes after dissection.
In conclusion, our results suggest that morphogenesis of the optic vesicles prior to invagination is driven by differential growth constrained by contact with the surface ectoderm. Future studies are needed to examine how 3-D mechanics affects the precise shape of the primitive eye.
Acknowledgements
We are grateful to Philip Bayly, Ruth Okamoto, Ben Filas, and Alina Oltean for valuable discussions. This work was supported by NIH grant R01 NS070918.
Appendix
In a previous publication, we outlined a procedure for implementing growth in the commercial finite-element code COMSOL Multiphysics (Taber 2008). Recently, however, a major update of this software (version 4) has been issued in which the basic stress variable has been changed from first to second Piola-Kirchhoff stress. This appendix provides the modifications needed to include growth in the new version of COMSOL.
In terms of the Cauchy stress tensor σ, the second Piola-Kirchhoff stress tensor is given by (Taber, 2004)
| (5) |
where J = det F. The Structural Mechanics Module of COMSOL computes s directly from the equation
| (6) |
Our objective is to derive the appropriate constitutive relation for s when growth occurs.
First, we use the chain rule to write
| (7) |
To compute ∂C/∂C*, C is expressed in terms of C* . Using Eq. (1) yields
| (8) |
| (9) |
where Ĩ is the fourth-order unit tensor (Holzapfel 2000). Writing
| (10) |
where A is an arbitrary second-order tensor and the ei are Cartesian base vectors, we can show
| (11) |
Now, inserting Eq. (2) into (5) and using the above relations gives
| (12) |
Finally, substituting F* = F · G−1 and F*T = G−T · FT yields
| (13) |
Thus, the appropriate expression for s including growth can be obtained simply by multiplying the equation for s in COMSOL by J/J* . In addition, W must be defined in terms of the components of C* as given by C* = G−T · C · G−1 from Eq. (8).
Footnotes
Publisher's Disclaimer: This is a PDF file of an unedited manuscript that has been accepted for publication. As a service to our customers we are providing this early version of the manuscript. The manuscript will undergo copyediting, typesetting, and review of the resulting proof before it is published in its final citable form. Please note that during the production process errors may be discovered which could affect the content, and all legal disclaimers that apply to the journal pertain.
Conflict of Interest Statement
None of the authors have a conflict of interest with this work.
References
- Araujo M, Piedra ME, Herrera MT, Ros AR, Nieto MA. The expression and regulation of chick epha7 suggests roles in limb patterning and innervation. Development. 1998;125:4195–4204. doi: 10.1242/dev.125.21.4195. [DOI] [PubMed] [Google Scholar]
- Brodland GW. The differential interfacial tension hypothesis (DITH): A comprehensive theory for the self-rearrangement of embryonic cells and tissues. J Biomech Eng. 2002;124:188–197. doi: 10.1115/1.1449491. [DOI] [PubMed] [Google Scholar]
- Coulombre AJ. Regulation of ocular morphogenesis. Invest Ophthalmol. 1969;8:25–31. [PubMed] [Google Scholar]
- Coulombre AJ, Coulombre JL. The role of intraocular pressure in the development of the chick eye. Arch Ophthalmol. 1958;59:502–506. doi: 10.1001/archopht.1958.00940050058005. [DOI] [PubMed] [Google Scholar]
- Desmond ME, Jacobson AG. Embryonic brain enlargement requires cerebrospinal fluid pressure. Dev Biol. 1977;57:188–198. doi: 10.1016/0012-1606(77)90364-5. [DOI] [PubMed] [Google Scholar]
- Desmond ME, Levitan ML, Haas AR. Internal luminal pressure during early chick embryonic brain growth: Descriptive and empirical observations. Anat Rec A Discov Mol Cell Evol Biol. 2005;285:737–747. doi: 10.1002/ar.a.20211. [DOI] [PubMed] [Google Scholar]
- Ettensohn CA. Mechanisms of epithelial invagination. Q. Rev. Biol. 1985;60:289–307. doi: 10.1086/414426. [DOI] [PubMed] [Google Scholar]
- Filas BA, Bayly PV, Taber LA. Mechanical stress as a regulator of cytoskeletal contractility and nuclear shape in embryonic epithelia. Annals of Biomedical Engineering. 2011;39:443–454. doi: 10.1007/s10439-010-0171-7. [DOI] [PMC free article] [PubMed] [Google Scholar]
- Filas BA, Oltean A, Majidi S, Bayly PV, Beebe DC, Taber LA. Regional differences in actomyosin contraction shape the primary vesicles in the embryonic chicken brain. Physical Biology. 2012;9(066007) doi: 10.1088/1478-3975/9/6/066007. [DOI] [PMC free article] [PubMed] [Google Scholar]
- Gato A, Desmond ME. Why the embryo still matters: CSF and the neuroepithelium as interdependent regulators of embryonic brain growth, morphogenesis and histiogenesis. Dev Biol. 2009;327:263–272. doi: 10.1016/j.ydbio.2008.12.029. [DOI] [PubMed] [Google Scholar]
- Hamburger V, Hamilton HL. A series of normal stages in the development of chick embryo. Journal of Morphology. 1951;88:49–92. [PubMed] [Google Scholar]
- Harris WA, Hartenstein V. Neuronal determination without cell division in xenopus embryos. Neuron. 1991;6:499–515. doi: 10.1016/0896-6273(91)90053-3. [DOI] [PubMed] [Google Scholar]
- Hilfer S, Brady RC, Yang J-JW. Intracellular and extracellular changes during early ocular development in the chick embryo. In: Hilfer SR, Shefield JB, editors. Ocular Size and Shape Regulation During Development. Springer; New York: 1981. pp. 47–78. [Google Scholar]
- Huang J, Rajagopal R, Liu Y, Dattilo LK, Shaham O, Ashery-Padan R, Beebe DC. The mechanism of lens placode formation: A case of matrix-mediated morphogenesis. Dev Biol. 2011;355:32–42. doi: 10.1016/j.ydbio.2011.04.008. [DOI] [PMC free article] [PubMed] [Google Scholar]
- Hyer J, Kuhlman J, Afif E, Mikawa T. Optic cup morphogenesis requires pre-lens ectoderm but not lens differentiation. Developmental Biology. 2003;259:351–363. doi: 10.1016/s0012-1606(03)00205-7. [DOI] [PubMed] [Google Scholar]
- Kwan KM, Otsuna H, Kidokoro H, Carney KR, Saijoh Y, Chien CB. A complex choreography of cell movements shapes the vertebrate eye. Development. 2012;139:359–372. doi: 10.1242/dev.071407. [DOI] [PMC free article] [PubMed] [Google Scholar]
- Martin AC. Pulsation and stabilization: Contractile forces that underlie morphogenesis. Developmental Biology. 2010;341:114–125. doi: 10.1016/j.ydbio.2009.10.031. [DOI] [PubMed] [Google Scholar]
- Martinez-Morales JR, Wittbrodt J. Shaping the vertebrate eye. Current opinion in Genetics & Development. 2009;19:511–517. doi: 10.1016/j.gde.2009.08.003. [DOI] [PubMed] [Google Scholar]
- Pincus Z, Theriot JA. Comparison of quantitative methods for cell-shape analysis. Journal of Microscopy. 2007;227:140–156. doi: 10.1111/j.1365-2818.2007.01799.x. [DOI] [PubMed] [Google Scholar]
- Rembold M, Loosli F, Adams RJ, Wittbrodt J. Individual cell migration serves as the driving force for optic vesicle evagination. Science. 2006;313:1130–1134. doi: 10.1126/science.1127144. [DOI] [PubMed] [Google Scholar]
- Rodriguez EK, Hoger A, McCulloch AD. Stress-dependent finite growth in soft elastic tissues. Journal of Biomechanics. 1994;27:455–467. doi: 10.1016/0021-9290(94)90021-3. [DOI] [PubMed] [Google Scholar]
- Savin T, Kurpios NA, Shyer AE, Florescu P, Liang H, Mahadevan L, Tabin CJ. On the growth and form of the gut. Nature. 2011;476:57–62. doi: 10.1038/nature10277. [DOI] [PMC free article] [PubMed] [Google Scholar]
- Schook P. Morphogenetic movements during the early development of the chick eye. an ultrastructural and spatial reconstructive study. b. invagination of the optic vesicle and fusion of its walls. Acta Morphol Neerl Scand. 1980;18:159–180. [PubMed] [Google Scholar]
- Shi Y, Yao J, Xu G, Taber LA. Bending of the looping heart: Differential growth revisited. Journal of Biomechanical Engineering. 2014;136:081002. doi: 10.1115/1.4026645. [DOI] [PMC free article] [PubMed] [Google Scholar]
- Svoboda KK, O’Shea KS. An analysis of cell shape and the neuroepithelial basal lamina during optic vesicle formation in the mouse embryo. Development. 1987;100:185–200. doi: 10.1242/dev.100.2.185. [DOI] [PubMed] [Google Scholar]
- Taber LA. Nonlinear Theory of Elasticity: Applications in Biomechanics. World Scientific Publishing Co.; NJ: 2004. [Google Scholar]
- Taber LA. Biophysical mechanisms of cardiac looping. J Dev Biol. 2006;50:323–332. doi: 10.1387/ijdb.052045lt. [DOI] [PubMed] [Google Scholar]
- Taber LA. Theoretical study of Beloussov’s hyper-restoration hypothesis for mechanical regulation of morphogenesis. Biomech Model Mechanobiol. 2008;7:427–441. doi: 10.1007/s10237-007-0106-x. [DOI] [PMC free article] [PubMed] [Google Scholar]
- Taber LA. Towards a unified theory for morphomechanics. Philosophical Transactions of the Royal society A. 2009;367:3555–3583. doi: 10.1098/rsta.2009.0100. [DOI] [PMC free article] [PubMed] [Google Scholar]
- Varner VD, Taber LA. On measuring stress distributions in epithelia. In: Garikipati K, Arruda EM, editors. IUTAM Symposium on Cellular, Molecular and Tissue Mechanics; 2010. pp. 45–54. Springer, New York. [Google Scholar]
- Voronov DA, Taber LA. Cardiac looping in experimental conditions:effects of extraembryonic forces. Developmental Dynamics. 2002;224:413–421. doi: 10.1002/dvdy.10121. [DOI] [PubMed] [Google Scholar]
- Xu G, Kemp PS, Hwu JA, Beagley AM, Bayly PV, Taber LA. Opening angles and material properties of the early embryonic chick brain. J Biomech Eng. 2010a;132:011005. doi: 10.1115/1.4000169. [DOI] [PMC free article] [PubMed] [Google Scholar]
- Xu G, Knutsen AK, Dikranian K, Kroenke CD, Bayly PV, Taber LA. Axons pull on the brain, but tension does not drive cortical folding. Journal of Biomechanical Engineering. 2010b;132:071013. doi: 10.1115/1.4001683. [DOI] [PMC free article] [PubMed] [Google Scholar]


