

Abstract
The success of many population studies is determined by proper matching of cases to controls. Some of the confounding and bias that afflict Electronic Health Record (EHR)-based observational studies may be reduced by creating effective methods for finding adequate controls. We implemented a method to match case and control populations to compensate for sparse and unequal data collection practices common in EHR data. We did this by matching the healthcare utilization of patients after observing that more complete data was collected on high healthcare utilization patients vs. low healthcare utilization patients. In our results, we show that many of the anomalous differences in population comparisons are mitigated using this matching method compared to other traditional age and gender-based matching. As an example, the comparison of the disease associations of Ulcerative Colitis and Crohn’s Disease show differences that are not present when the controls are chosen in a random or even a matched age/gender/race algorithm. In conclusion, the use of healthcare utilization-based matching algorithms to find adequate controls greatly enhanced the accuracy of results in EHR studies. Full source code and documentation of the control matching methods is available at https://community.i2b2.org/wiki/display/conmat/.
Keywords: EHR, Controls, Matching, Comorbidity, Inflammatory Bowel Disease
1. Introduction
In the United States, electronic health record (EHR) adoption has increased dramatically in recent years. In 2012, 44% of hospitals reported having an operational EHR, up from 8.8% in 2008 [1]. The growth of EHRs has created large longitudinal data sets that enable a variety of population studies. EHRs have been shown to provide important strengths over other data sources, including large, diverse populations representing real-world patterns of disease and treatment with a wide variety of data types [2-4]. Investigators have leveraged these data sources for testing targeted hypothesis of drug-adverse effect associations [5-7] and comparing effectiveness of established therapies [8]. More recently, researchers have also aimed to identify novel genetic associations to EHR-derived phenotypes [9]. In these studies, institutions establish a biorepository of discarded blood samples which are linked to EHR data. DNA is extracted from collected samples and used to conduct genotype-phenotype association studies. [3, 10, 11].
Many of these EHR-based observational studies employ a case-control design where a case population of patients with a disease are identified and a set of control patients are used for statistical comparisons. The validity of theses designs are quite sensitive to the methods used to select a comparison group. In an optimal scenario, selected controls should represent the population of individuals who would have been identified and included as cases had they also developed the disease used to define the cases [13]. One limitation of the EHR-based data sources, however, is data may be sparse and unequally collected across patient populations. This effect is determined, in part by the health status of the patient, since patients who are very ill and have been seen for longer periods of time have more information in the EHR than healthier people. This effect introduces a serious ascertainment bias [12, 13] that may adversely impact the proper interpretation of EHR-based studies. For example, a case patient with a history of chronic disease X is much more likely to have recorded comorbidities or other potential study outcome than a control patient selected based on the absence of that chronic disease who may have had few encounters with the healthcare system due to lack of a recorded disease.
Thus the primary aim of a control matching algorithm relying on EHR data should be to find proper controls in the context of a heterogeneous patient population and inconsistent data collection that may confound results. [14] However, many case-control studies relying on EHR or insurance claims data only employ traditional methods to match based on patient age and gender [5]. Furthermore, the authors have been unable to identify methods for matching controls specifically targeted to EHR data in the published literature.
In this work we aim to investigate varying control matching approaches to improve the selection of controls in the EHR of a large health system. Cases are matched to 4 control groups of varying complexity ranging from randomly selected matches to matching based on a combination of demographic and healthcare utilization features. We evaluate our control matching methods by analyzing the comorbidity profile of two diseases related to inflammatory bowel disease (IBD): ulcerative colitis (UC) and Crohn’s disease (CD) using a reference standard created by a subject matter expert as well as by comparing distribution of comorbidities when comparing the cases against each control group. The detailed methods and source code of the matching algorithms evaluated in this work are made publicly available as open source software implemented on the Informatics for Integrating Biology and the Bedside (i2b2) platform.
2. Materials and Methods
2.1 Data Source and Population
The Partners HealthCare electronic health record (EHR) includes sociodemographic data, billing codes, laboratory results, problem lists, medications, vital signs, procedure reports and narrative notes from Massachusetts General Hospital (MGH) and Brigham and Women’s Hospital (BWH), as well as from community and specialty hospitals that are part of the Partners HealthCare system in Boston (Massachusetts, USA). All patients with at least one ICD-9 diagnosis code between January 1998 and April 2012 at MGH or BWH were selected for inclusion in a data set (referred to as a data ‘mart’), yielding 2.8 million patients drawn from about 5 million unique patients in the Partners system. The data mart consists of all electronic records for the study patients and can be managed with the i2b2 server software (i2b2 v1.6, Boston, MA, USA). [15, 16] The Partners Institutional Review Board approved all aspects of this study.
2.2 Case and Control Pool Definition
EHR phenotyping algorithms for Crohn’s disease (CD) and ulcerative colitis (UC) developed by Ananthakrishnan using the same data source were utilized to evaluate the matching algorithms in this study [17]. A sample of 1,200 patients’ charts with a diagnoses of CD (ICD-9 555.*) or UC (ICD-9 556.*) were reviewed by a clinical expert to determine true disease status. Using the chart review results as a training dataset, a classification model for UC and CD was developed using coded data as well as structured elements derived from narrative notes through natural language processing (NLP). The CD and UC algorithms predicted cases with a fixed specificity of 97%, yielding a sensitivity of 69% and a positive predictive value of 98% for CD and a sensitivity of 79% and a positive predictive value of 97% for UC. The trained models were applied to the full population yielding 5,506 patients with CD and 5,522 patients with UC.
A set of 2,688,958 patients without a diagnosis of UC or CD in their medical record were selected for inclusion into a control pool. Each matching algorithm will randomly match case patients to patients selected from the control pool using the specified matching criteria.
2.3 Control Matching Algorithms
For each patient in the case and control pool sets we extracted 3 demographic variables: age (A), gender (G), and race (R). In addition, 3 variables of healthcare utilization in the study period were calculated: number of facts (N), year of the first encounter in the healthcare system (F) and year of most recent encounter in the healthcare system (L). The number of facts refers to number of distinct encounters with the medical system and is a measure of health care utilization. For example, an office visit, a medication prescription, and a diagnosis code each contribute 1 fact. Gender and race groups were treated as categorical variables and matched exactly to control patients. Age was grouped into bins of decades of life (e.g. 0-9, 10-19). Healthcare utilization variables N, F and L were treated as continuous variables and divided into 8 quantile bins of uniform distribution. (Table 1).
Table 1.
Matching variables and bins
| Variable | Bins | |
|---|---|---|
| A | Age | 10-year age bins |
| G | Gender | 2 categorical bins |
| R | Race | 5 categorical bins |
| N | Number of facts | 8 bins of uniform distribution |
| F | First observation date | 8 bins of uniform distribution |
| L | Last observation date | 8 bins of uniform distribution |
Each case patient was then matched to one patient in the control pool (1:1) using 3 different paired matching algorithms: age, race and gender (AGR), number of health “facts” and first and most recent observation (NFL); and all matching factors (AGRNFL). For each matching process, patients selected from the control pool were only matched to one case patient (1:1 matching) without replacement into control pool. Each case-control matched pair was then assigned a pair identifier for the matching analysis. Where there were insufficient controls to match all factors, the non-categorical matching factors were relaxed iteratively until an appropriate control is found. Since the control sampling uses a greedy algorithm – cases matched first are more likely to find an exact matched control – the order in which the cases were matched was also randomized.
For illustration, a hypothetical case patient that is 65 years old, male, of Asian descent, with an observation period of 2001-2008 and 390 healthcare facts who is unable to find a control with the exact parameters would iteratively relax the matching parameters as follows: the age bin is relaxed downward one decile bin in an attempt to find a control aged 70-79 with other exact matching parameter bins. If none is found, the age bin is relaxed upward to find a control aged 90-99 with other exact parameter bins. Bins are only adjusted by 1 in either direction. If still no control is found, the number of facts bin is relaxed down one bin and then up one bin in the same way. The parameters are relaxed in this way until a control is found. If no control is found the case patient is discarded from the analysis. While a user can configure the algorithm to assign which parameters to relax, in which order and the number of bins to relax, for this paper we relax only the continuous parameters in the order A, N, F, L. Maximum adjustment of 1 bin is used.
A detailed diagram of the matching protocol is described in the flowchart included in Figure 1. In addition, full source code and documentation for implementing the control matching methods in the i2b2 framework is available at https://community.i2b2.org/wiki/display/conmat/. The documentation contains additional details on methods utilized in this paper.
Figure 1.

Matching algorithms flow diagram
As an additional control, we randomly sampled patients from the control pool without any matching on factors. In this group, control patients were unmatched to the cases (random). As a sensitivity analysis and for additional comparisons patients were also matched by each factor alone.
2.4 Assessing IBD-Related comorbidities
2.4.1 Comorbidity Definitions
A disease grouping file developed as part of the PheWAS research was downloaded in May 2013. [18] PheWAS groupings are manually curated disease categories that generally follow the 3-digit code groupings within the ICD9 code system itself but modified to include semantically related groups. For example, all hypertension codes (401-405) are grouped together as one PheWAS grouping. For the purposes of this study, we pruned the PheWAS groups to exclude comorbidities with a frequency of less than 5 patients in either the cases or the matched controls were excluded from the analysis due to limited power to detect a true association. A total of 806 PheWAS groups were selected for inclusion in the analysis.
2.4.2 Comorbidity Associations
The magnitude of the association between the IBD-related diagnosis and a given comorbidity is based on the relative risk (RR) between the disease and comorbidity calculated by constructing 2×2 contingency tables for each PheWAS group. Statistical significance and 95% confidence intervals were calculated using the chi-squared test. [19]
2.4.3 Clinical Expert Reference
In order to evaluate each matching algorithms’ ability to discern clinically meaningful comorbidity association, a board-certified gastroenterologist (ANA) reviewed the full list of PheWAS disease groupings to indicate whether there existed prior literature demonstrating an association between the diagnosis and IBD in general. Identified comorbidities may have included associations due to IBD-related treatments to account for problems such as infections that are not directly associated with IBD, but could be associated with the immunosuppression medications taken for IBD. The resulting list was used as a reference set to empirically compare the results of our case-control analyses across the disease spectrum.
2.5 Comparison of the matching algorithms
Each control set was compared to UC or CD case sets based on the matching parameters as well as selected common comorbidities in the general population. In addition, the distributions of all comorbidity relative risks (RR) were visualized and compared across control sets. The distributions of comorbidities reaching statistical significance by Bonferroni-adjusted p-value for each control set were also reported. The ability of each case-control experiment to detect likely comorbidity associations was evaluated by transforming the estimated RR and associated standard error into a binary indicator depending on whether the 95% confidence interval for the RR excluded or included unity. The transformed binary classifier was compared to the expert-derived reference and the sensitivity (SE), specificity (SP) and positive predictive value (PPV) was computed on the basis of statistical significance at alpha = 0.05 and alpha = 0.000062 (equal to Bonferroni correction for multiple comparisons across all 806 comorbidities).
3. Results
The matching algorithm effectively matched controls to case patients using the matching factors described. Table 2 compares the UC and CD case patients to the Random, AGR, NFL and AGRNFL matched controls on the basis of the demographic and healthcare utilization variables defined for matching. Notably, the patients not matched on NFL had far fewer encounters in the healthcare system. Even without matching, the gender distributions across the control sets generally matched the cases suggesting gender may not need to be included as a matching factor for UC and CD.
Table 2.
a. Comparison of matching characteristics of CD and matched control patients
| CD Cases N = 5,196 | Random Controls N = 5,196 | AGR Matched Controls N = 5,196 | NFL Matched Controls N = 5,196 | AGRNFL Matched Controls N = 5,196 | |||||||||||
|---|---|---|---|---|---|---|---|---|---|---|---|---|---|---|---|
| Demographics | Mean | SD | Mean | SD | Mean | SD | Mean | SD | Mean | SD | |||||
| Age, years | 47.6 | 18.7 | 46.3 | 22.5 | 47.6 | 18.9 | 52.1 | 21.5 | 47.9 | 18.8 | |||||
| Pct | Pct | Pct | Pct | Pct | |||||||||||
| Female gender | 53.7 | 54.9 | 53.7 | 58.3 | 53.7 | ||||||||||
| Race/ethnicity§§ | |||||||||||||||
| White | 86.7 | 66.1 | 86.7 | 72.1 | 86.7 | ||||||||||
| African American | 3.3 | 6.5 | 3.3 | 6.4 | 3.3 | ||||||||||
| Hispanic | 2.2 | 8.2 | 2.2 | 9.1 | 2.2 | ||||||||||
| Asian | 1 | 3.1 | 1 | 3.1 | 1 | ||||||||||
| Other | 6.8 | 16.1 | 6.8 | 9.3 | 6.8 | ||||||||||
| Healthcare Utilization | Median | Q1 | Q3 | Median | Q1 | Q3 | Median | Q1 | Q3 | Median | Q1 | Q3 | Median | Q1 | Q3 |
| Number of facts | 246.5 | 96 | 587 | 32 | 9 | 122 | 35 | 10 | 129 | 213 | 79 | 475 | 206.5 | 77 | 462 |
| Observation start, year | 2002 | 1998 | 2006 | 2004 | 2000 | 2008 | 2004 | 2000 | 2008 | 2002 | 1998 | 2006 | 2002 | 1998 | 2006 |
| Observation end, year | 2011 | 2009 | 2012 | 2009 | 2004 | 2011 | 2010 | 2004 | 2011 | 2011 | 2009 | 2012 | 2011 | 2008 | 2012 |
|
| |||||||||||||||
|
b Comparison of matching characteristics of UC and matched control patients
| |||||||||||||||
| UC Cases N = 5,228 | Random Controls N = 5,228 | AGR Matched Controls N = 5,228 | NFL Matched Controls N = 5,228 | AGRNFL Matched Controls N = 5,228 | |||||||||||
|
| |||||||||||||||
| Demographics | Mean | SD | Mean | SD | Mean | SD | Mean | SD | Mean | SD | |||||
| Age, years | 51 | 18.4 | 46 | 22.5 | 50.8 | 18.5 | 51.7 | 21.3 | 51 | 18.5 | |||||
| Pct | Pct | Pct | Pct | Pct | |||||||||||
| Female gender | 52.9 | 54.6 | 52.9 | 59.6 | 52.9 | ||||||||||
| Race/ethnicity§§ | |||||||||||||||
| White | 85.6 | 66.9 | 85.6 | 71.4 | 85.6 | ||||||||||
| African American | 2.7 | 6.5 | 2.7 | 7.5 | 2.7 | ||||||||||
| Hispanic | 2.6 | 8.1 | 2.6 | 8.9 | 2.6 | ||||||||||
| Asian | 1.7 | 3.2 | 1.7 | 3 | 1.7 | ||||||||||
| Other | 7.3 | 15.3 | 7.3 | 9.2 | 7.3 | ||||||||||
| Healthcare Utilization | Median | Q1 | Q3 | Median | Q1 | Q3 | Median | Q1 | Q3 | Median | Q1 | Q3 | Median | Q1 | Q3 |
| Number of facts | 252 | 95 | 570.5 | 30 | 9 | 114 | 37 | 10 | 131 | 225 | 79 | 487 | 223 | 79 | 486 |
| Observation start, year | 2001 | 1998 | 2005 | 2004 | 2000 | 2008 | 2003 | 1999 | 2008 | 2001 | 1998 | 2005 | 2001 | 1998 | 2005 |
| Observation end, year | 2011 | 2009 | 2012 | 2009 | 2004 | 2011 | 2010 | 2004 | 2011 | 2011 | 2010 | 2012 | 2011 | 2010 | 2012 |
Race and ethnicity are collected using a single field in the electronic medical record, so subjects who identify as Hispanic are not further characterized.
Table 3 provides relative risk associations between UC and CD and selected comorbidities. In general, controls not matched on utilization factors had significant positive associations across all of the selected comorbidities whereas the AGRNFL and NFL matched sets had many fewer significant at alpha = 0.05. Figure 1 plots the distributions of the significant comorbidities using the Random, AGR, NFL, and AGRNFL algorithms. The curves further indicate that a far greater number of associations are detected when controls are matched only on demographic (AGR) factors. Overall, the curves show the surprising tendency that when using only random or demographic based matching nearly all comorbidities are positively associated with UC and CD. Using the utilization corrected matches (NFL), the associations are far fewer and more evenly distributed between positive and negative associations. Indeed, there is a nominal decrease of negative associations when matching by all combined parameter AGRNFL when compared to matching on healthcare utilization parameters NFL without demographic parameters AGR.
Table 3.
a Selected comorbidity associations with CD
| CD vs Random | CD vs AGR | CD vs NFL | CD vs AGRNFL | |||||
|---|---|---|---|---|---|---|---|---|
| Comorbidity (lifetime history) | RR | RR | RR | RR | ||||
| Asthma | 1.30 | + | 1.28 | + | 0.88 | 0.90 | ||
| Chronic airway obstruction | 1.34 | + | 1.39 | + | 0.86 | 1.02 | ||
| Chronic kidney disease | 1.55 | + | 1.53 | + | 1.05 | 1.15 | + | |
| Congenital anomalies | 1.29 | + | 1.35 | + | 0.97 | 0.95 | ||
| Diabetes mellitus, Type 2 | 1.13 | 1.26 | + | 0.76 | - | 0.87 | ||
| Disorders of lipoid metabolism | 1.19 | + | 1.17 | + | 0.68 | - | 0.78 | - |
| Fractures | 1.09 | 1.06 | 0.78 | - | 0.72 | - | ||
| Gastrointestinal hemorrhage | 1.81 | + | 1.86 | + | 1.42 | + | 1.48 | + |
| Headaches | 1.27 | + | 1.21 | + | 0.82 | - | 0.80 | - |
| Heart failure | 1.26 | + | 1.31 | + | 0.80 | - | 0.91 | |
| Hypertension | 1.23 | + | 1.25 | + | 0.76 | - | 0.89 | - |
| Ischemic heart disease | 1.17 | + | 1.24 | + | 0.76 | - | 0.90 | |
| Major depression | 1.47 | + | 1.38 | + | 0.94 | 0.91 | ||
| Malignant neoplasm | 1.11 | 1.10 | 0.82 | - | 0.83 | - | ||
| Osteoarthrosis | 1.28 | + | 1.19 | + | 0.78 | - | 0.87 | - |
| Rheumatoid arthritis | 1.59 | + | 1.69 | + | 1.40 | + | 1.41 | + |
|
| ||||||||
|
b Selected comorbidity associations with UC
| ||||||||
| UC vs Random | UC vs AGR | UC vs NFL | UC vs AGRNFL | |||||
|
| ||||||||
| Comorbidity (lifetime history) | RR | RR | RR | RR | ||||
| Asthma | 1.41 | + | 1.38 | + | 0.93 | 0.98 | ||
| Chronic airway obstruction | 1.35 | + | 1.19 | 0.86 | 0.91 | |||
| Chronic kidney disease | 1.60 | + | 1.51 | + | 1.04 | 1.15 | + | |
| Congenital anomalies | 1.29 | + | 1.32 | + | 0.95 | 0.95 | ||
| Diabetes mellitus, Type 2 | 1.32 | + | 1.27 | + | 0.84 | - | 0.91 | |
| Disorders of lipoid metabolism | 1.49 | + | 1.40 | + | 0.89 | - | 0.91 | - |
| Fractures | 1.18 | + | 1.15 | + | 0.83 | - | 0.80 | - |
| Gastrointestinal hemorrhage | 2.14 | + | 2.09 | + | 1.75 | + | 1.80 | + |
| Headaches | 1.37 | + | 1.34 | + | 0.84 | - | 0.87 | - |
| Heart failure | 1.36 | + | 1.27 | + | 0.86 | 0.90 | ||
| Hypertension | 1.41 | + | 1.30 | + | 0.86 | - | 0.92 | |
| Ischemic heart disease | 1.33 | + | 1.25 | + | 0.86 | - | 0.87 | - |
| Major depression | 1.44 | + | 1.40 | + | 0.97 | 0.91 | ||
| Malignant neoplasm | 1.23 | + | 1.16 | + | 0.91 | 0.93 | ||
| Osteoarthrosis | 1.44 | + | 1.35 | + | 0.96 | 0.93 | ||
| Rheumatoid arthritis | 1.72 | + | 1.67 | + | 1.36 | + | 1.40 | + |
RR: Relative Risk
significant positive association (RR > 1)
significant negative association (RR < 1)
The empirical assessment of comorbidity associations identified using a binary transformed RR emphasized the overall contributions of N, F, and L on the performance of each classifier (Table 4). For CD, the AGRNFL matching algorithm performed well with a specificity of 92.9% (95% CI: 90.1-95.0%), a sensitivity of 33.1% (95% CI: 25.1-42.1%) and a PPV of 56.0 (95% CI: 44.8-67.2%). In contrast, the AGR algorithm was far more sensitive at the expense of accuracy with a specificity of 54.6% (95% CI: 47.8-59.4%), a sensitivity of 78.8% (95% CI: 70.1-85.6%) and a PPV of 32.2 (95% CI 26.8-37.6%). Matched controls for UC performed similarly: the AGRNFL matching algorithm yielded a specificity of 92.0% (95% CI: 89.1-94.2%), a sensitivity of 29.9% (95% CI: 22.3-38.8%) and a PPV of 50.0 (95% CI: 38.8-61.2%). The AGR algorithm was again more sensitive with a specificity of 38.1% (95% CI: 33.6-42.9%), a sensitivity of 86.1% (95% CI: 78.1-91.6%) and a PPV of 26.8% (95% CI: 22.2-31.3%). Additional results evaluating matching based each factor alone is included in the supplemental materials (Tables S1-S4).
Table 4.
Evaluation of matched controls using an expert-derived reference of IBD comorbidity associations
| Cases | Matched Controls | Sensitivity (%) | Specificity (%) | PPV (%) |
|---|---|---|---|---|
| Crohn’s Disease (CD) | Random | 77.5 (68.8-84.4) | 54.3 (49.5-59.1) | 32.2 (26.8-37.6) |
| AGR | 78.8 (70.1-85.6) | 54.6 (47.8-59.4) | 32.2 (26.8-37.6) | |
| NFL | 34.9 (26.8-43.8) | 92.5 (89.6-94.6) | 53.3 (45.4-67.1) | |
| AGRNFL | 33.1 (25.1-42.1) | 92.9 (90.1-95.0) | 56.0 (44.8-67.2) | |
|
| ||||
| Ulcerative Colitis (UC) | Random | 84.7 (76.7-90.5) | 41.4 (36.7-46.2) | 28.5 (23.8-33.2) |
| AGR | 86.1 (78.1-91.6) | 38.1 (33.6-42.9) | 26.8 (22.2-31.3) | |
| NFL | 30.2 (22.5-39.1) | 91.8 (88.9-94.1) | 49.4 (38.2-60.5) | |
| AGRNFL | 29.9 (22.3-38.8) | 92.0 (89.1-94.2) | 50.0 (38.8-61.2) | |
4. Discussion
This study presents the result of a systematic, empirical evaluation of case-control matching algorithms using varying number of demographic and healthcare utilization factors. Our efforts assessed the validity of matching patients based on their overall usage of the healthcare system (and consequentially the documentation of their disease state) as evidenced by the ability to detect likely disease comorbidities defined by an expert-derived reference standard. We have demonstrated that matching patients on the number of diagnoses, procedures and medications has a significant effect on specificity and positive predictive value of detecting likely disease associations. Matching by both demographic and utilization factors improves the precision of association detection by nearly 75% compared to an unmatched control patients or controls matched by demographics alone.
As in most case-control studies, we want matched controls to be comparable to the cases without themselves having the study disease or risk factors known to be associated with the outcome. We want them to be a representative sample of the population that produced the cases to ensure that the distribution of exposure is the same between the two groups. We want to take into account criteria, such as age, gender and race that are often strong confounders of disease. Using the number of facts as a proxy for healthcare utilization, as we do in this method, is another way to promote comparability between the cases and controls. This is especially important when using hospital-based populations for selecting the cases and controls. When the hospital population is heterogeneous, as can occur in tertiary referral hospitals, it is difficult to ensure that the patients have the same exposure to opportunities for recording their disease state, leading to selection bias or confounding. Unfortunately, we do not have the consistent data collection for each patient that is common in clinical trials. This leads to an ascertainment bias that is inherent in every EHR-based observational study. We partially account for the heterogeneity of our population on this axis by matching on healthcare utilization. We use a variety of kinds of data to determine this metric (number of diagnoses, procedures and medications), which tend to minimize errors that might occur if one particular variable were unknowingly associated with the exposure.
Several limitations in our approach bear mentioning. First, the case-control design as performed may have inherent limits for detecting comorbidity associations. The matching process, though it can be very effective in controlling for confounding variables, requires effort to identify the correct confounders and to ensure that the method is applied correctly to achieve meaningful results. In addition, in contrast to a stratified analysis, a factor that has been matched on cannot be examined in terms of how it affects the outcome. Other potential problems could be that for some disease types there may be insufficient controls to match to cases and that matching on many variables may be statistically inefficient if we are not careful about which variables upon which to match.
Our approach for comparing the performance of matched controls also has drawbacks. While the reference standard was derived by clinical expert based on literature there may be some disagreement among gastroenterologists about true associations. However, as part of the goal of a PheWAS approach is to detect novel associations and patterns our aim was not to create a gold standard but to compare the ability of each matching algorithm to identify clinically meaningful associations that would be useful to a typical investigator hoping to leverage this data to advance understanding of a particular disease using EHR data from an active health system.
In addition, the results may vary across different disease types. For example, acute diseases or less well-defined phenotypes may perform differently. Nevertheless, we believe the methods described will be effective in detecting novel associations that can be validated with more traditional hypothesis-driven investigation.
Finally, the philosophical question of what constitutes an optimal control population is an ongoing one. Using hospital populations for matching may lead to selection of a number of sick controls that may introduce unknown confounders. Indeed, attempts to identify truly healthy controls with similar utilization distributions have identified less than 2% of the population. [20]
The number of diagnoses, medications, and procedures is a crude indicator of both healthcare utilization and the completeness of recording of the disease state of the patient. Clearly, patient overall “sickness” is also being introduced as a comparator which can lead to deleterious matching effects. The presence of negative associations after NFL matching may be largely the result of this effect. If a patient with a serious disease is matched to a patient with an equally serious but different disease, the overall incident of alternative serious diseases will increase. We speculate that using more sophisticated measures of healthcare utilization, such as the clinic type, provider specialty, insurance type (as a proxy for socio economic status), and inpatient vs. outpatient status, will improve our ability to match like patients without introducing this effect.
In conclusion, the use of healthcare utilization factors to find adequate controls greatly enhanced the accuracy and utility of disease associated states found in the medical record. In this work, we present an implementation of a case-control matching algorithm using variables that can be easily derived in most EHR data sources and demonstrate the positive effect of finding controls with similar frequencies of the number of recorded diagnoses, medications, and procedures and their temporal distributions. Our work can be generalizable to a broad range of analyses using EHR data sources to detect novel disease associations. These matching methods developed may also be leveraged to detect drug-disease associations or identify and validate drug adverse effects.
Supplementary Material
Figure 2.

Distribution of Crohn’s disease (CD) comorbidity associations with different matched control patients. Each line represents a case-control comparison across 806 comorbidities using unmatched controls (CD97_Random), controls matched on age, gender and race (CD97_AGR), controls matched on observation frequency and period in the EHR (CD97_NFL) and controls matched on all factors (CD97_AGRNFL). The y-axis represents the proportion of comorbidities meeting statistical significance (Bonferroni-adjusted) at the relative risk (RR). Lines are smoothed using a Gaussian kernel function (Density).
Figure 3.
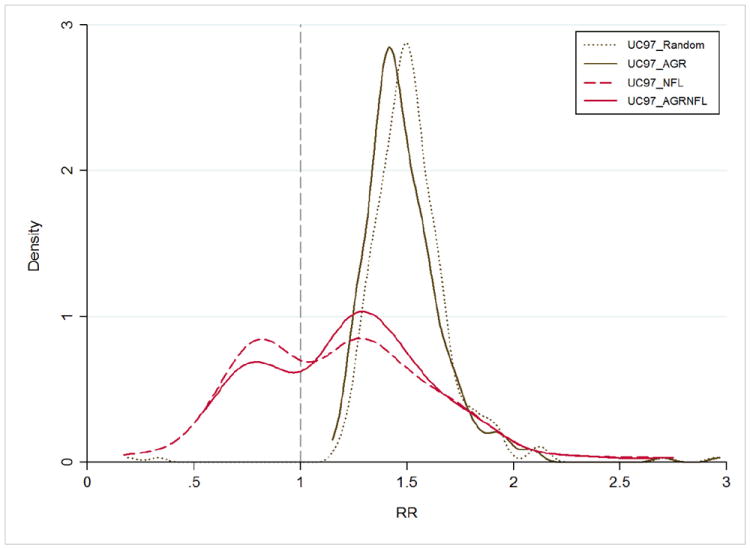
Distribution of Ulcerative colitis (UC) comorbidity associations with different matched control patients. Each line represents a case-control comparison across 806 comorbidities using unmatched controls (UC97_Random), controls matched on age, gender and race (UC97_AGR), controls matched on observation frequency and period in the EHR (UC97_NFL) and controls matched on all factors (UC97_AGRNFL). The y-axis represents the proportion of comorbidities meeting statistical significance (Bonferroni-adjusted) at the relative risk (RR). Lines are smoothed using a Gaussian kernel function (Density).
Highlights.
Appropriate control selection is essential to the success of population studies
Heterogeneous populations in observational data require novel matching methods
In EHR studies, matching by healthcare utilization improves comorbidity detection
Controls matched to inflammatory bowel disease patients identified likely comorbidity
Acknowledgments
We acknowledge Griffin Weber, MD for fruitful discussions related to this work.
This study was supported by The Foundation of the National Institutes of Health (FNIH). Ashwin N Ananthakrishnan is supported by a grant from the National Institutes of Health (K23 DK091742).
Footnotes
Publisher's Disclaimer: This is a PDF file of an unedited manuscript that has been accepted for publication. As a service to our customers we are providing this early version of the manuscript. The manuscript will undergo copyediting, typesetting, and review of the resulting proof before it is published in its final citable form. Please note that during the production process errors may be discovered which could affect the content, and all legal disclaimers that apply to the journal pertain.
References
- 1.DesRoches CM, Charles D, Furukawa MF, Joshi MS, Kralovec P, Mostashari F, et al. Adoption Of Electronic Health Records Grows Rapidly, But Fewer Than Half Of US Hospitals Had At Least A Basic System In 2012. Health Affairs. 2013 doi: 10.1377/hlthaff.2013.0308. [DOI] [PubMed] [Google Scholar]
- 2.Jha AK, DesRoches CM, Campbell EG, Donelan K, Rao SR, Ferris TG, et al. Use of electronic health records in US hospitals. New England Journal of Medicine. 2009;360:1628–38. doi: 10.1056/NEJMsa0900592. [DOI] [PubMed] [Google Scholar]
- 3.Denny JC. Chapter 13: Mining Electronic Health Records in the Genomics Era. PLoS Comput Biol. 2012;8:e1002823. doi: 10.1371/journal.pcbi.1002823. [DOI] [PMC free article] [PubMed] [Google Scholar]
- 4.Jha AK. The Promise of Electronic Records. JAMA: The Journal of the American Medical Association. 2011;306:880–1. doi: 10.1001/jama.2011.1219. [DOI] [PubMed] [Google Scholar]
- 5.Ryan PB, Madigan D, Stang PE, Marc Overhage J, Racoosin JA, Hartzema AG. Empirical assessment of methods for risk identification in healthcare data: results from the experiments of the Observational Medical Outcomes Partnership. Statistics in Medicine. 2012;31:4401–15. doi: 10.1002/sim.5620. [DOI] [PubMed] [Google Scholar]
- 6.Tatonetti N, Denny J, Murphy S, Fernald G, Krishnan G, Castro V, et al. Detecting drug interactions from adverse-event reports: interaction between paroxetine and pravastatin increases blood glucose levels. Clinical Pharmacology & Therapeutics. 2011;90:133–42. doi: 10.1038/clpt.2011.83. [DOI] [PMC free article] [PubMed] [Google Scholar]
- 7.Castro VM, Clements CC, Murphy SN, Gainer VS, Fava M, Weilburg JB, et al. QT interval and antidepressant use: a cross sectional study of electronic health records. BMJ: British Medical Journal. 2013;346 doi: 10.1136/bmj.f288. [DOI] [PMC free article] [PubMed] [Google Scholar]
- 8.Masica AL, Ewen E, Daoud YA, Cheng D, Franceschini N, Kudyakov RE, et al. Comparative effectiveness research using electronic health records: impacts of oral antidiabetic drugs on the development of chronic kidney disease. Pharmacoepidemiology and Drug Safety. 2013;22:413–22. doi: 10.1002/pds.3413. [DOI] [PubMed] [Google Scholar]
- 9.Pathak J, Wang J, Kashyap S, Basford M, Li R, Masys DR, et al. Mapping clinical phenotype data elements to standardized metadata repositories and controlled terminologies: the eMERGE Network experience. J Am Med Inform Assoc. 2011 doi: 10.1136/amiajnl-2010-000061. [DOI] [PMC free article] [PubMed] [Google Scholar]
- 10.Kohane IS. Using electronic health records to drive discovery in disease genomics. Nature Reviews Genetics. 2011;12:417–28. doi: 10.1038/nrg2999. [DOI] [PubMed] [Google Scholar]
- 11.Liao KP, Kurreeman F, Li G, Duclos G, Murphy S, Guzman R, et al. Associations of autoantibodies, autoimmune risk alleles, and clinical diagnoses from the electronic medical records in rheumatoid arthritis cases and non–rheumatoid arthritis controls. Arthritis & Rheumatism. 2013;65:571–81. doi: 10.1002/art.37801. [DOI] [PMC free article] [PubMed] [Google Scholar]
- 12.Chen HY, Kittles R, Zhang W. Bias correction to secondary trait analysis with case-control design. Stat Med. 2013;32:1494–508. doi: 10.1002/sim.5613. [DOI] [PMC free article] [PubMed] [Google Scholar]
- 13.Phillips SJ, Dudik M, Elith J, Graham CH, Lehmann A, Leathwick J, et al. Sample selection bias and presence-only distribution models: implications for background and pseudo-absence data. Ecol Appl. 2009;19:181–97. doi: 10.1890/07-2153.1. [DOI] [PubMed] [Google Scholar]
- 14.Brookhart MA, Stürmer T, Glynn RJ, Rassen J, Schneeweiss S. Confounding Control in Healthcare Database Research: Challenges and Potential Approaches. Medical Care. 2010;48:S114–S20. doi: 10.1097/MLR.0b013e3181dbebe3. [DOI] [PMC free article] [PubMed] [Google Scholar]
- 15.Murphy SN, Weber G, Mendis M, Gainer V, Chueh HC, Churchill S, et al. Serving the enterprise and beyond with informatics for integrating biology and the bedside (i2b2) Journal of the American Medical Informatics Association. 2010;17:124–30. doi: 10.1136/jamia.2009.000893. [DOI] [PMC free article] [PubMed] [Google Scholar]
- 16.Murphy SN, Mendis M, Hackett K, Kuttan R, Pan W, Phillips LC, et al. Architecture of the open-source clinical research chart from Informatics for Integrating Biology and the Bedside. AMIA Annual Symposium Proceedings: American Medical Informatics Association; 2007. p. 548. [PMC free article] [PubMed] [Google Scholar]
- 17.Ananthakrishnan AN, Cai T, Savova G, Cheng S-C, Chen P, Perez RG, et al. Improving case definition of Crohn’s disease and ulcerative colitis in electronic medical records using natural language processing: a novel informatics approach. Inflammatory bowel diseases. 2013;19:1411–20. doi: 10.1097/MIB.0b013e31828133fd. [DOI] [PMC free article] [PubMed] [Google Scholar]
- 18.Vanderbilt University Biomedical Language Processing Lab.
- 19.Fleiss JL, Levin B, Paik MC. Statistical Methods for Rates and Proportions. Wiley; 2004. [Google Scholar]
- 20.Weber G. How many patients are “normal”? Only 1.55%. Proceedings of the American Medical Informatics Association Summit on Clinical Research; San Francisco, CA. 2013. p. 79. [Google Scholar]
Associated Data
This section collects any data citations, data availability statements, or supplementary materials included in this article.