

Abstract
Complex cognitive processes require neuronal activity to be coordinated across multiple scales, ranging from local microcircuits to cortex-wide networks. However, multiscale cortical dynamics are not well understood because few experimental approaches have provided sufficient support for hypotheses involving multiscale interactions. To address these limitations, we used, in experiments involving mice, genetically encoded voltage indicator imaging, which measures cortex-wide electrical activity at high spatiotemporal resolution. Here we show that, as mice recovered from anesthesia, scale-invariant spatiotemporal patterns of neuronal activity gradually emerge. We show for the first time that this scale-invariant activity spans four orders of magnitude in awake mice. In contrast, we found that the cortical dynamics of anesthetized mice were not scale invariant. Our results bridge empirical evidence from disparate scales and support theoretical predictions that the awake cortex operates in a dynamical regime known as criticality. The criticality hypothesis predicts that small-scale cortical dynamics are governed by the same principles as those governing larger-scale dynamics. Importantly, these scale-invariant principles also optimize certain aspects of information processing. Our results suggest that during the emergence from anesthesia, criticality arises as information processing demands increase. We expect that, as measurement tools advance toward larger scales and greater resolution, the multiscale framework offered by criticality will continue to provide quantitative predictions and insight on how neurons, microcircuits, and large-scale networks are dynamically coordinated in the brain.
Keywords: anesthesia, circuit dynamics, genetically encoded, mouse, optical imaging, voltage imaging
Introduction
Neuronal activity in the cortex is coordinated across multiple scales, ranging from local microcircuits to cortex-wide networks (Von der Malsburg et al., 2010). Such multiscale integration is required for complex cognitive processes, but a unified theoretical framework that accounts for multiple scales remains a challenging and unmet goal for systems neuroscience. A promising possibility is offered by the theory of criticality, which posits that cortical networks maintain multiscale coordination by operating at the boundary of two distinct dynamical regimes: one dominated by small-scale (local) interactions, and another in which large-scale synchronization across cortical areas prevails (Plenz and Niebur, 2014). By operating near this regime boundary, i.e., at the critical point of a nonequilibrium phase transition (Bak, 1996; Henkel et al., 2008), the cortex is hypothesized to gain the best of both regimes—large-scale and small-scale dynamical interactions as well as coordination among intermediate scales. More specifically, the theory of criticality predicts that certain rules governing neural interactions are unchanged when considered at different scales, i.e., they are scale invariant (Bak, 1996; Sethna et al., 2001). However, current electrophysiological recording techniques are only able to cover either large spatial scales [electroencephalogram (EEG), electrocorticogram (ECoG)], medium scales (multielectrode arrays), or small (cellular) scales (single-unit recordings). Due to the restricted scale coverage of these measurement tools, no previous studies have tested the prediction that coordination of neural activity is scale invariant at criticality.
Previous in vitro experiments (small scale: Beggs and Plenz, 2003; Shew et al., 2009, 2011; Tetzlaff et al., 2010; Friedman et al., 2012) and brain imaging studies (large scale: Tagliazucchi et al., 2012; Haimovici et al., 2013; Yu et al., 2013) provide evidence for other aspects of criticality, including experimentally confirmed predictions of optimal information processing (Shew and Plenz, 2013). These studies suggest that the intact, awake cortex might operate at criticality to take advantage of the associated optimized processing capabilities. However, criticality remains controversial in the awake state due to conflicting reports of small-scale cortex electrophysiology (Petermann et al., 2009; Ribeiro et al., 2010; Touboul and Destexhe, 2010; Dehghani et al., 2012).
Here we address two main questions. First, how does evidence for criticality depend on cortical state changes as mice recover from anesthesia? Second, are coordination of microscale, mesoscale, and macroscale cortex dynamics governed by scale-invariant principles? To address these questions, we imaged cortex-wide coordinated activity of layer 2/3 pyramidal cells using a genetically encoded voltage indicator while mice recovered from barbiturate anesthesia. We found that multifaceted evidence consistent with criticality, including scale-invariant patterns of activity, emerged during recovery from anesthesia. In contrast, we found that the cortical dynamics of anesthetized mice were not scale invariant, but rather displayed typically large-scale coordination.
Materials and Methods
Animal preparation.
Animal experiments were performed in accordance with the National Institutes of Health guidelines for animal research and were approved by the Institutional Animal Care and Use Committees of the RIKEN Wako Research Center (Japan). Mouse embryos at embryonic day (E) 14.5 to E15.5 were electroporated in utero with the pCAG-VSFP Butterfly 1.2 plasmid (Akemann et al., 2012), as described previously (Akemann et al., 2013), except that the electroporation procedure was repeated three times, resulting in expression of the voltage indicator Butterfly 1.2 in layer 2/3 pyramidal cells in a large part of one cortical hemisphere. The skull was thinned to form a cranial window over the left hemisphere and a head post was implanted in adult (2–6 months old and of either sex) in utero electroporated mice under surgical pentobarbital anesthesia, as described previously (Akemann et al., 2012, 2013). Mice recovered from surgery for ≥3 d before being reanesthetized with pentobarbital (80 mg/kg, i.p.) and being head-fixed via an implanted head post in a custom-made stereotaxic frame with body temperature maintained at 37°C by means of a feedback-controlled heat pad (Fine Science Tools).
Imaging.
Transcranial imaging of Butterfly 1.2 was performed using Leica PlanAPO 1.0 and Leica PlanAPO1.6 lenses and two synchronized CCD cameras (Sensicam, PCO; Akemann et al., 2010). Excitation light was supplied by a high-power halogen lamp (Moritex, Brain Vision). The optics included the following optical filters: FF01-483/32-25 for mCitrine excitation (Semrock), FF01-542/27-25 for mCitrine emission (Semrock), BLP01-594R-25 for mKate2 emission (Semrock), FF506-Di03-25x36 (Semrock) as an excitation beamsplitter, FF593-Di03-25x36 (Semrock) as a detection beamsplitter. Twenty minutes after drug delivery, image sequences of 60 s duration and ∼60 s pauses (used to save image data on hard disk) were acquired at 50 fps, 320 × 240 pixel resolution, using custom acquisition macros under ImagePro 6.2. A pixel captured a projected cortical area of 33 × 33 μm. Independent measures of brain state were obtained by simultaneously recording EEG activity using an electrode placed on the contralateral skull. Chest wall movements were monitored using an optoelectronic sensor.
Data analysis.
Imaging data were analyzed with Matlab 7 using the Image and Signal Processing Toolboxes (Mathworks) and ImagePro 6.2 image processing software. The voltage imaging ratio images (R/R0) were obtained by dividing the FRET acceptor (mKate2) by the FRET donor mCitrine fluorescence intensity values, which were taken after offset subtraction and equalization of heartbeat-related modulation of fluorescence (Akemann et al., 2012) and subsequent normalization by the average ratio over the duration of the recording. Image sequences were spatially and temporally smoothed as described previously (Akemann et al., 2012), and high-pass filtered at 0.5 Hz (results consistent from 0.1 to 1 Hz). The first 10 s of each sequence were discarded to remove any contribution from environmental cues related to the start of an imaging sequence (e.g., shutter noise, excitation light). Subsequent analyses were conducted for pixels within masks, drawn by hand for each mouse, which defined the extents of the cranial window and the voltage indicator-expressing regions.
Cascade detection.
Cascade detection was performed as described by Tagliazucchi et al. (2012). As illustrated in Figure 1, for each pixel, time points of activation were defined at times when the preprocessed voltage imaging time course (ratio value) crossed above a threshold of +1 SD from below (results consistent from +0.5 to +1.5 SD). This was calculated for separate image sequences, normalizing each pixel time course by subtracting the mean and dividing by the SD. Cascades were detected as spatiotemporally contiguous clusters of active pixels (Tagliazucchi et al., 2012). Clusters of active pixels were identified in each frame, based on the detection of connected pixels in a coactive first neighbors graph. For each image sequence, cluster size probability distributions were calculated by counting the frequency of cluster sizes and dividing each sum by the total number of clusters. Cascades were then defined as starting with the activation of a previously inactive cluster, continuing while ≥1 contiguous cluster was active in the next time point. Cascade size probability distributions were calculated in a similar way to cluster size distributions.
Figure 1.
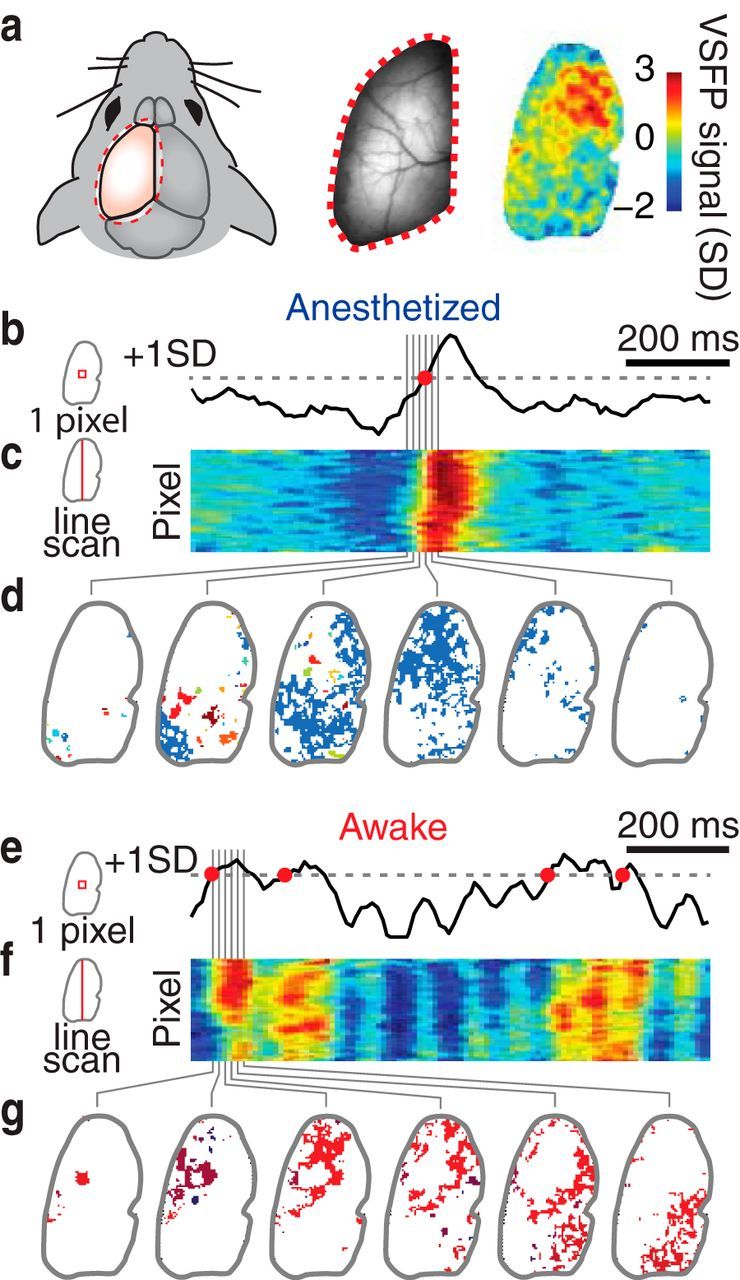
Measuring multiscale cascades of cortical neuronal dynamics in resting and anesthetized mice. a, Voltage imaging in a head-fixed mouse with transcranial window (left), baseline fluorescence image (middle), and map of voltage-sensitive fluorescent protein (VSFP) signal for a 20 ms snapshot, scaled as multiples of signal SD. b–d, Data from an anesthetized mouse. e–g, Data from a mouse in the resting wakefulness state. b, e, Voltage imaging traces from one pixel (33 × 33 μm cortical area). A pixel is considered to be active at times when the signal crosses a threshold from below (red circles). c, f, Voltage signals from a vertical line of pixels reveal spatiotemporally contiguous activity, color code as in a. d, g, Consecutive snapshots of cascades of active pixels during a 120 ms period. Each cascade has been labeled with a unique color.
κ Statistics.
Cascade size probability distributions were compared with a power law with exponent −1.5 using a measure, κ (Shew et al., 2009; Yang et al., 2012). When computing κ, cascades below a minimum size, xmin, were excluded. The rationale for this is that some measurement noise is inevitable and likely to be uncorrelated across pixels, resulting in some small “noise cascades.” We chose xmin to be 5% (but confirmed consistency of results between 1 and 10%) of the largest observed cascade size for each mouse within each recording, constrained to within 5 ≤ xmin ≤ 50.
Control data.
Analyses of the imaging data were repeated after temporal shuffling of single-pixel time courses relative to each other using random offset circular permutation. The analyses were also repeated for noise that was generated for each pixel with the same power spectrum as the data.
Statistical validity of power-law cascade size distributions in the resting state.
In addition to κ statistics, a second method was used to measure deviation from power-law form. The first step was to compute the maximum likelihood, best-fit, truncated power law P(s) = s−τ/. The fitting parameters were the exponent τ, the lower truncation bound x0, and the upper truncation bound xM. As in previous studies (Langlois et al., 2014), the truncated power law was chosen because of the clear exponential cutoff in the tail (see Results). The upper truncation bound xM was defined as the largest size for which KS < 0.01, where KS is the Kolmogorov–Smirnov statistic between the data and the fitting function. The number of orders of magnitude of the power law was defined as log10 (xM/x0). The next step was to quantify goodness of fit. For this, 100 surrogate datasets were drawn from the distribution P(s) = s−τ+ϵ(s)/, where epsilon(s) is a Gaussian distributed random variable with zero mean and variance σ2. For σ = 0, the surrogate data are drawn from a perfect power law. We interpret σ ≠ 0 as a model distribution that deviates from a perfect power law by (100 × σ)% (e.g., σ = 0.02 is 2% deviation). We increased σ until ≥10 of the surrogate datasets had KSsur > KSdata (equivalent to Clauset's p > 0.1 criterion; Clauset et al., 2009).
Regional κ variation.
To study regional variation of κ, cascade detection was performed separately on 5 × 5 pixel subregions of the image. Cascade size probability distributions and corresponding κ values were calculated for each subregion. Maps of all regional κ values were plotted. For each map, the SDs of κ values were calculated along with the coefficients of variation. To account for the possibility that a change in the number of avalanches over time affected the calculation of κ, we repeated the calculation of κ for each region and time point based on Nmin randomly selected avalanche sizes, where Nmin was the smallest number of avalanches occurring in that region over all examined time windows.
κ dependence on spatial resolution.
To study the way in which κ depends on spatial resolution, images were progressively spatially averaged using a range of scales spanning four orders of magnitude. Cascade detection was then repeated for each level of averaging, thereby obtaining κ values at each resolution. The data were progressively scaled with linear scale factors from 1.0× (i.e., full resolution) to 0.025×, at 15 logarithmically spaced intervals. The probability distributions generated for the different resolutions were then rescaled as described in detail by Klaus et al. (2011).
Analysis of fast fluctuations to reveal a phase transition.
To provide additional support for our hypothesis, we quantified the tendency of active pixels to cluster together at short time scales (single imaging frame) as described by Tagliazucchi et al. (2012). We plotted the size of the largest cluster (normalized by the total number of pixels) as a function of the number of active pixels at each time point. In the context of statistical physics, the largest cluster size can be interpreted as the order parameter of the system, while the control parameter is the number of active pixels. In this context, the sharp onset of the order parameter as the control parameter is increased indicates a phase transition. To determine what value of the control parameter occurs most often, we examined the residence time distribution—the occurrence frequency for each value of the control parameter. In addition, to provide further comparison with the findings of Tagliazucchi et al. (2012), we calculated the variance of the order parameter.
Results
Transcranial voltage imaging of mouse cortex reveals cascades of neuronal activity
To measure cortical dynamics during recovery from anesthesia (pentobarbital, 80 mg/kg, i.p.) in head-fixed mice (n = 3), we performed transcranial voltage imaging using a voltage-sensitive fluorescent protein expressed in layer 2/3 pyramidal cells (Fig. 1a; Akemann et al., 2010, 2012). This wide-field epifluorescence imaging approach captures the membrane voltage averaged over tissue volumes that are projected onto each pixel of the imaging device. This allows us to record neuronal activity across a large portion of one cortical hemisphere with high spatiotemporal resolution (in the present study, <100 μm, 20 ms; Akemann et al., 2012). Optical voltage signals, spatially averaged over the imaged cortex [optical ECoG (oECoG)], correlate with the EEG trace and exhibit brain state-dependent power spectra (Akemann et al., 2012).
We recorded 60 s sequences of activity, repeated at 1 min intervals for up to a total of 200 min, as mice recovered from anesthesia toward the awake resting state. Brain state was monitored using EEG and oECoG recordings (Akemann et al., 2012), which showed well-described slow-wave (“delta” frequency band, 0.1–4 Hz) activity during moderate levels of anesthesia (similar to slow-wave sleep) and, with recovery, prominent “theta” (4–11 Hz) activity (Fig. 2). Recovery from anesthesia was further indicated by a prominent peak ∼5 Hz in the ECG and oECoG power spectra, an electrophysiological signature of the cortex in a state that has been termed resting or quiet wakefulness (Petersen et al., 2003; Poulet and Petersen, 2008; Sachidhanandam et al., 2013). In this state, mice do not exhibit spontaneous motor behavior but arousal by sensory stimuli (auditory, tactile, or visual) triggers coordinated movements and whisking (Sachidhanandam et al., 2013; our observations). In this study, we collected data from the anesthetized-to-awake resting (quiet) state with prominent θ (∼5 Hz) activity, to avoid any ambiguity of signal interpretation associated with potential movement artifacts or network synchronization imposed by isolated external stimuli (Petersen et al., 2003; Poulet and Petersen, 2008).
Figure 2.
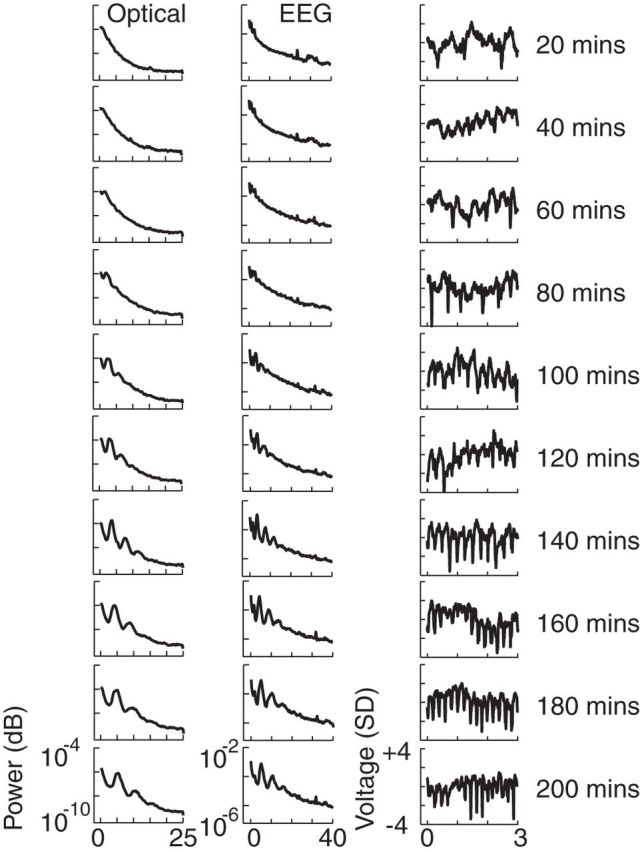
EEG and oECoG power spectra and waveforms during recovery from anesthesia. Power spectra from (left column) single-electrode EEG and (middle column) optical voltage signals, spatially averaged over the imaged cortex (oECoG) are shown for 20 min periods. Example 3 s oECoG waveforms (right column) taken from each period are shown. Data presented are for one mouse but similar changes during recovery from anesthesia were seen in all mice (n = 3).
Across all brain states, in the voltage imaging recordings we observed neuronal activity in the form of cascades of spatiotemporally contiguous patterns (Movie 1). These cascades ranged in spatial and temporal extent from locally isolated and short-lived bursts to larger wave-like propagation. Small cascades were observed more often than large cascades across all brain states, but the cortex of anesthetized mice often exhibited large cascades of activity that spread across the entire imaged cortex. As the mice recovered from anesthesia, large cascades occurred progressively less often.
Voltage imaging of mouse cortex reveals cascades of spatiotemporally contiguous patterns of neuronal activity. Transcranial voltage imaging of mouse cortex was performed during recovery from anesthesia. Neuronal activity was observed in the form of cascades of spatiotemporally contiguous patterns (left column, cool and warm colors represent hyperpolarization and depolarization, respectively). Small, locally isolated and short-lived cascades were observed more often than large cascades across all brain states, but the cortex in the anesthetized state (top row, 20 min after drug delivery) often exhibited large cascades of activity that spread across the imaged cortex. To define cascades of activity, we used the voltage signal to identify times at which the local activity crosses above a threshold from below (right column).
Scale-invariant neuronal activity emerges with recovery from anesthesia
To better characterize the diversity of cascades, we examined the distribution of cascade sizes for each 60 s recording. The spatiotemporal extent of a cascade was defined via a thresholding method similar to previous studies of cascade-like neuronal activity in local field potentials (LFPs), EEG, and functional MRI (fMRI; Beggs and Plenz, 2003; Petermann et al., 2009; Tagliazucchi et al., 2012; Meisel et al., 2013). We used the voltage imaging time course at each pixel to identify times at which local activity crossed above a threshold from below (Fig. 1b,e). Such positive deflections in the optical signal represent population depolarization and are known to correlate with the negative deflections in LFP recordings (Okun et al., 2010). A cascade was defined as a spatiotemporally contiguous group of active pixels (Fig. 1c–g), i.e., two active pixels that are nearest neighbors in space and time belong to the same cascade. As in previous studies (Tagliazucchi et al., 2012), this approach allows for the detection of multiple co-occurring cascades at different locations. This is expected for large-scale networks and was not considered in small-scale electrophysiology studies, which assumed that only one cascade exists at any given time (Beggs and Plenz, 2003; Petermann et al., 2009; Shew et al., 2009, 2011; Okun et al., 2010; Ribeiro et al., 2010). We define the size of a cascade, z, as the number of active pixels comprising the cascade. In all recordings, large cascades occurred with probability Pr(z) far greater than expected by chance (Fig. 3a), indicating that multiscale coordination is required to generate such cascades. As the mice recovered, the distribution of cascade sizes gradually evolved toward a scale-invariant form, i.e., a power-law Pr(z) ∼ z−k (Fig. 4). Previous studies report similar bursts of activity, termed neuronal avalanches, whose size distribution can be approximated by a power law (Beggs and Plenz, 2003; Petermann et al., 2009; Tagliazucchi et al., 2012; Meisel et al., 2013). The emergence of a power-law distribution of cascade sizes with recovery from anesthesia is of interest, as it is one of the defining features of a system operating near criticality (Shew and Plenz, 2013). Theory, as well as mounting evidence from computational models and experiments, suggests that a power-law exponent of k = −1.5 is expected for critical neural networks (Larremore et al., 2012; Shew and Plenz, 2013). In this context, the prevalence of large cascades observed in the anesthetized state may be indicative of a supercritical system, in which neural interactions are imbalanced, favoring activity that tends to be amplified until it spans the whole system. Our experiments are the first to demonstrate that hallmarks consistent with criticality emerge during recovery from anesthesia.
Figure 3.
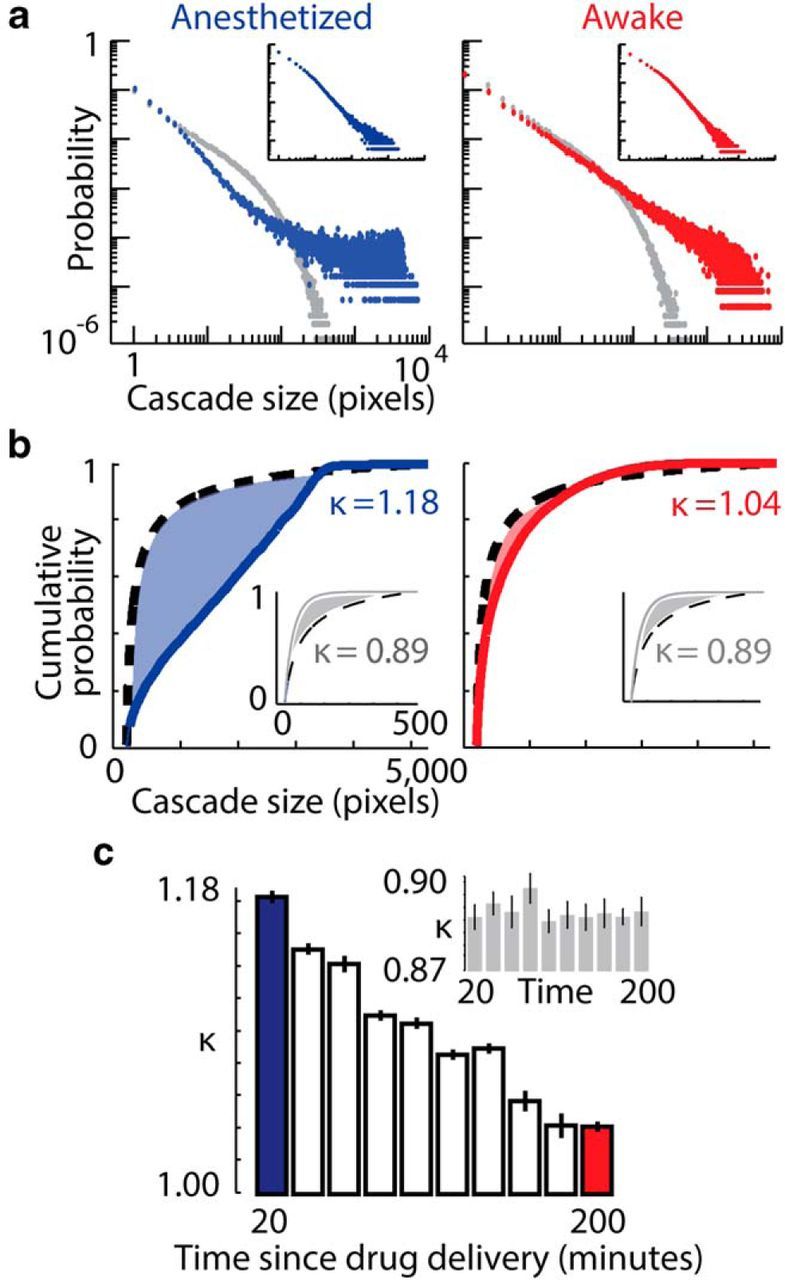
Cascade size probability distributions approach power-law form during recovery from anesthesia. a, Probability distribution of cascade sizes, in number of active pixels, in anesthetized (left, blue) and awake resting (right, red) states. Each data point represents the probability Pr(z) of observing a cascade of size z. Very large cascades were prevalent in the anesthetized state. The resting state mouse distribution is close to a power law. Gray points show probability distributions after randomized circular permutation of single pixel traces relative to each other, a control with no cross-pixel correlations. Data presented are for the 10 image sequences recorded over a 20 min period in anesthetized states (20–40 min) and in resting states (200–220 min) in one mouse. All mice (n = 3) exhibited the same trends from anesthetized to resting states (Fig. 4). Insets show cluster size distributions for the anesthetized and resting states. b, Cumulative probability distributions for anesthetized (left, blue) and resting (right, red) states. Deviations from a reference power law with exponent −1.5 (black dashed lines) are quantified by κ, which measures the gap (shaded area) between the measured distribution and the reference distribution. The closer κ is to 1, the closer the distribution is to the reference. Shuffled control distributions for both states showed similar deviation from the reference distribution, with κ < 1 (insets, gray). c, Values of κ calculated for image sequences recorded over 20 min periods, and shuffled data (inset, gray). Error bars represent SEM of 10 consecutive sequences.
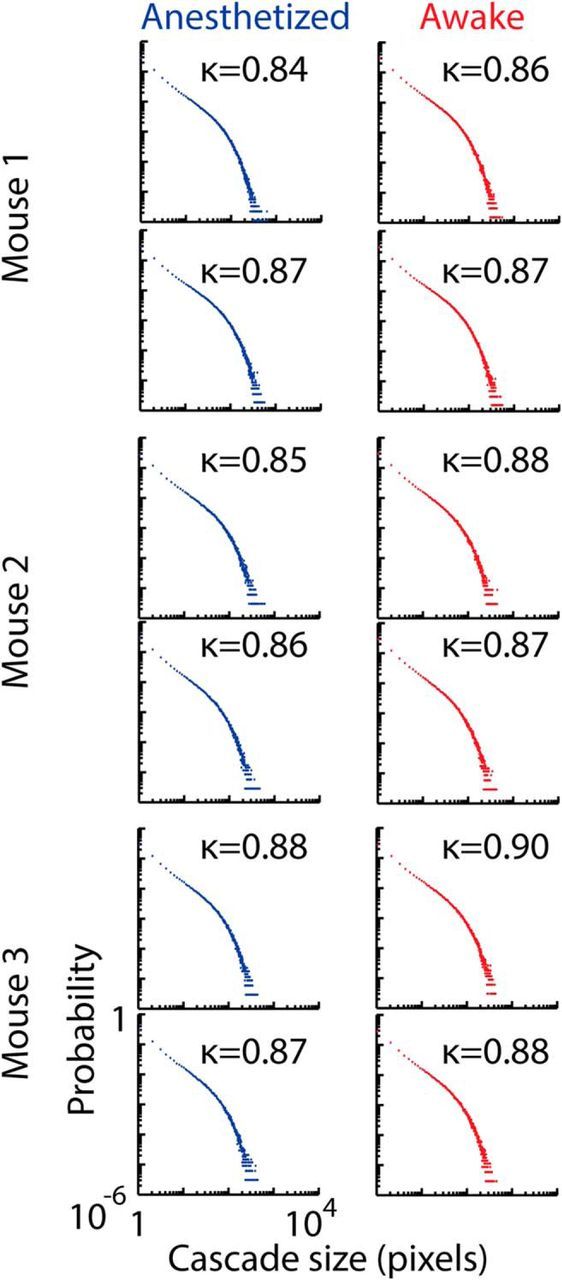
Figure 4.

Cascade size probability distributions approach power-law form during recovery from anesthesia. Probability distributions of cascade sizes, in number of active pixels, are shown for all mice from anesthetized (blue) to resting (red) states, calculated at 20 min intervals. Each data point represents the probability Pr(z) of observing a cascade of size z. Very large cascades were prevalent in the anesthetized state in all mice. The distributions approach power-law form with recovery from anesthesia. Data presented are for image sequences recorded over each 20 min period.
To quantitatively track the change in cascade statistics during recovery from anesthesia, we used a recently developed metric, known as κ. κ measures the deviation of cascade size distributions from the power-law form predicted for criticality (Shew et al., 2009). The closer κ is to 1, the closer the cascade size distribution is to a power law with exponent −1.5. Therefore, κ may be interpreted as a measure of how far a system is from criticality. In all mice, we observed a change in κ from >1 toward κ ≈ 1 during recovery from anesthesia (Figs. 3b,c, 4). We found a similar trend in the probability distributions of cluster sizes (Fig. 3a, inset). These findings were robust to a range of thresholds of the voltage imaging data used to define cascade activity (Fig. 5). We observed a significant difference in κ between anesthetized and resting wakefulness states in all mice (P1 < 10−8, P2 = 2.9 × 10⁻⁶, P3 = 1.9 × 10⁻⁷ for mouse 1, 2, and 3 respectively, two-sample t tests on κ calculated for anesthetized and resting state recordings). To verify the importance of spatiotemporal correlations in the imaging data with respect to cascade statistics, the analysis was repeated after each individual pixel's time course had been temporally shuffled using randomized circular permutation (Figs. 3a, 6). In addition, the analysis was performed for pixel-wise noise that had been generated with the same power spectrum as the data (Fig. 6). In these control datasets, κ was independent of brain state, with no significant difference in κ observed between anesthetized and resting state recordings (p > 0.4 in all cases, two-sample t tests).
Figure 5.
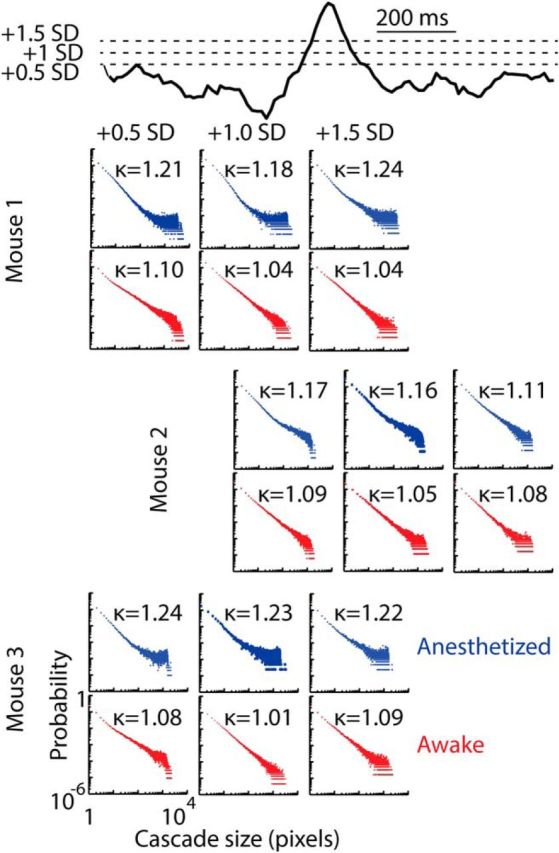
Cascade size probability distributions for a range of thresholds defining pixel activation. Probability distributions of cascade sizes, in number of active pixels, are shown for all mice in anesthetized (blue) and resting (red) states. Distributions are consistent across a range of thresholds of the voltage imaging data used to define pixel activation (+0.5 SD, green hashed box; +1 SD, orange box; +1.5 SD, purple box). Each data point represents the probability Pr(z) of observing a cascade of size z. For all thresholds, there is a prevalence of very large cascades in the anesthetized state, and resting mouse distributions approach power-law form. Deviations from a reference power law with exponent −1.5 are quantified by κ. The closer κ is to 1, the closer the distribution is to the reference. Data presented are for the 10 image sequences recorded over a 20 min period in anesthetized (20–40 min) and resting states (200–220 min).
Figure 6.
Cascade size probability distributions for control data. Probability distributions of cascade sizes, in number of active pixels, are shown for data from all mice in anesthetized (blue) and resting (red) states, performed after pixel-wise shuffling with random offset circular permutation (left column) and pixel-wise noise generated with the same power spectrum as the original data (right column). Each data point represents the probability Pr(z) of observing a cascade of size z. Both methods destroy both the power-law form of the distributions in the resting state, as well as the difference between the distributions. Deviations from a reference power law with exponent −1.5 are quantified by κ. The closer κ is to 1, the closer the distribution is to the reference. All control distributions showed similar deviation from the reference distribution with κ < 1. Data presented are for the 10 image sequences recorded over a 20 min period in anesthetized (20–40 min) and resting states (200–220 min).
Statistical validity of power-law cascade size distributions in the awake resting state
The shift from κ > 1 toward κ ≈ 1 quantifies the trend toward power-law cascade size distributions. However, the observation of κ ≈ 1 is not a statistically rigorous guarantee that the resting state distribution is well fit by a power-law function. To achieve this, we adapted previously used statistical tests based on maximum likelihood fitting and strict goodness-of-fit tests (Clauset et al., 2009). We found that the resting state cascade size distributions were well fit by a power law spanning 2.8 ± 0.2 orders of magnitude, beyond which an exponential cutoff was observed for very large cascades (Fig. 7). Our large sample sizes (n > 50,000 cascades) allowed us to quantitatively demonstrate that the resting data deviated by <2.6% ± 0.6% (mean ± SD) from a perfect power law (see Materials and Methods). To compare with previous studies with fewer samples, we also considered randomly chosen subsets of the data (n = 10,000 cascades). These subsets of cascade sizes in the resting state passed strict statistical tests for a power-law fit (Clauset et al., 2009). In contrast, and consistent with larger κ, the data from the anesthetized state were not well fit by a power law (Fig. 7). Considering the same range of sizes as the resting state data, the anesthetized distributions deviated from power law by 13% ± 3% (mean ± SD).
Figure 7.
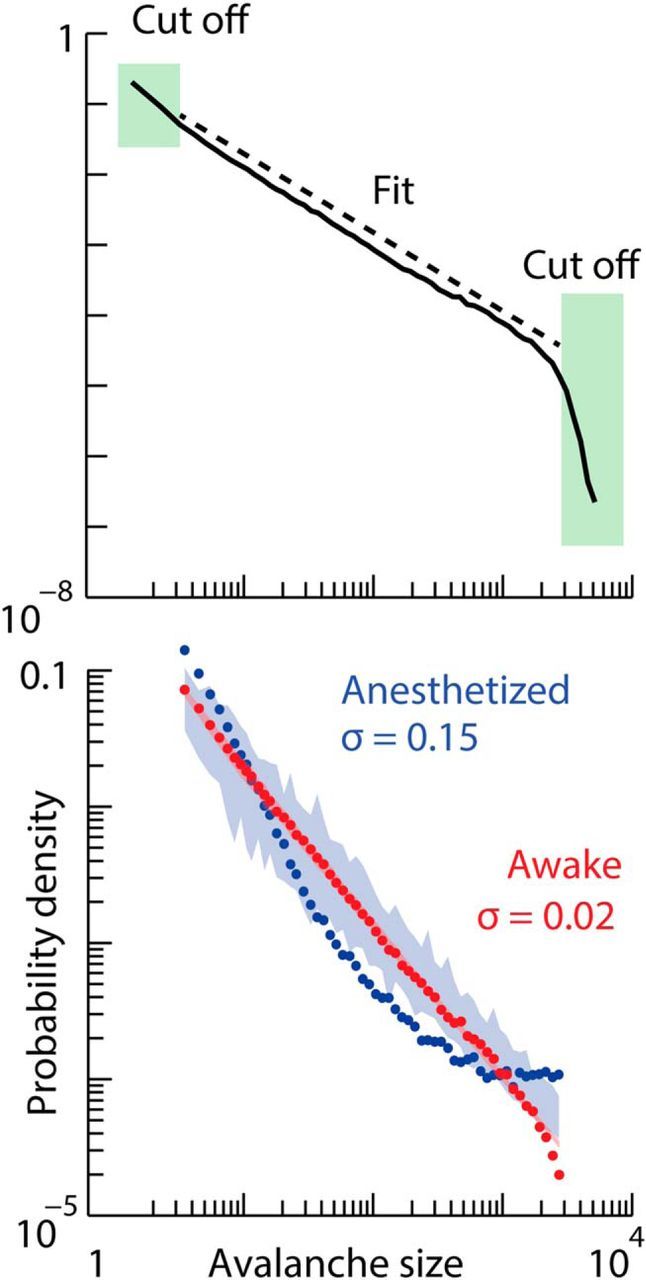
Power-law statistical tests in resting and anesthetized states. Top, The cascade size distribution in the most alert time period. This distribution was created with logarithmically spaced bins (20 bins per decade). The shaded boxes identify the truncated portions of the distribution as determined by the algorithm described in Materials and Methods. The dashed line is the maximum-likelihood fit power law over the untruncated range. Bottom, The truncated distribution from the top panel is shown by red points. The shaded pink region delineates the range of 100 surrogate distributions that deviate by σ = 2% from the perfect power law (top, dashed line). The distribution of cascade sizes in the anesthetized state is shown by blue points. This distribution is truncated with the same range as the resting distribution (red). The shaded blue region delineates the range of 100 surrogate distributions that deviate by σ = 15% from the perfect power law.
Regional differences replaced by scale invariance during recovery from anesthesia
Among the most important conceptual advances offered by the criticality hypothesis is the idea that dynamics are scale invariant at criticality, i.e., microscale dynamics are governed by the same principles that govern dynamics at the mesoscale and macroscale level (Bak, 1996; Sethna et al., 2001). One manifestation of this prediction is the power-law cascade size distributions discussed above. However, a more intuitive and direct test of scale invariance entails demonstrating that certain features of cortical dynamics remain unchanged when examined at different scales. Such tests require measurement tools with high spatiotemporal resolution, spanning a large fraction of the cortex. This has not been possible in previous experimental studies of neuronal dynamics, due to either insufficient spatial coverage (e.g., microelectrode arrays spanning ≈1–4 mm), or insufficient spatiotemporal resolution (e.g., fMRI studies can resolve ≈2 mm, 1 s). In the context of our experiments, one implication of scale invariance at criticality is that cascade size distributions should maintain the same form independent of scale, location, and resolution for mice in the resting state, but not for the anesthetized state. To test this, we first generated maps of κ values across the cortex by calculating separate values of κ for cascades detected within small subregions of the full field of view (each with area ≈0.2% of the total size of the imaged cortex; Fig. 8a). In anesthetized mice, these κ maps showed regional variations that seemed to delineate cortical anatomical structures (Fig. 8a). As mice recovered from anesthesia toward the resting state, all regions tended toward κ ≈ 1, and variation across κ maps decreased, as quantified by measurements of SD (Fig. 8b) and coefficient of variation. The same trend was observed when regional κ was calculated based on Nmin randomly selected avalanche sizes, where Nmin was the smallest number of avalanches occurring in a given region over all examined time windows.
Figure 8.
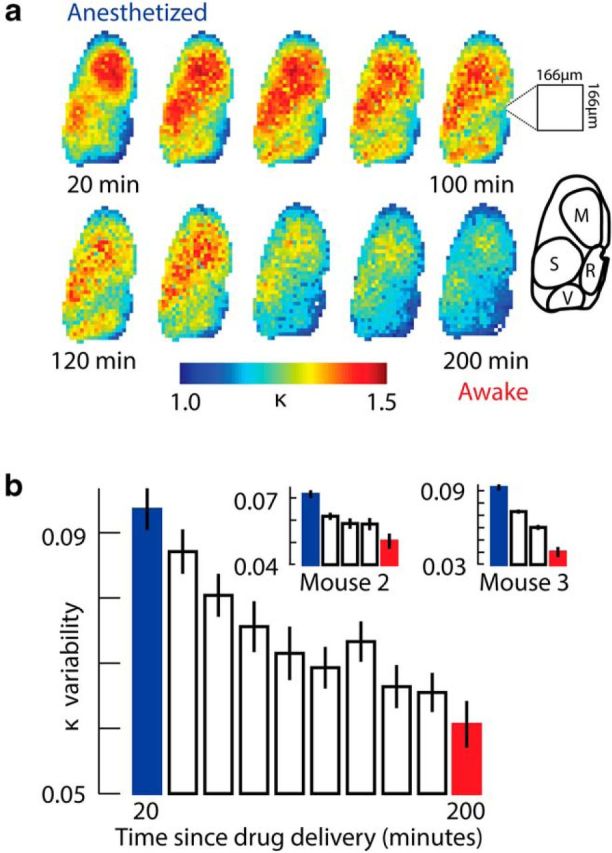
Regional variations in cascade statistics during recovery from anesthesia. a, Color-coded maps of κ values (computed for cascades occurring within 5 × 5 pixel subregions, each ≈0.2% of the imaged cortex) calculated at 20 min intervals. Maps in anesthetized mice seemed to delineate cortical anatomical structures. Inset map shows corresponding approximate locations of motor cortex (M), somatosensory cortex (S), retrosplenial cortex (R), and visual cortex (V). As mice recovered from anesthesia, all subregions tended toward κ ≈ 1. Data presented are for the mouse with the largest cranial window, but similar trends were seen in all mice (n = 3). b, Regional variability of κ values across the maps in a decreased with recovery from anesthesia. Inset shows corresponding data from the two other mice. Bar height is the mean SD of regional κ values, averaged across 10 consecutive 60 s recordings. Error bars represent SEM of the 10 recordings.
Scale-invariant neuronal activity spans four orders of magnitude
Next, we tested the dependence of κ on the spatial resolution of our voltage imaging data. We varied the resolution of the system over four orders of magnitude. To obtain coarser resolutions, we spatially averaged the imaging data in pixels of progressively larger area. We then detected cascades (Fig. 9a) and calculated κ statistics (Fig. 9b) for each level of resolution in anesthetized and resting mice. In the anesthetized state, Pr(z) deviated from a power-law relationship, and changes in κ correlated significantly with increasing resolution of the system for all mice (Pearson's r1 = −0.665, P1 = 0.005; r2 = −0.958, P2 = 0.002; r3 = −0.935, P3 = 2.2 × 10⁻⁸, for mouse 1, 2, and 3, respectively). However, as predicted for a system approaching criticality, in the resting state, κ remained ≈1 across all spatial resolutions, with no significant correlation between κ and resolution (p > 0.2 in all mice, Pearson's correlation). Another manifestation of scale invariance is that cascade distributions measured at different scales and resolutions may be collapsed onto a single functional form after appropriate rescaling of probabilities and cascade sizes (Klaus et al., 2011). As shown in the inset of Figure 9a, this collapse is possible in the awake resting state, but not in the anesthetized state. We conclude that scale-invariant activity was present only in resting state cortex, whereas dynamics were scale dependent under anesthesia.
Figure 9.
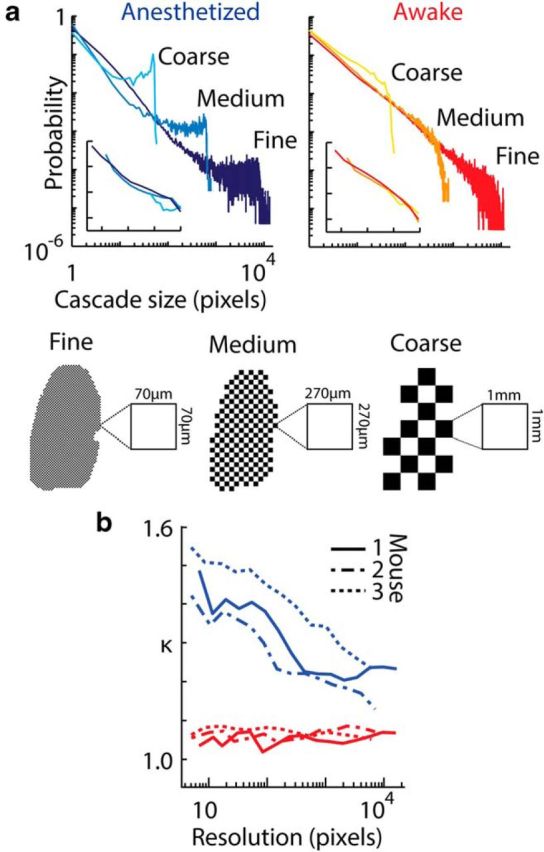
Scale invariance of cascade statistics is unique to the awake resting state. a, Voltage signals were spatially averaged at varying resolutions and cascade size distributions computed for image sequences in anesthetized (left) and resting (right) states. Data presented are for one mouse (full resolution cranial window, 15,676 pixels) but similar results were seen in all mice (n = 3). Distributions are shown for three levels of spatial averaging: fine (3971 pixels), medium (290 pixels), and coarse (21 pixel resolution). Levels of spatial averaging are illustrated for each resolution as black and white grids. The physical area of a single pixel (33 × 33 μm cortical area) is shown for each resolution. In the resting state (red tones, right), all distributions shared power law-like form, except for a maximum size above which the probability falls, due to the limiting size of the system in each case. In contrast, in the anesthetized state (left, blue tones), the shape of the probability distributions deviated from a power law, with a higher probability of larger cascade sizes. Insets show rescaled plots with binned distributions (as described in Materials and Methods). b, κ Values of cascade size distributions plotted as a function of spatial resolution of the voltage imaging data, ranging over four orders of magnitude. Data are presented for all three mice. In the resting state (red lines), κ does not change significantly as resolution increases, while in the anesthetized state, κ changes appreciably with resolution (see text).
Fast fluctuations reveal additional evidence consistent with criticality
The slow transition (over ∼10s of minutes) toward scale-invariant cascade statistics (Figs. 2, 3) suggests a shift in cortical dynamics toward criticality during recovery from anesthesia. If the awake resting cortex is indeed operating near criticality, then additional evidence for this may be found by examining faster fluctuations (∼101–102 ms). Averaged over long periods, a system at criticality resides at a relatively sharp boundary between two regimes: one dominated by large scales, the other by small scales. Fast fluctuations about the average can reveal the sharpness of this boundary, thus providing additional evidence consistent with the criticality hypothesis. In the context of our measurements and previous work (Tagliazucchi et al., 2012), snapshots of active pixels are expected to exhibit large connected clusters on one side of the boundary and small disconnected clusters on the other side. Our results confirmed this expectation (Fig. 10). Similar to the findings of Tagliazucchi et al. (2012), we found that cortical dynamics operated between a large-cluster and small-cluster regime, with a sharp transition between the two and an associated increase in variability (Fig. 10a). Second, as mice recovered from anesthesia, the cortex spent less time in the large-scale regime, consistent with a shift toward criticality (Fig. 10b). Importantly, these observations provide additional support for our hypothesis, which does not depend on the spatiotemporal definition of cascades or on power-law statistics.
Figure 10.

Fast fluctuations reveal boundary between small-scale and large-scale dynamical regimes. a, The (normalized) size of the largest cluster at each time point (the order parameter) is plotted as a function of the number of active pixels (green circles; average, green line) for the awake resting state. The onset between 102 and 103 reveals the boundary between small-scale and large-scale regimes. The awake resting state spends the most time close to the boundary (red line, residence time distribution). Data presented are for one mouse, and similar results were seen in all mice (n = 3). Inset shows the variance of the order parameter. b, Residence time distributions in anesthetized (blue) and resting (red) states, for all mice. In the anesthetized state, the mice spend more time in the large cluster regime. The distribution for shuffled data (pixel-wise circular permutation) is shown in gray.
Discussion
Using optical imaging of a genetically encoded voltage indicator expressed in neurons in layer 2/3 of the mouse cortex, we have shown that multifaceted signatures of critical cortical dynamics emerge during recovery from anesthesia. Previous studies have shown evidence consistent with criticality in the cortex, either at the small scales of electrophysiology (Petermann et al., 2009; Ribeiro et al., 2010; Shew et al., 2011) or at the large scales of fMRI (Kitzbichler et al., 2009; Tagliazucchi et al., 2012; Haimovici et al., 2013), EEG (Linkenkaer-Hansen et al., 2001; Meisel et al., 2013), and MEG (Linkenkaer-Hansen et al., 2001; Shriki et al., 2013). Electrophysiological studies in monkeys (Petermann et al., 2009; Shew et al., 2011) and rats (Ribeiro et al., 2010) have typically used microelectrode arrays spanning 1–4 mm of cortex with a spatial resolution determined by the spacing between electrodes (≈200–500 μm). In contrast, human studies are either not yet able to achieve sufficiently fine spatial resolution (EEG, MEG) or else lack the temporal resolution (fMRI) to assess multiple scales of cortical dynamics. Our experiments bridge the gap between these small-scale and large-scale measurement techniques and maintain high spatiotemporal resolution over a broad range of scales. It is by virtue of our multiscale imaging technique that we were able to demonstrate the emergence of scale-invariant cortical dynamics, spanning four orders of magnitude, during recovery from anesthesia.
Given the similarities between anesthesia and sleep, our results are compatible with a recent EEG study that demonstrated that human brain dynamics deviate from criticality (i.e., toward κ > 1) with sleep deprivation (Meisel et al., 2013). However, in anesthetized and awake animals, the evidence for critical dynamics is somewhat inconsistent across different species and across previous studies (Gireesh and Plenz, 2008; Hahn et al., 2010; Ribeiro et al., 2010; Klaus et al., 2011). Our results offer an explanation of these apparent discrepancies. Specifically, we show that in different small-scale patches of cortex, like those studied using microelectrode array electrophysiology, the network dynamics may be nearer to or further from criticality (Fig. 8). This variability across the cortex diminishes as the animal recovers from anesthesia, but still may explain why some awake studies found support for the criticality hypothesis while others did not.
Anesthetics alter the balance of excitation and inhibition in neural networks (Schulz and Macdonald, 1981; Nicoll et al., 1990; Populin, 2005; Alkire et al., 2008) and measures of criticality are sensitive to the balance of excitation and inhibition (Haldeman and Beggs, 2005; Shew et al., 2011; Yang et al., 2012). These observations are consistent with our results, which demonstrate that sufficiently deep pentobarbital anesthesia precludes critical dynamics.
The awake resting state can be subdivided into different levels of vigilance (Petersen et al., 2003; Poulet and Petersen, 2008; Sachidhanandam et al., 2013). Here, toward the end of the recording periods, we captured mice in a state of resting (quiet) wakefulness, characterized by slow-wave activity with a prominent peak of ∼5 Hz in the power spectrum of LFP, EEG, and oECoG recordings (Petersen et al., 2003). We have not investigated cortical circuit dynamics during active behavior, a state that is characterized by reduction of slow-wave activity and appearance of higher frequencies in LFP power spectra (Poulet and Petersen, 2008; Sachidhanandam et al., 2013). Further studies will be required to establish the relationship between the level of awake vigilance (e.g., execution of cognitive functions) and circuit dynamics described in the framework of criticality.
A limitation of our study was that only a single anesthetic drug was studied. Different drugs may show different effects on cortical dynamics and this remains a future project to be undertaken using our experimental framework. However, our intention here was not to study different forms of anesthesia per se, but rather to use anesthesia as a perturbative mechanism, allowing us to observe the evolution of cortical dynamics toward a critical regime. To aid interpretation of this recovery from anesthesia, we included EEG and oECoG data, which are used to assess the state of wakefulness.
One reason that previous claims of criticality in the brain have been controversial has been the lack of spatial resolution and scale of microelectrode arrays and similar experimental techniques. Our imaging technique allows, for the first time, cortical dynamics to be investigated over four orders of magnitude in vivo. Further controversy has centered on the dependence on power-law distributions of population event size distributions as a signature of criticality in neural systems. To address this concern, the following observations provide further support for the criticality hypothesis, independent of power laws: (1) scale invariance of cascade statistics (Fig. 9), (2) resolution invariance of cascade statistics (Fig. 8), and (3) demonstration of fluctuations around a sharp onset (Fig. 10).
Previous studies have shown that certain aspects of information processing are optimized at criticality (Shew and Plenz, 2013). In contrast to the anesthetized cortex, the awake resting cortex is prepared for unexpected and complex information processing tasks. It stands to reason that during the emergence from anesthesia, criticality arises to meet this requirement. Another intriguing implication of our findings, related to scale-invariant cortical neuronal activity, is that the neural dynamics of different species may use the same governing principles simply scaled up or down to fit the size of their cortex. As measurement techniques push toward whole-brain studies with single-cell resolution, there is a growing need for quantitative conceptual frameworks that are able to account for the multiscale nature of cortical function. Our work suggests that multiscale interactions in the mammalian cortex are scalable and follow simpler rules than previously thought: those of critical dynamics.
Footnotes
This work was supported by the Wellcome Trust and GlaxoSmithKline (G.S.), the National Institute for Health Research (D.J.S.), and RIKEN, Japan (H.M., T.K.). We thank Nisha Jose for assistance with in utero electroporation.
The authors declare no competing financial interests.
This is an Open Access article distributed under the terms of the Creative Commons Attribution License (http://creativecommons.org/licenses/by/3.0), which permits unrestricted use, distribution and reproduction in any medium provided that the original work is properly attributed.
References
- Akemann W, Mutoh H, Perron A, Rossier J, Knöpfel T. Imaging brain electric signals with genetically targeted voltage-sensitive fluorescent proteins. Nat Methods. 2010;7:643–649. doi: 10.1038/nmeth.1479. [DOI] [PubMed] [Google Scholar]
- Akemann W, Mutoh H, Perron A, Park YK, Iwamoto Y, Knöpfel T. Imaging neural circuit dynamics with a voltage-sensitive fluorescent protein. J Neurophysiol. 2012;108:2323–2337. doi: 10.1152/jn.00452.2012. [DOI] [PubMed] [Google Scholar]
- Akemann W, Sasaki M, Mutoh H, Imamura T, Honkura N, Knöpfel T. Two-photon voltage imaging using a genetically encoded voltage indicator. Sci Rep. 2013;3:2231. doi: 10.1038/srep02231. [DOI] [PMC free article] [PubMed] [Google Scholar]
- Alkire MT, Hudetz AG, Tononi G. Consciousness and anesthesia. Science. 2008;322:876–880. doi: 10.1126/science.1149213. [DOI] [PMC free article] [PubMed] [Google Scholar]
- Bak P. How nature works: the science of self-organized criticality. New York: Copernicus; 1996. [Google Scholar]
- Beggs JM, Plenz D. Neuronal avalanches in neocortical circuits. J Neurosci. 2003;23:11167–11177. doi: 10.1523/JNEUROSCI.23-35-11167.2003. [DOI] [PMC free article] [PubMed] [Google Scholar]
- Clauset A, Shalizi CR, Newman ME. Power-law distributions in empirical data. SIAM Rev. 2009;51:661–703. doi: 10.1137/070710111. [DOI] [Google Scholar]
- Dehghani N, Hatsopoulos NG, Haga ZD, Parker RA, Greger B, Halgren E, Cash SS, Destexhe A. Avalanche analysis from multielectrode ensemble recordings in cat, monkey, and human cerebral cortex during wakefulness and sleep. Front Physiol. 2012;3:302. doi: 10.3389/fphys.2012.00302. [DOI] [PMC free article] [PubMed] [Google Scholar]
- Friedman N, Ito S, Brinkman BA, Shimono M, DeVille RE, Dahmen KA, Beggs JM, Butler TC. Universal critical dynamics in high resolution neuronal avalanche data. Phys Rev Lett. 2012;108:208102. doi: 10.1103/PhysRevLett.108.208102. [DOI] [PubMed] [Google Scholar]
- Gireesh ED, Plenz D. Neuronal avalanches organize as nested theta- and beta/gamma-oscillations during development of cortical layer 2/3. Proc Natl Acad Sci U S A. 2008;105:7576–7581. doi: 10.1073/pnas.0800537105. [DOI] [PMC free article] [PubMed] [Google Scholar]
- Hahn G, Petermann T, Havenith MN, Yu S, Singer W, Plenz D, Nikolic D. Neuronal avalanches in spontaneous activity in vivo. J Neurophysiol. 2010;104:3312–3322. doi: 10.1152/jn.00953.2009. [DOI] [PMC free article] [PubMed] [Google Scholar]
- Haimovici A, Tagliazucchi E, Balenzuela P, Chialvo DR. Brain organization into resting state networks emerges at criticality on a model of the human connectome. Phys Rev Lett. 2013;110:178101. doi: 10.1103/PhysRevLett.110.178101. [DOI] [PubMed] [Google Scholar]
- Haldeman C, Beggs JM. Critical branching captures activity in living neural networks and maximizes the number of metastable states. Phys Rev Lett. 2005;94 doi: 10.1103/PhysRevLett.94.058101. 058101. [DOI] [PubMed] [Google Scholar]
- Henkel M, Hinrichsen H, Lübeck S. Non-equilibrium phase transitions. Dordrecht, Netherlands: Springer Science and Business Media; 2008. [Google Scholar]
- Kitzbichler MG, Smith ML, Christensen SR, Bullmore E. Broadband criticality of human brain network synchronization. PLoS Comput Biol. 2009;5:e1000314. doi: 10.1371/journal.pcbi.1000314. [DOI] [PMC free article] [PubMed] [Google Scholar]
- Klaus A, Yu S, Plenz D. Statistical analyses support power law distributions found in neuronal avalanches. PLoS One. 2011;6:e19779. doi: 10.1371/journal.pone.0019779. [DOI] [PMC free article] [PubMed] [Google Scholar]
- Langlois D, Cousineau D, Thivierge JP. Maximum likelihood estimators for truncated and censored power-law distributions show how neuronal avalanches may be misevaluated. Phys Rev E Stat Nonlin Soft Matter Phys. 2014;89 doi: 10.1103/PhysRevE.89.012709. 012709. [DOI] [PubMed] [Google Scholar]
- Larremore DB, Carpenter MY, Ott E, Restrepo JG. Statistical properties of avalanches in networks. Phys Rev E Stat Nonlin Soft Matter Phys. 2012;85 doi: 10.1103/PhysRevE.85.066131. 066131. [DOI] [PubMed] [Google Scholar]
- Linkenkaer-Hansen K, Nikouline VV, Palva JM, Ilmoniemi RJ. Long-range temporal correlations and scaling behavior in human brain oscillations. J Neurosci. 2001;21:1370–1377. doi: 10.1523/JNEUROSCI.21-04-01370.2001. [DOI] [PMC free article] [PubMed] [Google Scholar]
- Meisel C, Olbrich E, Shriki O, Achermann P. Fading signatures of critical brain dynamics during sustained wakefulness in humans. J Neurosci. 2013;33:17363–17372. doi: 10.1523/JNEUROSCI.1516-13.2013. [DOI] [PMC free article] [PubMed] [Google Scholar]
- Nicoll RA, Malenka RC, Kauer JA. Functional comparison of neurotransmitter receptor subtypes in mammalian central nervous system. Physiol Rev. 1990;70:513–565. doi: 10.1152/physrev.1990.70.2.513. [DOI] [PubMed] [Google Scholar]
- Okun M, Naim A, Lampl I. The subthreshold relation between cortical local field potential and neuronal firing unveiled by intracellular recordings in awake rats. J Neurosci. 2010;30:4440–4448. doi: 10.1523/JNEUROSCI.5062-09.2010. [DOI] [PMC free article] [PubMed] [Google Scholar]
- Petermann T, Thiagarajan TC, Lebedev MA, Nicolelis MA, Chialvo DR, Plenz D. Spontaneous cortical activity in awake monkeys composed of neuronal avalanches. Proc Natl Acad Sci U S A. 2009;106:15921–15926. doi: 10.1073/pnas.0904089106. [DOI] [PMC free article] [PubMed] [Google Scholar]
- Petersen CC, Grinvald A, Sakmann B. Spatiotemporal dynamics of sensory responses in layer 2/3 of rat barrel cortex measured in vivo by voltage-sensitive dye imaging combined with whole-cell voltage recordings and neuron reconstructions. J Neurosci. 2003;23:1298–1309. doi: 10.1523/JNEUROSCI.23-04-01298.2003. [DOI] [PMC free article] [PubMed] [Google Scholar]
- Plenz D, Niebur E. Criticality in neural systems. Weinheim, Germany: Wiley; 2014. [Google Scholar]
- Populin LC. Anesthetics change the excitation/inhibition balance that governs sensory processing in the cat superior colliculus. J Neurosci. 2005;25:5903–5914. doi: 10.1523/JNEUROSCI.1147-05.2005. [DOI] [PMC free article] [PubMed] [Google Scholar]
- Poulet JF, Petersen CC. Internal brain state regulates membrane potential synchrony in barrel cortex of behaving mice. Nature. 2008;454:881–885. doi: 10.1038/nature07150. [DOI] [PubMed] [Google Scholar]
- Ribeiro TL, Copelli M, Caixeta F, Belchior H, Chialvo DR, Nicolelis MA, Ribeiro S. Spike avalanches exhibit universal dynamics across the sleep-wake cycle. PLoS One. 2010;5:e14129. doi: 10.1371/journal.pone.0014129. [DOI] [PMC free article] [PubMed] [Google Scholar]
- Sachidhanandam S, Sreenivasan V, Kyriakatos A, Kremer Y, Petersen CC. Membrane potential correlates of sensory perception in mouse barrel cortex. Nat Neurosci. 2013;16:1671–1677. doi: 10.1038/nn.3532. [DOI] [PubMed] [Google Scholar]
- Schulz DW, Macdonald RL. Barbiturate enhancement of GABA-mediated inhibition and activation of chloride ion conductance: correlation with anticonvulsant and anesthetic actions. Brain Res. 1981;209:177–188. doi: 10.1016/0006-8993(81)91179-3. [DOI] [PubMed] [Google Scholar]
- Sethna JP, Dahmen KA, Myers CR. Crackling noise. Nature. 2001;410:242–250. doi: 10.1038/35065675. [DOI] [PubMed] [Google Scholar]
- Shew WL, Plenz D. The functional benefits of criticality in the cortex. Neuroscientist. 2013;19:88–100. doi: 10.1177/1073858412445487. [DOI] [PubMed] [Google Scholar]
- Shew WL, Yang H, Petermann T, Roy R, Plenz D. Neuronal avalanches imply maximum dynamic range in cortical networks at criticality. J Neurosci. 2009;29:15595–15600. doi: 10.1523/JNEUROSCI.3864-09.2009. [DOI] [PMC free article] [PubMed] [Google Scholar]
- Shew WL, Yang H, Yu S, Roy R, Plenz D. Information capacity and transmission are maximized in balanced cortical networks with neuronal avalanches. J Neurosci. 2011;31:55–63. doi: 10.1523/JNEUROSCI.4637-10.2011. [DOI] [PMC free article] [PubMed] [Google Scholar]
- Shriki O, Alstott J, Carver F, Holroyd T, Henson RN, Smith ML, Coppola R, Bullmore E, Plenz D. Neuronal avalanches in the resting MEG of the human brain. J Neurosci. 2013;33:7079–7090. doi: 10.1523/JNEUROSCI.4286-12.2013. [DOI] [PMC free article] [PubMed] [Google Scholar]
- Tagliazucchi E, Balenzuela P, Fraiman D, Chialvo DR. Criticality in large-scale brain FMRI dynamics unveiled by a novel point process analysis. Front Physiol. 2012;3:15. doi: 10.3389/fphys.2012.00015. [DOI] [PMC free article] [PubMed] [Google Scholar]
- Tetzlaff C, Okujeni S, Egert U, Wörgötter F, Butz M. Self-organized criticality in developing neuronal networks. PLoS Comput Biol. 2010;6:e1001013. doi: 10.1371/journal.pcbi.1001013. [DOI] [PMC free article] [PubMed] [Google Scholar]
- Touboul J, Destexhe A. Can power-law scaling and neuronal avalanches arise from stochastic dynamics? PLoS One. 2010;5:e8982. doi: 10.1371/journal.pone.0008982. [DOI] [PMC free article] [PubMed] [Google Scholar]
- Von der Malsburg C, Phillips WA, Singer W. Dynamic coordination in the brain: from neurons to mind. Cambridge, MA: MIT; 2010. [Google Scholar]
- Yang H, Shew WL, Roy R, Plenz D. Maximal variability of phase synchrony in cortical networks with neuronal avalanches. J Neurosci. 2012;32:1061–1072. doi: 10.1523/JNEUROSCI.2771-11.2012. [DOI] [PMC free article] [PubMed] [Google Scholar]
- Yu S, Yang H, Shriki O, Plenz D. Universal organization of resting brain activity at the thermodynamic critical point. Front Syst Neurosci. 2013;7:42. doi: 10.3389/fnsys.2013.00042. [DOI] [PMC free article] [PubMed] [Google Scholar]
Associated Data
This section collects any data citations, data availability statements, or supplementary materials included in this article.
Supplementary Materials
Voltage imaging of mouse cortex reveals cascades of spatiotemporally contiguous patterns of neuronal activity. Transcranial voltage imaging of mouse cortex was performed during recovery from anesthesia. Neuronal activity was observed in the form of cascades of spatiotemporally contiguous patterns (left column, cool and warm colors represent hyperpolarization and depolarization, respectively). Small, locally isolated and short-lived cascades were observed more often than large cascades across all brain states, but the cortex in the anesthetized state (top row, 20 min after drug delivery) often exhibited large cascades of activity that spread across the imaged cortex. To define cascades of activity, we used the voltage signal to identify times at which the local activity crosses above a threshold from below (right column).