

Abstract
Previous studies suggest that spontaneous seizures in patients with temporal lobe epilepsy might be preceded by increased action potential firing of hippocampal neurons. Preictal activity is potentially important because it might provide new opportunities for predicting when a seizure is about to occur and insight into how spontaneous seizures are generated. We evaluated local field potentials and unit activity of single, putative excitatory neurons in the subiculum, CA1, CA3, and dentate gyrus of the dorsal hippocampus in epileptic pilocarpine-treated rats as they experienced spontaneous seizures. Average action potential firing rates of neurons in the subiculum, CA1, and dentate gyrus, but not CA3, increased significantly and progressively beginning 2–4 min before locally recorded spontaneous seizures. In the subiculum, CA1, and dentate gyrus, but not CA3, 41–57% of neurons displayed increased preictal activity with significant consistency across multiple seizures. Much of the increased preictal firing of neurons in the subiculum and CA1 correlated with preictal theta activity, whereas preictal firing of neurons in the dentate gyrus was independent of theta. In addition, some CA1 and dentate gyrus neurons displayed reduced firing rates preictally. These results reveal that different hippocampal subregions exhibit differences in the extent and potential underlying mechanisms of preictal activity. The finding of robust and significantly consistent preictal activity of subicular, CA1, and dentate neurons in the dorsal hippocampus, despite the likelihood that many seizures initiated in other brain regions, suggests the existence of a broader neuronal network whose activity changes minutes before spontaneous seizures initiate.
Keywords: hippocampus, subiculum, unit recording
Introduction
Temporal lobe epilepsy is common and can be difficult to treat effectively (Engel et al., 1997). Some patients with temporal lobe epilepsy undergo intracranial recording to localize sites of seizure initiation for treatment by surgical resection. Those electrocorticographic and local field potential (LFP) recordings reveal that spontaneous seizures usually begin in mesial temporal lobe structures, including the amygdala, entorhinal cortex, and especially the hippocampus (Quesney, 1986; Spencer et al., 1987; Sperling and O'Connor, 1989; Wennberg et al., 2002; Bartolomei et al., 2005). However, from standard clinical recordings, it is unclear whether firing rates of individual neurons change in the moments leading up to a spontaneous seizure. Results from a limited number of unit recording studies suggest action potential firing rates of some neurons in mesial temporal lobe structures of patients with temporal lobe epilepsy might change before the electrographic seizure onset (Verzeano et al., 1971; Babb and Crandall, 1976; Babb et al., 1987; Bower et al., 2012). However, many questions persist, including the identity of neurons that display preictal activation. Previous hippocampal slice experiments discovered differences in the propensity of hippocampal subregions to generate epileptiform activity in response to pro-convulsant treatments (Jefferys and Hass, 1982; Mody et al., 1987; Traynelis and Dingledine, 1988; Rafiq et al., 1993; Avoli et al., 1996), suggesting that neurons in different subregions might also differ in their preictal activity before spontaneous seizures in vivo.
To avoid constraints of recording unit activity in the clinical setting, we evaluated a rat model of temporal lobe epilepsy. As in human patients, spontaneous seizures usually initiate in the temporal (ventral) hippocampus of pilocarpine-treated rats (Toyoda et al., 2013). Previous studies in pilocarpine-treated rats have obtained unit recordings from the more accessible dorsal hippocampus and have reported some preictal changes of CA3 neurons (Grasse et al., 2013) and dentate granule cells (Bower and Buckmaster, 2008), but CA1 and subicular neurons have not been examined. The present study measured action potential firing rates of single, putative excitatory neurons in the subiculum, CA1, CA3, and dentate gyrus subregions of the dorsal hippocampus in pilocarpine-treated rats. We asked the following questions. Do individual neurons change their action potential firing rate in the minutes leading up to a spontaneous seizure? Are preictal activity patterns of individual neurons consistent or variable from seizure to seizure? Is preictal unit activity similar across hippocampal subregions or more pronounced in some subregions compared with others? Describing preictal activity of individual neurons is important because it might be useful for predicting seizures and eventually lead to better understanding of how spontaneous seizures initiate.
Materials and Methods
Pilocarpine treatment.
All experiments were performed in accordance with the National Institutes of Health Guide for the Care and Use of Laboratory Animals and were approved by a Stanford University institutional animal care and use committee. Male Sprague Dawley rats (Harlan Laboratories), 36- to 61-d-old, were treated with pilocarpine (380 mg/kg, i.p.) 20 min after atropine methyl bromide (5 mg/kg, i.p.). Two hours after the onset of status epilepticus, rats received diazepam (10 mg/kg, i.p., repeated as needed) and lactated Ringer's solution (10 ml, s.c.). Beginning at least 7 d after pilocarpine treatment, rats were video-monitored for motor seizures of grade 3 or greater (Racine, 1972) to confirm development of spontaneous, recurrent seizures before microdrive implantation surgery.
Surgery.
LFP and unit recordings were obtained with tetrodes in a microdrive (NLX 9-drive; Neuralynx). To implant microdrives, rats were sedated with diazepam (10 mg/kg, i.p.), anesthetized with isoflurane (1.5–2.0%), placed in a stereotaxic frame, maintained on a heating pad with feedback control, given antibiotic (enrofloxacin, 10 mg/kg, s.c.), and prepared for aseptic surgery. A microdrive, containing eight independently movable tetrodes, was implanted 2.6 mm right of bregma and either 4.6 mm (n = 8 rats) or 6.1 mm posterior (n = 5), depending on whether targeted regions were CA1, CA3, and the dentate gyrus or the subiculum and CA1, respectively. Tetrodes were made from four aromatic polyimide-insulated tungsten wires (Sandvik), 12.7 μm in diameter, that were twisted and fused together with heat. Electroplating reduced tetrode impedances to 300–600 kΩ. A reference electrode was placed in the somatosensory cortex. Theta activity generated in the hippocampus could have been volume conducted to the reference electrode in somatosensory cortex (Sirota et al., 2008), but the effect would be minor in the data presented here. Grounds consisted of screws in the skull rostral to bregma and caudal to lambda. A subset of rats (n = 8) was implanted with a bipolar stimulating electrode in the angular bundle (7.6 and 4.6 mm posterior and right of bregma, respectively, and ∼3 mm below the brain surface). Stimulating electrodes consisted of two 50-μm-diameter H-Formvar-coated stainless steel wires (California Fine Wire) with 1 mm tip separation. Microdrives were affixed to the skull with cranioplastic cement and jeweler's screws. After surgery, rats received lactated Ringer's solution (10 ml, s.c.) and analgesic (buprenorphine, 0.05 mg/kg, s.c.).
Data acquisition.
Beginning 7 d after surgery, tetrodes were slowly advanced over days until reaching the cell layers in the subiculum, CA1, CA3, or dentate gyrus. In rats with stimulating electrodes, examination of evoked responses facilitated localization of cell layers. Unit, LFP, and time-locked video recordings were obtained ∼8 h/d, 6 d/week, for up to 106 ± 20 d (range, 4–252 d), during which time spontaneous seizures occurred. Recordings were obtained 55–560 d after status epilepticus (Table 1). Rats frequently slept during recording periods, which is likely to have increased seizure probability (Hellier and Dudek, 1999; Sedigh-Sarvestani et al., 2014) and promoted activity and therefore identification of units that are mostly silent during wakefulness (Neunuebel and Knierim, 2012). Signals were buffered with a head stage (HS-36; Neuralynx), amplified, digitized (Cheetah Data Acquisition; Neuralynx), and saved to disk for offline analysis. One channel of each tetrode was filtered (0.1–1800 Hz) and sampled (2 kHz) to record continuous LFP. In parallel, all four channels of each tetrode were filtered (600–6000 Hz) and sampled (32 kHz) to record extracellular action potentials. Unit recordings consisted of time-stamped epochs of 1 ms duration that were triggered when an amplitude threshold was surpassed. Amplitude thresholds were manually set before each recording session.
Table 1.
Number of rats, seizures, units, and when recordings were obtained relative to status epilepticus
| Rat | Seizures | Units | Recording days (since status epilepticus) |
|---|---|---|---|
| 1 | 65 | 17 subiculum | 55–124 |
| 2 | 214 | 46 subiculum, 43 CA1 | 83–166 |
| 3 | 38 | 22 subiculum, 8 CA1 | 118–164 |
| 4 | 85 | 5 subiculum, 20 CA1 | 443–560 |
| 5 | 9 | 1 CA1 | 98 |
| 6 | 17 | 3 CA1 | 345–346 |
| 7 | 43 | 41 CA3 | 129–303 |
| 8 | 8 | 5 CA3 | 433–434 |
| 9 | 19 | 4 CA3 | 253–267 |
| 10 | 5 | 2 CA3 | 441 |
| 11 | 82 | 3 CA3, 6 dentate gyrus | 74–168 |
| 12 | 198 | 44 dentate gyrus | 180–252 |
| 13 | 7 | 2 dentate gyrus | 139 |
| Total | 790 | 90 subiculum | |
| 75 CA1 | |||
| 55 CA3 | |||
| 52 dentate gyrus |
Anatomy.
After recordings were completed, rats were killed with urethane (2 g/kg, i.p.) and perfused at 30 ml/min through the ascending aorta for 2 min with 0.9% NaCl, 5 min with 0.37% sodium sulfide solution, 1 min with 0.9% NaCl, and 30 min with 4% formaldehyde in 0.1 m phosphate buffer (PB), pH 7.4. Brains were removed and stored in fixative at 4°C at least overnight and then equilibrated in 30% sucrose in 0.1 m PB. The right cerebral hemisphere was sectioned coronally using a sliding microtome set at 40 μm. Continuous series of sections were stained with 0.25% thionin so that tetrode tracks could be identified.
Neuron counting.
An investigator blinded to subject group counted neurons in the subiculum, granule cell layer, hilus, and pyramidal cell layer of CA2/3 and CA1 in the dorsal hippocampus. The experimental group consisted of the 13 epileptic rats from which unit recordings were obtained (Table 1). The control group consisted of two naive rats and two rats that had been treated with pilocarpine but did not develop status epilepticus or epilepsy. All had been implanted for unit recording. A 1-in-8 series of Nissl-stained coronal sections was analyzed, starting at a random point near the anterior border for analysis, which was defined by the first section in which the granule cell layer and CA1 pyramidal cell layer no longer touch (3.30 mm posterior to bregma; Paxinos and Watson, 2009). The posterior border was the first section in which the CA3 pyramidal cell layers of the dorsal and ventral hippocampus begin to touch (−4.52 mm posterior to bregma). This septotemporal length of hippocampus consisted of a subregion from which unit recordings were obtained. An average of seven sections per rat was analyzed. The hilus was defined by its border with the granule cell layer and straight lines drawn from the tips of the granule cell layer to the proximal end of the CA3 pyramidal cell layer. The border between CA3 and CA2 was difficult to discern in Nissl-stained sections, so the two subregions were analyzed together and designated “CA3.” The transition from the CA2 pyramidal cell layer to that of CA1 was identified by a reduction in soma size and thinning of the layer. The border between CA1 and the subiculum was identified by the point at which CA1 pyramidal cells ceased being contiguous. Numbers of neurons per dorsal hippocampus were estimated using the optical fractionator method (West et al., 1991). Counting grids were placed randomly within analyzed regions. Dissector height was total section thickness. Other sampling parameters are summarized in Table 2, which shows mean coefficients of error much smaller than coefficients of variation, indicating sufficient sampling within hippocampi.
Table 2.
Parameters and results of stereological analysis of dorsal hippocampal neuron numbers in control and epileptic pilocarpine-treated rats
| Subiculum | CA1 | CA3 | Hilus | Granule cells | |
|---|---|---|---|---|---|
| Counting grid | 150 × 150 μm | 400 × 400 μm | 300 × 300 μm | 100 × 100 μm | 200 × 200 μm |
| Counting frame | 50 × 50 μm | 50 × 50 μm | 50 × 50 μm | 50 × 50 μm | 10 × 10 μm |
| Cells counted per rat* | 208 ± 31 | 277 ± 28 | 228 ± 13 | 83 ± 13 | 125 ± 7 |
| Coefficient of variation | 0.55 | 0.41 | 0.20 | 0.63 | 0.21 |
| Mean coefficient of error** | 0.19 | 0.08 | 0.08 | 0.10 | 0.07 |
| Neurons per dorsal hippocampus of control rats (n = 4)* | 13,800 ± 5500 | 168,000 ± 22,000 | 78,800 ± 2500 | 5070 ± 400 | 426,000 ± 29,000 |
| Neurons per dorsal hippocampus of epileptic rats (n = 13)* | 16,000 ± 2300 | 107,000 ± 12,000 | 58,600 ± 2900 | 1900 ± 280 | 384,000 ± 25,000 |
| p (two-tailed t test) | 0.667 | 0.029 | 0.002 | <0.001 | 0.396 |
| Power (α = 0.05) | 0.070 | 0.618 | 0.927 | 1.000 | 0.130 |
*mean ± SEM.
**Calculated according to West et al. (1991).
LFP data analysis.
Seizure onset was identified by examining LFP recordings to manually determine the earliest appearance of a persistent change that developed into clear seizure activity, as described previously (Bower and Buckmaster, 2008; Toyoda et al., 2013). Seizure offset time was determined by the abrupt cessation of large-amplitude field potentials (see Fig. 3A3). Only seizures >10 s in duration were included for analysis.
Figure 3.

Unit and LFP recording from the subiculum before and during a spontaneous seizure in an epileptic pilocarpine-treated rat. Multiunit (A1), sorted single-unit (A2), and LFP (A3) recordings. Lines in A1 and A2 are time-compressed 1-ms-duration waveforms of events that surpassed an amplitude threshold. Four colors, one for each tetrode channel, are included, but red and black are most evident. Apparent lack of single-unit activity during the seizure (SZ) is likely an artifact (see Results). Insets show single action potentials recorded by four channels (different colors) of a tetrode at three time points before the seizure and one during the seizure. The abrupt ending of large amplitude field potentials, which signify the seizure offset, is indicated by an arrowhead. Boxed regions in the LFP (A3) are non-theta (B) and preictal theta (C) periods that are shown at higher resolution below. Note the amplitude difference between electrographic spikes (arrow in B) and action potential spikes (double arrow in C). Up is negative in A1 and A2. Up is positive in A3, B, and C.
Spectrograms were generated with methods similar to those used by others who have evaluated spontaneous seizures in pilocarpine-treated rats (Grasse et al., 2013). Briefly, LFPs were bandpass filtered at overlapping frequency bands (finite impulse response filter with order 40,000/center frequency of band). Frequency bands were 0.8–1.2, 0.96–1.44, and 1.152–1.728 Hz, and so on, multiplying the lower and upper limits by 1.2 until 700 Hz. Filtered signals were binned at 2 s, and a normalized mean-squared amplitude was calculated for each signal per bin across seizures.
Periods of theta in the LFP were identified by a two-step process. First, theta was identified automatically by a sliding window of 2 s duration and 1 s overlaps that calculated a spectrogram using a fast Fourier transform. Epochs were identified in which the power spectral density ratio of theta (3–8 Hz) to delta (2–3 Hz) exceeded two for at least two consecutive 2 s bins. Next, automatically detected theta was verified manually, and onsets and offsets of clear theta periods were marked using NeuroExplorer 4 (Nex Technologies). The theta frequency range used in the present study (3–8 Hz) is similar to the original description of theta (4–7 Hz; Walker and Dovey, 1944) and encompasses the average frequency of hippocampal theta in rats (Mitchell and Ranck, 1980), although many studies now include higher frequencies. It is possible that results might have been different if a higher-frequency range were used, but that seems unlikely in part because the theta frequency peak is reduced in epileptic rats (Lenck-Santini and Holmes, 2008; Chauvière et al., 2009; Inostroza et al., 2013).
Brain state analysis.
To evaluate the role of brain state in preictal activity, rat behavior was determined from video recordings and coincident LFPs. As outlined by others who have studied preictal brain states in epileptic rats (Sedigh-Sarvestani et al., 2014), four conditions were recognized: (1) rapid eye movement (REM) sleep (sleep with theta); (2) non-REM sleep (sleep without theta); (3) awake with theta; and (4) awake without theta. Theta was considered to be preictal if it occurred within 5 s before seizure onset.
Unit data analysis.
An offline semiautomated approach (Harris et al., 2000) was used to separate action potentials of single units from multiunit activity, as described previously (Bower and Buckmaster, 2008). Briefly, single units were identified by grouping similar waveforms based on four features: peak amplitude, sum of squared amplitude, and the first two principal components. An automated, cluster identification program was used first (KlustaKwik-1.7; K. D. Harris, Rutgers University, New Brunswick, NJ). Then, final clusters were manually selected (MClust-3.5A; A. D. Redish, University of Minnesota, Minneapolis, MN) based on waveform similarity, autocorrelograms, and cross-correlograms. Cross-correlograms were evaluated for asymmetric peaks to identify clusters that might be attributable to decreasing amplitude spikes of bursts by a single neuron. Final clusters had <0.5% of action potentials at interspike intervals <2 ms in autocorrelograms. The number of analyzed units recorded per tetrode and per seizure was 1.82 ± 0.03 (range, 1–5).
For each unit, firing rate during the entire recording session (“long-average firing rate”) was calculated. From unit data that had been filtered (600–6000 Hz) and clustered, an average waveform for each channel of a tetrode was generated, and the channel with the largest peak-to-valley amplitude (negative polarity up) was used to measure mean spike amplitude and peak-to-valley spike duration. A waveform symmetry index was calculated as the ratio between peak amplitude/valley amplitude; values closer to 1 indicate more symmetry. To quantify the tendency of neurons to discharge action potentials in bursts, a burst index was calculated. Briefly, from an autocorrelogram with 1 ms bins, the mean value from 40–50 ms (“baseline”) was subtracted from the peak value measured from 0–10 ms (see Fig. 4A2), and the result was normalized to the peak if positive or to the baseline if negative to obtain a value ranging from −1 (tonically firing) to 1 (bursting). The 40–50 ms baseline period was not always flat (i.e., stable), and it occurs in the gamma scale. However, a burst index defined this way has been used successfully for purposes of neuron classification (Royer et al., 2012).
Figure 4.
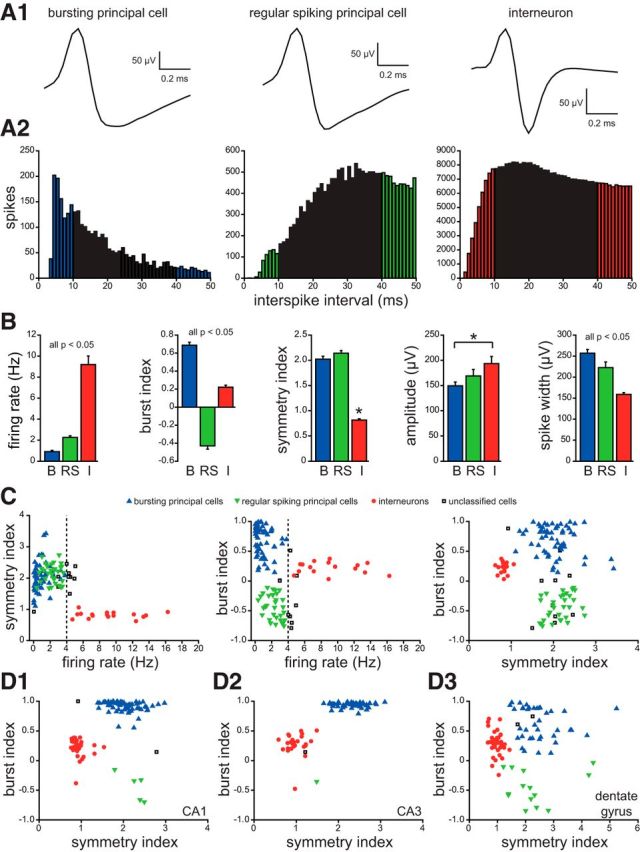
Subicular units classified as bursting principal cells, regular spiking principal cells, or interneurons. A1, Average waveforms of typical examples of each. A2, Autocorrelograms of same cells as in A1. Colored bars indicate parts used to calculate burst index. B, Baseline firing rate, burst index, symmetry index, spike amplitude, and spike width group data from bursting principal cells (B), regular spiking principal cells (RS), and interneurons (I). Burst index is the peak measured from 0 to 10 ms (colored bars in A2) minus mean baseline value measured from 40 to 50 ms (colored bars in A2). The resulting value was normalized to the peak if positive or to the baseline if negative, which yielded burst indices ranging from −1 (tonic firing) to 1 (bursting). Symmetry index is the ratio of waveform peak/valley. Amplitude and spike width were measured from waveform peak to valley. Values indicate mean ± SEM. *p < 0.05, ANOVA with Dunn's test. C, Plots of symmetry index, baseline firing rate, and burst index, which were used for neuron classification. A firing rate of 4 Hz was a defining feature. Units that did not clearly fit into a category were unclassified and omitted from additional analysis. D, Plots of burst index versus symmetry index of cells in CA1 (D1), CA3 (D2), and dentate gyrus (D3).
In addition to long-average firing rate, firing rates were measured for theta, non-theta, and seizure periods. Firing rate during theta was calculated as the total number of action potentials that fell within manually verified theta periods divided by the summed length of the theta periods. Firing rate during non-theta activity excluded periods of theta identified by the automated first-step procedure described above. Firing rate during seizures was the total number of action potentials that occurred during the seizure divided by seizure duration.
Units were recorded across multiple days using methods similar to previous studies (Lin et al., 2012). A given unit was identified from previous recordings based on similarities in waveforms, spike widths, spike symmetry indices, burst indices, and autocorrelograms. When units were identified as a single cell across multiple seizures and multiple days, results were combined and averaged. Analysis focused on preictal activity. To avoid postictal effects on preictal activity patterns, seizures that occurred within 20 min of a preceding seizure were excluded from analysis.
Perievent time histograms (PETHs) of action potential frequency were generated by aligning data to seizure onsets and binning at 30 or 5 s. Seizure onset occurred at the boundary between two bins. Data from PETHs were used to classify units as “preictal-increase,” “preictal-decrease,” or “unchanged” by comparing preictal and baseline firing rates. Baseline was 10–5 min before seizure onset, and the preictal period was defined as 1–0 min (see Fig. 5C). Preictal firing rates were considered to be significantly different if they were >3 SDs from baseline averages.
Figure 5.
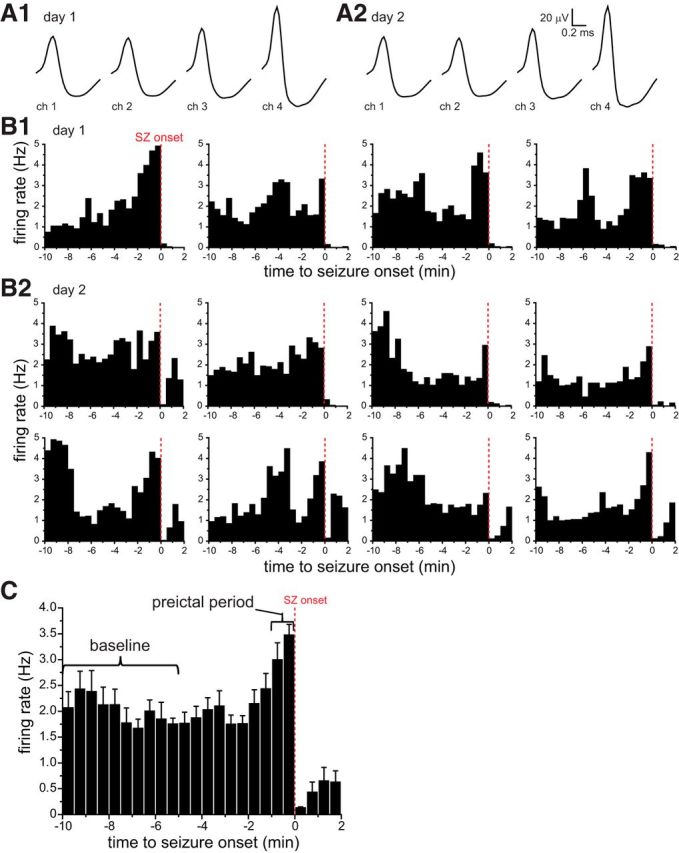
Preictal activity of a bursting subicular neuron that was recorded during 12 seizures over 2 d. Waveforms (A1, A2) and PETHs (B1, B2) of four seizures on 1 d (A1, B1) and eight seizures on the next day (A2, B2). The tetrode was not moved between days. On the first and second days, waveforms (A1, A2), baseline firing rates (1.8 and 2.1 Hz, respectively), symmetry indices (2.3 and 2.4), and burst indices (0.93 and 0.83) were similar. C, Average PETH of all 12 seizures for this unit. Error bars indicate SEM. Preictal activity classification was based on comparing average firing rate during the baseline period (10–5 min before seizure onset) with that of the preictal period (last minute before seizure onset). Apparent reduced firing rates during seizures are likely an artifact because of limits of recording and sorting single-unit activity during periods of high activity (see Results). ch, Channel; SZ, seizure.
To test whether the preictal firing rate of a neuron was higher or lower than baseline more often than chance across multiple seizures, a scrambling test was used that took into account the variability in firing rate of each individual neuron. In the entire recording file of each neuron, randomly determined time points were identified as “onsets” of pseudo-seizures, keeping the number of pseudo-seizures identical to the actual number of seizures that occurred during recording of that neuron. Spike counts were measured for 10 min before the onset of pseudo-seizures, and the number of pseudo-seizures with action potential firing rates higher during the “preictal period” (1–0 min before onset) compared with baseline (10–5 min before onset) was measured. The procedure was repeated 100 times to create a table of p values for the null hypothesis that spike rates before seizure onset were randomly higher than baseline. The entire procedure was repeated again to create an analogous p value table for spike-rates-before-seizure-onset less than baseline. For this analysis, p values ≤0.05 were considered significant.
Results
Neuron loss in the dorsal hippocampus of epileptic pilocarpine-treated rats
The optical fractionator method was used to measure the extent of structural and cellular damage in a recorded region of the dorsal hippocampus in epileptic pilocarpine-treated rats (n = 13) compared with controls (n = 4; Fig. 1; Table 2). The septotemporal span of the dorsal hippocampus that was analyzed contained 44% of the CA1 pyramidal cells reported for the entire control rat hippocampus by West et al. (1991), 32% of CA3 pyramidal cells, and 36% of granule cells but only 9 and 5% of hilar and subicular neurons, respectively. These findings reveal that most hilar and subicular neurons are located in more temporal regions of the hippocampal formation. Similar to previous reports (Mello et al., 1993), epileptic pilocarpine-treated rats displayed significant loss of CA1, CA3, and especially hilar neurons. Numbers of subicular neurons and granule cells were not significantly different from controls, but statistical power for those comparisons was low. Nevertheless, the pattern of neuron loss was similar to that of patients with temporal lobe epilepsy, who display relative sparing of neurons in the subiculum and granule cell layer and more severe loss of CA1 pyramidal cells, CA3 pyramidal cells, and hilar neurons (Margerison and Corsellis, 1966). Despite significant neuron loss in those subregions, sufficient numbers of CA1 and CA3 pyramidal cells survived for unit recording in epileptic rats.
Figure 1.
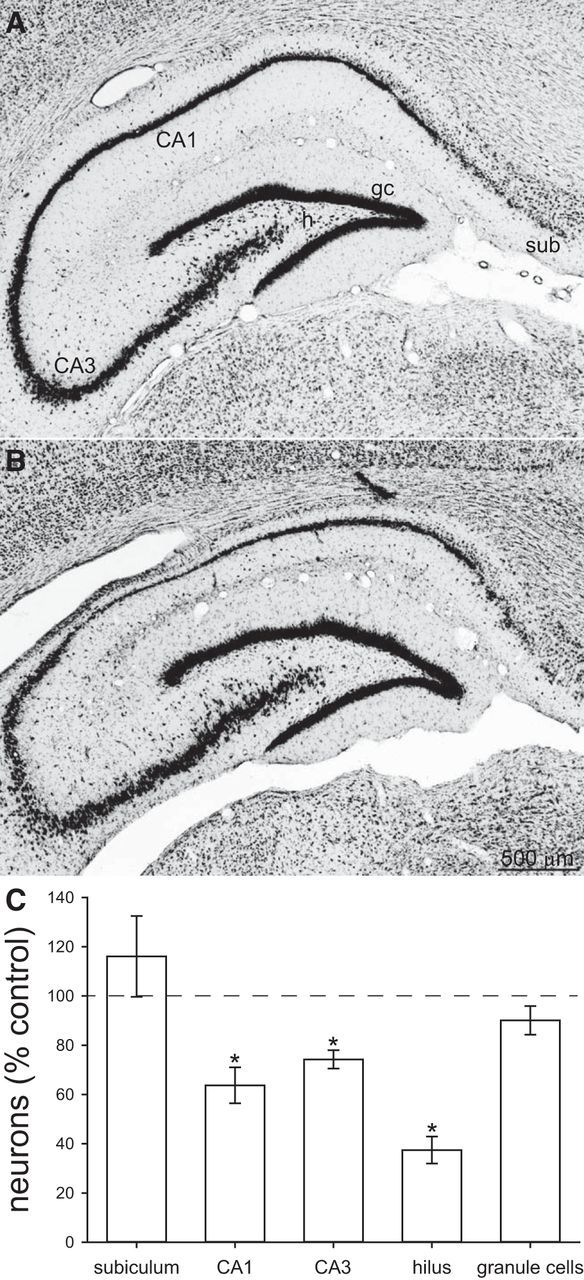
Nissl-stained hippocampi from a control (A) and epileptic pilocarpine-treated (B) rat. sub, Subiculum; h, hilus; gc, granule cells. C, Number of neurons in the subiculum, CA1 cell layer, CA3 cell layer, hilus, and granule cell layer of the dorsal hippocampus. Values represent mean ± SEM of epileptic rats (n = 13) relative to average values of controls (n = 4). *p < 0.05, two-tailed t test.
Tetrode locations
Tetrode tracks in Nissl-stained sections were used to identify recording sites (Fig. 2). All LFP and unit data included for analysis were obtained with tetrodes whose tip locations were identified in cell layers or having just passed through them. Data were obtained from 17, 8, 11, and 10 tetrodes in the subiculum, CA1, CA3, and dentate gyrus, respectively.
Figure 2.
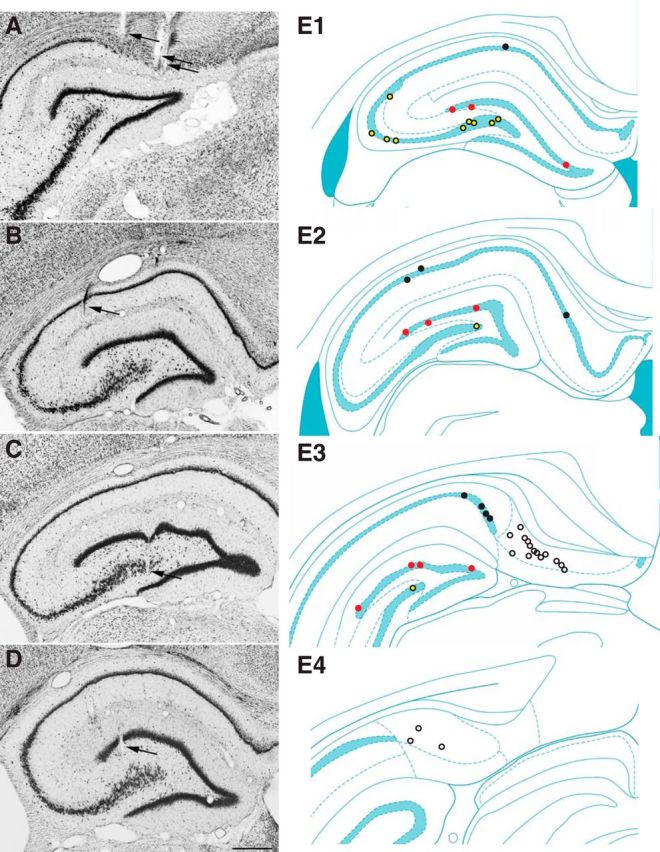
Recording sites. Tetrode track (arrows) localization in the subiculum (A), CA1 (B), CA3 (C), and dentate gyrus (D) in Nissl-stained coronal sections. E, Recording sites in the subiculum (white markers), CA1 (black), CA3 (yellow), and dentate gyrus (red) at rostral (E1) to caudal (E4) levels. Hippocampal schematic diagrams from Paxinos and Watson (2009). Scale bar, 500 μm.
Seizures
LFP recordings revealed spontaneous seizure activity (Fig. 3A3) that was similar to that described previously for pilocarpine-treated rats (Lévesque et al., 2012; Toyoda et al., 2013; Grasse et al., 2013), other animal models (Bragin et al., 1999), and patients with temporal lobe epilepsy (Spencer et al., 1992). A total of 790 seizures were recorded in 13 rats (Table 1). Seizure durations were 57 ± 1 s (mean ± SEM, range of 11–231 s), and 75% were convulsive (Racine score ≥3).
In the present study, tetrodes were located in the dorsal hippocampus on the right side of the brain. Without recording at many locations throughout the brain simultaneously, actual sites of seizure initiation were unknown. However, we reported recently that, in epileptic pilocarpine-treated rats, seizures are significantly more likely than chance to be recorded earliest in the dorsal hippocampus, ventral hippocampus, or ventral subiculum, which was not the case for all other brain regions evaluated (Toyoda et al., 2013). Based on results from that study, we predicted that 9% of seizures were likely to initiate in the right dorsal hippocampus in which recordings were obtained in the present study. Therefore, 91% of seizures probably began elsewhere and spread into the recorded region. Again, based on results from the previous study, 58% of seizures probably began in the ventral hippocampus or ventral subiculum. To measure time for seizure activity to spread between the dorsal hippocampus, ventral hippocampus, and subiculum, we analyzed earliest seizure onset measurements of those specific regions in data from the previous study, in which six rats had electrodes in the dorsal and ventral hippocampus, eight rats had electrodes in the dorsal hippocampus and ventral subiculum, and 10 seizures were evaluated in each rat. The average difference in seizure onset time between the dorsal and ventral hippocampus was −0.3 ± 1.2 s (negative value indicates earlier seizure onset in the ventral hippocampus). The range for all 60 seizures with dorsal and ventral hippocampal recordings was −19.1 to 19.1 s. The average difference in seizure onset between the dorsal hippocampus and ventral subiculum was 0.1 ± 1.2 s, range of −25.7 to 32.0 s. These findings reveal that, in epileptic pilocarpine-treated rats, seizures spread between dorsal hippocampus, ventral hippocampus, and subiculum in a fraction of 1 s, on average, although there was considerable variability. The maximum delay between seizure onset in another brain region and its spread to the right dorsal hippocampus was <30 s.
Unit classification
Units were classified as putative principal cells (bursting or regular spiking) or interneurons. Criteria used to classify hippocampal units are not affected in epilepsy (Viskontas et al., 2007; Bower and Buckmaster, 2008; Tyler et al., 2012). Therefore, units were classified based on criteria similar to those reported previously for non-epileptic control rats for neurons in the subiculum (Sharp and Green, 1994; Anderson and O'Mara, 2003), CA1 (Fox and Ranck, 1975; Csicsvari et al., 1999; Lin et al., 2012; Tyler et al., 2012), and CA3 and dentate gyrus (Jung and McNaughton, 1993; Leutgeb et al., 2007). Principal cells were subclassified as bursting or regular spiking. It is possible that regular spiking cells burst but do so rarely (Ranck, 1973). Nevertheless, the distinction is useful for comparing groups with a high versus low propensity to burst.
The subiculum has been proposed as a site of seizure initiation (Huberfeld et al., 2011), so unit analysis in the present study began with subicular neurons. Bursting and regular spiking subgroups have been established clearly in the subiculum (Sharp and Green, 1994; Anderson and O'Mara, 2003). Bursting principal cells in the subiculum had low long-average firing rates, high burst indices, symmetry indices far from 1, and long spike widths (Fig. 4). Regular spiking principal cells in the subiculum had low long-average firing rates, low burst indices, symmetry indices far from 1, and moderate spike widths. Interneurons in the subiculum had high long-average firing rates, low burst indices, symmetry indices close to 1, and short spike widths. Differences between principal cells and interneurons were similar in other hippocampal regions (Fig. 4D). A long-average firing rate of 4 Hz was used as a defining feature of principal cells versus interneurons in all hippocampal subregions.
The present study focused on principal cells and excluded interneurons from additional analysis. Furthermore, some subicular units (9%) could not be classified confidently as principal cells or interneurons and were omitted from additional analysis. In CA1, CA3, and the dentate gyrus, 1, 2, and 4% of units, respectively, were unclassified. Principal cells recorded in the subiculum, CA1, and CA3 were likely to be pyramidal cells. Principal cells recorded in the dentate gyrus could have been mature granule cells (Jung and McNaughton, 1993; Leutgeb et al., 2007), adult-born granule cells (Alme et al., 2010), or mossy cells (Neunuebel and Knierim, 2012). Numbers and characteristics of putative excitatory units included in the present study are reported in Table 3.
Table 3.
Characteristics of bursting and regular spiking neurons in the subiculum, CA1, CA3, and dentate gyrus in epileptic pilocarpine-treated rats
| Long-average firing rate (Hz) | Non-theta firing rate (Hz) | Theta firing rate (Hz) | Burst index | Symmetry index | Spike amplitude (μV) | Spike width (ms) | |
|---|---|---|---|---|---|---|---|
| Subiculum | |||||||
| Bursting, n = 58 | 0.89 ± 0.11 | 0.88 ± 0.11 | 1.43 ± 0.19* | 0.7 ± 0.03 | 2.0 ± 0.1 | 150 ± 8 | 0.26 ± 0.01 |
| 0.02–3.24 | 0.02–3.23 | 0.03–6.03 | 0.2–1.0 | 1.1–3.4 | 82–352 | 0.15–0.46 | |
| Regular spiking, n = 32 | 2.35 ± 0.14** | 2.34 ± 0.14 | 3.66 ± 0.27* | −0.4 ± 0.04 | 2.1 ± 0.1 | 169 ± 13 | 0.23 ± 0.01 |
| 0.44–3.80 | 0.44–3.85 | 0.72–6.27 | −0.8 to −0.1 | 1.7–2.7 | 86–363 | 0.15–0.43 | |
| CA1 | |||||||
| Bursting, n = 70 | 0.40 ± 0.06 | 0.40 ± 0.06 | 0.58 ± 0.08* | 0.9 ± 0.01 | 2.0 ± 0.04 | 189 ± 10 | 0.24 ± 0.01 |
| 0.04–3.18 | 0.04–3.17 | 0.00–3.89 | 0.6–1.0 | 1.4–3.0 | 66–565 | 0.15–0.36 | |
| Regular spiking, n = 5 | 1.81 ± 0.63 | 1.80 ± 0.62 | 2.12 ± 0.92 | −0.4 ± 0.1 | 2.3 ± 0.1 | 240 ± 55 | 0.25 ± 0.03 |
| 0.33–3.50 | 0.34–3.49 | 0–4.60 | −0.7 to −0.2 | 1.8–2.5 | 103–403 | 0.15–0.30 | |
| CA3 | |||||||
| Bursting, n = 54 | 0.32 ± 0.03 | 0.33 ± 0.03 | 0.13 ± 0.02* | 0.9 ± 0.01 | 2.3 ± 0.1 | 173 ± 12 | 0.24 ± 0.01 |
| 0.02–0.86 | 0.09–0.87 | 0–0.78 | 0.8–1.0 | 1.7–3.1 | 61–495 | 0.15–0.30 | |
| Regular spiking, n = 1 | 0.09 | 0.08 | 0.44 | −0.4 | 1.5 | 265 | 0.21 |
| Dentate gyrus | |||||||
| Bursting, n = 38 | 0.49 ± 0.10 | 0.49 ± 0.10 | 0.47 ± 0.12 | 0.6 ± 0.04 | 2.5 ± 0.1 | 121 ± 9 | 0.22 ± 0.01 |
| 0.04–3.04 | 0.04–3.05 | 0–3.49 | 0.1–1.0 | 1.5–5.2 | 71–340 | 0.15–0.30 | |
| Regular spiking, n = 14 | 0.96 ± 0.17** | 0.95 ± 0.17 | 2.96 ± 0.68* | −0.5 ± 0.1 | 2.3 ± 0.3 | 121 ± 12 | 0.24 ± 0.01 |
| 0.08–2.04 | 0.08–2.04 | 0.30–8.44 | −0.9 to −0.04 | 1.2–4.4 | 77–230 | 0.18–0.30 |
Values indicate mean ± SEM and range.
*Theta versus non-theta firing rate (p < 0.01, paired t test or Wilcoxon's signed-rank test).
**Comparison of long-average firing rate of regular spiking versus bursting neurons within each subregion (p < 0.01, Mann–Whitney rank-sum test).
Average preictal unit activity of neurons in the subiculum, CA1, and dentate gyrus, but not CA3, increased minutes before seizure onset
Data were obtained from individual neurons across multiple seizures and days (Fig. 5A). Individual units were recorded during 8.7 ± 0.4 seizures (range, 3–62 seizures) over 1–7 d, and 25% of all units were recorded over multiple days. Action potential firing rates fluctuated throughout recording periods, which is evident in PETHs (Fig. 5B). PETHs from all seizures recorded for each unit were averaged (Fig. 5C). Next, average PETHs of individual units were averaged for all principal cells recorded in each hippocampal subregion. In the subiculum, average preictal activity increased significantly (>3 SDs from the baseline average) beginning 4 min before seizure onset and peaked in the 30 s bin immediately preceding seizure onset at 1.5 times baseline (Fig. 6A1). In CA1, average preictal activity increased significantly beginning 2 min before seizure onset and peaked in the bin 1.0–0.5 min before seizure onset at 1.3 times baseline (Fig. 6B1). Average preictal activity did not increase significantly in CA3 (Fig. 6C1), as reported previously (Grasse et al., 2013). In the dentate gyrus, average preictal activity increased significantly beginning 2.5 min before seizure onset and peaked in the bin immediately preceding seizure onset at 1.6 times baseline (Fig. 6D1). To test whether average preictal activity changed at a finer temporal resolution than 30 s, data were plotted in 5-s-duration bins (Fig. 6A2–D2). Plots were similar to those with 30-s-duration bins, except there appeared to be increased average precital firing in the last 5 s before seizure onset in CA3 and the dentate gyrus. These findings reveal that, minutes before the onset of a spontaneous seizure recorded by the LFP, average firing rates of principal neurons were significantly increased in the subiculum, CA1, and dentate gyrus but not CA3. The onset of increased average preictal activity recorded in the present study preceded the time it takes for seizures to spread from other possible sites of seizure onset measured in a previous study (Toyoda et al., 2013; see above). Therefore, these findings suggest that average firing rates of excitatory neurons in the subiculum, CA1, and dentate gyrus of the dorsal hippocampus increased significantly before the initiation of spontaneous seizures.
Figure 6.
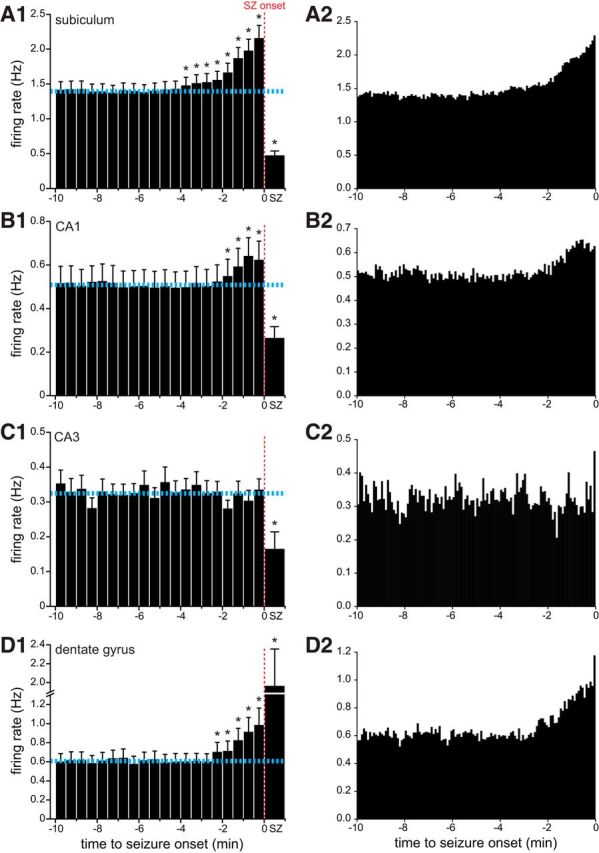
Average preictal activity of subicular (A), CA1 (B), CA3 (C), and dentate gyrus (D) principal neurons (n = 90, 75, 55, and 52, respectively). A1–D1, Dashed horizontal cyan lines indicate average baseline firing rate. Error bars indicate SEM. * indicates >3 or <3 SDs from the baseline firing rate, which was the average during the 10–5 min period before seizure onset. Bin size was 30 s, except seizure (SZ) bins, which represent average firing rate during the entire seizure duration. Apparent reduced firing rates during seizures are likely an artifact because of limits of recording and sorting single-unit activity during periods of high activity (see Results). A2–D2, 5 s bins.
Significantly consistent increased preictal activity by many individual neurons in the subiculum, CA3, and dentate gyrus but not CA3
Next, firing rate data were evaluated unit by unit. For each unit, average firing rate during each 30-s-duration bin was calculated. Then, average firing rate of the preictal period (1–0 min before seizure onset) was compared with that during baseline (10–5 min before seizure onset) to test whether the preictal firing was >3 SDs greater or less than the baseline average (Fig. 5C). Based on results, units were classified as preictal-increase, preictal-decrease, or unchanged (Fig. 7). In the subiculum, CA1, CA3, and dentate gyrus, respectively, neuron classification was as follows: preictal-increase, 60% (54 of 90 neurons), 41% (31 of 75), 11% (6 of 55), and 35% (18 of 52); unchanged, 39% (35 of 90), 44% (33 of 75), 87% (48 of 55), and 50% (26 of 52); and preictal-decrease, 1% (1 of 90), 15% (11 of 75), 2% (1 of 55), and 15% (8 of 52). These findings reveal that neurons with increased preictal activity were most common in the subiculum, moderately common in CA1 and the dentate gyrus, and rare in CA3. Neurons with decreased preictal activity were moderately common in CA1 and the dentate gyrus and rare in CA3 and the subiculum. Neurons with unchanged preictal activity were common in all regions, especially CA3.
Figure 7.
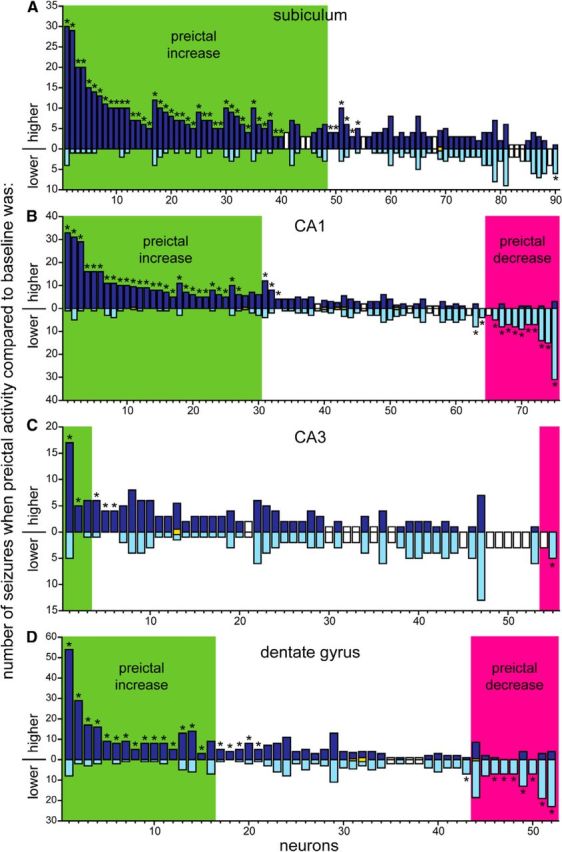
Number of subicular (A), CA1 (B), CA3 (C), and dentate gyrus (D) principal neurons classified as preictal-increase, unchanged, or preictal-decrease. In these plots, each bar represents a single neuron and indicates the number of seizures when its firing rate during the last minute before seizure onset was greater than the average baseline firing rate for that seizure (upward, dark blue part of bar) and the number of seizures when its preictal firing rate was less than baseline (downward light blue part of bar). For example, the first neuron in the subiculum was recorded during 34 seizures, 30 of which had higher preictal than baseline firing rates and four with lower preictal than baseline firing rates. Green and magenta shading indicate neurons classified as preictal-increase or preictal-decrease, respectively, depending on whether the preictal firing rate was >3 or <3 SDs from the baseline averaged across all seizures for that neuron. * indicates neurons with significantly consistent higher or lower preictal activity based on a scrambling test. Yellow bars centered on the 0-axis indicate rare cases when preictal and baseline firing rates were equal. White bars depict neurons for which the scrambling test could not be performed, because firing rate variability was too high for the number of seizures recorded.
Previously, we classified neurons in the dentate gyrus by preictal activity primarily based on only a single seizure (Bower and Buckmaster, 2008). Consequently, seizure-to-seizure consistency of preictal changes remained unclear. The present study recorded an average of 8.7 seizures per neuron, and a scrambling test was used to test whether the number of seizures during which preictal firing rates were higher or lower than baseline exceeded chance levels. The scrambling test could not be used in some cases because, for those neurons, variability in action potential firing rates was too high for the number of seizures recorded. In the subiculum, 81 of 90 units could be evaluated with the scrambling test, and 57% (46 of 81) had significantly more seizures during which preictal firing rate exceeded baseline (Fig. 7A). Of those 46 neurons, 48% fired at higher rates preictally for 100% of recorded seizures. The entire group of 46 neurons fired at higher rates preictally for 91% of seizures (range, 75–100%). These findings reveal that more than half of the subicular neurons displayed increased preictal activity across multiple seizures that exceeded chance levels.
In CA1 and the dentate gyrus, substantial proportions of neurons displayed significantly increased preictal activity across multiple seizures. In CA1, 44% (30 of 68) of neurons had significantly more seizures during which preictal firing rate exceeded baseline (Fig. 7B). Of those 30 neurons, 43% fired at higher rates preictally for 100% of recorded seizures. The entire group of 30 neurons fired at higher rates preictally for 91% of seizures (range, 73–100%). In the dentate gyrus, 41% (20 of 49) of neurons had significantly more seizures during which preictal firing rate exceeded baseline (Fig. 7D). Of those 20 neurons, 25% fired at higher rates preictally for 100% of recorded seizures. The entire group of 16 neurons fired at higher rates preictally for 86% of seizures (range, 70–100%). In CA3, only 12% (5 of 42) of neurons had significantly more seizures during which preictal firing rate exceeded baseline (Fig. 7C). Together, these findings reveal that, in the subiculum, CA1, and dentate gyrus but not in CA3, substantial proportions of neurons fired action potentials at higher rates preictally, and they did so with significant consistency.
In contrast, firing rates of other cells decreased in the moments leading up to seizures. In CA1, 18% (12 of 68) of neurons had significantly more seizures during which preictal firing rate was less than baseline (Fig. 7B). Of those 12 neurons, 50% fired at lower rates preictally for 100% of recorded seizures. The entire group of 12 neurons fired at lower rates preictally for 92% of seizures (range, 80–100%). In the dentate gyrus, 16% (8 of 49) of neurons had significantly more seizures during which preictal firing rate was less than baseline (Fig. 7D). Of those eight neurons, 38% fired at lower rates preictally for 100% of recorded seizures. The entire group of eight neurons fired at lower rates preictally for 87% of seizures (range, 76–100%). In the subiculum and CA3, only 1% (1 of 81) and 2% (1 of 42) of neurons had significantly more seizures during which preictal firing rates were less than baseline, respectively (Fig. 7A,C). These findings reveal moderate numbers of neurons whose firing rate decreased before seizure onset with significant consistency in CA1 and the dentate gyrus but not in CA3 or the subiculum. In summary, analysis of preictal activity revealed that many individual neurons displayed significantly consistent patterns of increased, decreased, or unchanged firing rates, which contrasts with the alternate possibility of random variation in preictal activity.
Theta activity increased before seizure onset
Increased preictal activity is interesting, in part, because it might contribute to seizure genesis. Is increased preictal activity associated exclusively with an impending seizure, or might there be other correlations? Some hippocampal principal cells discharge action potentials at higher rates during theta (Anderson and O'Mara, 2003; Bland et al., 2005). Theta is reported to occur before seizure onset in animal models of epilepsy (Butuzova and Kitchigina, 2008; Popova et al., 2008; Kitchigina and Butuzova, 2009; Sedigh-Sarvestani et al., 2014), including pilocarpine-treated rats (Grasse et al., 2013). In the present study, examination of LFPs revealed theta before the onset of some seizures (Fig. 3C). To screen for preictal changes in LFP recordings, spectrograms were generated for each hippocampal subregion (Fig. 8A1–D1). In all hippocampal subregions, the largest preictal change was increased power in the 5–8 Hz band beginning at least 1 min before seizure onset.
Figure 8.
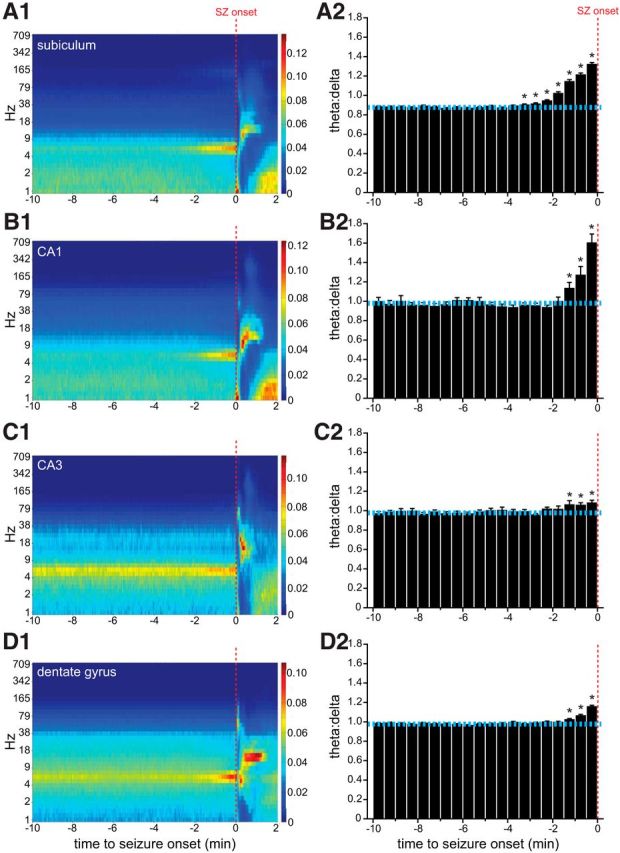
Theta activity increases preictally. Spectrograms (left column) and PETHs of average theta/delta ratios (right column) of seizures (SZ) recorded in the subiculum (A), CA1 (B), CA3 (C), and dentate gyrus (D) (n = 401, 26, 94, and 269 seizures, respectively). Spectrogram color indicates normalized power. In histograms, dashed horizontal cyan lines indicate average baseline theta/delta ratios. Error bars indicate SEM. * indicates >3 SDs from the average theta/delta ratio during the baseline period (10–5 min before seizure onset).
To quantitatively test whether theta was significantly more likely to occur before seizure onset, PETHs of theta/delta ratios were generated. Compared with baseline, average theta/delta ratios were significantly increased before seizure onset in all hippocampal regions, confirming that, on average, theta increased preictally. Significantly increased average theta/delta ratios began earliest in the subiculum, 3.5 min before seizure onset, compared with 1.5 min before seizure onset in CA1, CA3, and dentate gyrus. Peak average theta/delta ratios occurred in the last 30 s bin before seizure onset and were greatest in CA1 (1.6 times baseline), then subiculum (1.5 times), dentate gyrus, (1.2 times), and lastly CA3 (1.1 times).
To test whether theta itself changed preictally, interictal and preictal theta periods were compared in the subiculum, CA1, CA3, and dentate gyrus. Spectrograms were generated for the theta band (3–10 Hz, 0.5 Hz bins), and the frequency with maximum power was identified and averaged. For the entire group, peak theta frequency was similar interictally (6.05 ± 0.05 Hz) and preictally (6.06 ± 0.10 Hz, paired t test). These findings suggest that basic characteristics of preictal and interictal theta were similar.
Average firing rates of neurons in the subiculum, CA1, and dentate gyrus increased during theta
To test whether putative principal neurons in the dorsal hippocampus of epileptic pilocarpine-treated rats fired action potentials faster during theta, entire recording periods were analyzed to compare firing rates during theta versus non-theta periods. For most neuron groups, average firing rates during theta were significantly different from during non-theta periods (Table 3). Compared with non-theta periods, average firing rates during theta were 1.6 times higher for bursting and regular spiking subicular neurons and 1.5 times higher for bursting CA1 neurons. Thus, theta-related increases in average firing rate during interictal periods were similar in extent to peak preictal increases in average firing rate (see above) in the subiculum (1.6 and 1.5 times baseline, respectively) and CA1 (1.5 and 1.3 times baseline). In contrast, average firing rates during theta decreased to 39% of non-theta rates for bursting CA3 neurons. Average firing rates of regular spiking CA1 neurons and bursting neurons in the dentate gyrus were not significantly different during theta. However, regular spiking dentate neurons fired 3.1 times faster during theta. These findings reveal that, during periods of theta, average firing rates increased significantly for subicular, bursting CA1, and regular spiking dentate neurons. Together with evidence that theta is more likely to occur preictally, these findings suggest that increased preictal firing rates in the subiculum, CA1, and possibly the dentate gyrus might be attributable to a correlation with theta.
Theta-independent increased preictal firing rates were greatest in the dentate gyrus
To test whether other factors besides theta might correlate with increased preictal activity, effects of theta were eliminated by analyzing only seizures in which theta/delta ratios remained constant or decreased from baseline to preictal periods. For example, during 85% of the seizures when subicular neurons displayed increased preictal activity, theta/delta ratios during the last 0.5–0 min preictal period were higher compared with the baseline period 5.5–5.0 min before seizure onset. Those seizures with increased preictal theta were excluded, leaving 15% whose theta/delta ratios remained the same or decreased from the baseline to the preictal bin 5 min later (Figs. 9A,B). As expected based on theta/delta results for all subicular seizures (Fig. 8A2), when all seizures were included, theta/delta ratios increased significantly during the preictal bin (p < 0.001, Wilcoxon's signed-rank test; Fig. 9A). Also as expected, theta/delta ratios decreased significantly after eliminating seizures with increasing ratios (p < 0.001; Fig. 9B). If increased preictal firing rate correlated exclusively with theta, then after omitting seizures with increased preictal theta, firing rate should not increase preictally. That was not the case. Instead, average firing rate was 1.4 times higher during the preictal bin compared with the baseline bin (p < 0.001; Fig. 9C), whereas the average theta/delta ratio declined (Fig. 9B). These findings reveal that some of the increased preictal firing by subicular neurons is independent of theta.
Figure 9.
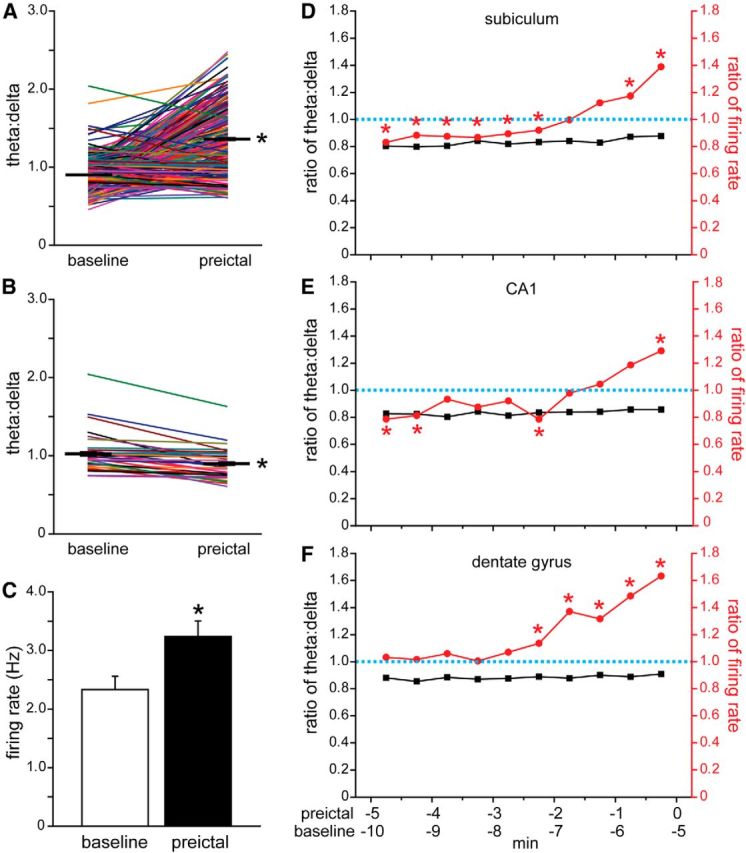
Some increased preictal firing is not correlated with theta activity. A, Theta/delta ratios of all seizures during which subicular neurons with increased preictal activity were recorded. Data from individual seizures are indicated by colored lines. Thick black horizontal lines with error bars (which are small) represent average theta/delta ratios 5.5–5.0 min (baseline) and 0.5–0 min before onset (preictal). *p < 0.001, Wilcoxon's signed-rank test. B, Seizures in which theta/delta ratios increased from baseline to preictal periods were excluded, leaving only those in which theta/delta ratios were unchanged or decreased preictally. *p < 0.001. C, Average firing rates of subicular neurons 5.5–5.0 min (baseline) and 0.5–0 min before onset (preictal) recorded during seizures without preictal theta (B). Values represent mean ± SEM. *p < 0.001. Average action potential firing rates increased preictally during seizures without preictal theta activity in the subiculum (D), CA1 (E), and dentate gyrus (F). D, The right-most marker in the theta/delta plot was calculated by dividing the average theta/delta ratio during the preictal period by that of the baseline period (values in B). Similarly, the right-most marker in the firing rate plot was calculated by dividing the preictal by the baseline average firing rate (values in C). The next set of markers to the left in D represent values calculated identically, expect the baseline period was 6.0–5.5 min and the preictal period was 1.0–0.5 min before seizure onset, and so on. * indicates significantly higher average preictal versus baseline firing rates, as shown, for example in C (p < 0.05, Wilcoxon's signed-rank test). All average preictal theta/delta ratios were significantly lower than baseline (p < 0.05, Wilcoxon's signed-rank test), as expected, because seizures with preictal theta were excluded.
To determine the timing of theta-independent preictal firing, baseline and preictal bins were compared by repeating the process described above after shifting stepwise to progressively earlier pairs of 30-s-duration bins separated by 5 min, for example, baseline bin 6.0–5.5 min and preictal bin 1.0–0.5 min before seizure onset. For each pair of baseline and preictal bins, preictal/baseline ratios were calculated for theta/delta and firing rate. Plots revealed that ratios of theta/delta were stable over the preictal period and <1, as expected, because seizures with increased preictal theta had been excluded (Fig. 9D). In contrast, ratios of firing rate were >1 during the last 1.5 min before seizure onset, and during the last minute, preictal firing rates were significantly higher than those at baseline (p < 0.05, Wilcoxon's signed-rank test). At earlier time points (5.0–2.5 min before seizure onset), preictal firing rates were significantly less than baseline firing rates, which might be attributable to less theta during preictal periods as indicated by ratios of preictal-to-baseline- theta/delta of ∼0.8. Neurons in CA1 displayed results similar to those in subiculum, but theta-independent preictal firing rates were significantly higher than baseline only during the last 0.5 min before seizure onset (Fig. 9E). Comparing PETHs of average firing rate (Figs. 6A1,B1) and average theta/delta ratios (Figs. 8A2,B2) for the subiculum especially but also CA1 revealed similarity in the timing and extent of preictal increases in firing rate and theta. After factoring out theta, remaining preictal increases in firing rate were reduced and significant only during the last 0.5–1.0 min preictally (Fig. 9D,E). These findings suggest that theta is the predominant correlating factor of increased firing rate during preictal periods, but additional, less influential theta-independent mechanisms also contribute in the subiculum and CA1.
In contrast, in the dentate gyrus, preictal firing was more independent of theta. Average preictal theta/delta ratios were lower in the dentate gyrus than in the subiculum and CA1 (Fig. 8A2,D2). Most dentate neurons were classified as bursting units (73%, 38 of 52 neurons), and the average firing rate of bursting dentate units did not change significantly during theta (Table 3). After factoring out theta-related correlations, average preictal firing of dentate gyrus neurons was significantly higher than baseline at 2.5 and 1.5–0 min before seizure onset, and the ratio of preictal/baseline firing peaked at 2.2 (Fig. 9F), which was higher than that for neurons in the subiculum (1.4) and CA1 (1.3). These findings suggest theta-independent mechanisms are primarily responsible for preictal activation of dentate gyrus neurons.
Average preictal activity was similar regardless of brain state
Theta occurs during explorative behavior and REM sleep (Buzsáki, 2002). To evaluate the role that different brain states might have on preictal activity, firing rate PETHs were re-averaged after dividing seizures according to the brain state immediately preceding seizure onset. Four brain states were considered: (1) awake with theta; (2) awake without theta; (3) REM sleep; and (4) non-REM sleep. More than 70% of seizures occurred during sleep, and more than half of all seizures were preceded by non-REM sleep (Table 4). To be classified as REM sleep, theta had to occur up to 5 s or less before seizure onset. Awake-theta occurred preictally during <2% of seizures. Thus, there were too few awake-theta seizures for additional analysis. Considering the remaining three brain states, baseline firing rates were generally similar, except that subicular neurons fired faster during awake-non-theta versus non-REM sleep, and CA3 neurons fired faster during REM versus non-REM sleep. Except for REM sleep in CA3, for which only five seizures were recorded, average peak preictal activity always exceeded average baseline activity. Peak preictal activity was significantly greater (>3 SDs) than average baseline firing rate for all states with sufficient numbers of seizures recorded in the subiculum and CA1. In CA3, average preictal activity increased only during the awake-non-theta state. In the dentate gyrus, average preictal activity increased during REM and non-REM sleep but not during the awake-non-theta state. In summary, these findings suggest, with the possible exception of the awake-non-theta state seizures in the dentate gyrus, that average preictal activity of principal cells in the subiculum, CA1, and dentate gyrus increased similarly regardless of brain state.
Table 4.
Firing rates of principal neurons in the subiculum, CA1, CA3, and dentate gyrus during different brain states preictally
| Subiculum | CA1 | CA3 | Dentate gyrus | |
|---|---|---|---|---|
| Awake-theta | ||||
| n (seizures) | 9 | 10 | 0 | 2 |
| Baseline (Hz) | 1.71 | 0.33 | — | 1.50 |
| Peak preictal (Hz)* | 3.05 | 0.26 | — | 0.33 |
| Preictal/baseline | 1.78** | 0.77 | — | 0.22 |
| Awake-non-theta | ||||
| n (seizures) | 209 | 149 | 26 | 85 |
| Baseline (Hz) | 1.78*** | 0.54 | 0.31 | 0.87 |
| Peak preictal (Hz) | 2.73 | 0.68 | 0.54 | 1.04 |
| Preictal/baseline | 1.54** | 1.24** | 1.77** | 1.19 |
| REM sleep | ||||
| n (seizures) | 116 | 146 | 5 | 16 |
| Baseline (Hz) | 1.57 | 0.42 | 0.67*** | 0.45 |
| Peak preictal (Hz) | 2.65 | 0.58 | 0.43 | 1.11 |
| Preictal/baseline | 1.69** | 1.38** | 0.64 | 2.47** |
| Non-REM sleep | ||||
| n (seizures) | 405 | 393 | 248 | 491 |
| Baseline (Hz) | 1.32 | 0.49 | 0.28 | 0.78 |
| Peak preictal (Hz) | 2.13 | 0.66 | 0.29 | 1.55 |
| Preictal/baseline | 1.62** | 1.34** | 1.05 | 1.99** |
*Firing rate of last or second to last (in CA1) 30-s-duration bin before seizure onset.
**Peak preictal firing rate >3 SDs of baseline firing rate.
***Versus non-REM sleep (p < 0.05, ANOVA with Dunn's test).
Bursting and regular spiking neurons display similar preictal firing patterns
Principal neurons were classified according to whether or not they discharged action potentials in a bursting pattern. Bursting neurons have been proposed to play an important role in seizure genesis (Jensen and Yaari, 1997; Truccolo et al., 2011). To evaluate possible preictal roles of bursting neurons, we asked whether bursting neurons display more preictal activity and whether neurons are more likely to discharge bursts of action potentials preictally.
Bursting was the predominant discharge pattern of CA3 neurons, as expected, and only 2% (1 of 55) of CA3 neurons were classified as regular spiking (Table 3). Similarly, in CA1, 93% (70 of 75) of neurons were classified as bursting, which is consistent with previous reports that, after pilocarpine-treatment in rats, bursting CA1 neurons become more common (Sanabria et al., 2001; Chen et al., 2011). Consequently, there were too few regular spiking units in our sample to compare bursting and regular spiking neurons in CA1 and CA3.
The subiculum and dentate gyrus contained more equitable subpopulations of bursting and regular spiking neurons (Table 3). To compare preictal activity of bursting versus regular spiking subicular neurons, PETHs for both subgroups were generated (data not shown). Group average PETHs of both bursting and regular spiking neurons resembled the average plot for the entire sample of subicular units. For regular spiking subicular units, 26 of 32 (81%) were classified as preictal-increase cells, whereas 28 of 58 (48%) of bursting subicular neurons were classified as preictal-increase cells (p < 0.001, χ2 test). These findings suggest that, in the subiculum, regular spiking neurons might be slightly more involved in preictal activation than bursting neurons.
In the dentate gyrus, average firing rate PETHs of both bursting and regular spiking neurons displayed increased preictal activity approximately similar to the average plot for the entire sample of dentate gyrus units. A larger proportion of regular spiking dentate gyrus neurons was classified as preictal-increase cells (10 of 14, 71%) compared with bursting neurons (8 of 38, 21%; p < 0.01, Fisher's exact test). Together, these results reveal no obvious evidence that bursting neurons in the dentate gyrus or subiculum have a special role in preictal activation. Instead, regular spiking neurons in the subiculum and dentate gyrus appear to become more active preictally.
Some CA1 and subicular neurons become more bursty preictally
To test whether principal cells became more likely to discharge bursts of action potentials as a seizure approaches, the last 1.5 min before seizure onset was analyzed. Burstiness was measured as the conditional probability that a neuron would discharge a second action potential within 10 ms after the first. The number of interspike intervals <10 ms was divided by the total number of spikes. Baseline burstiness was measured by repeating the process 100 times after randomly shifting (7–30 min) from actual seizure onsets to pseudo onsets. Preictal values were considered significantly different if they were >2 SDs from the mean baseline value. Numbers and percentages of principal neurons that became significantly more or less bursty preictally are reported in Table 5. Some subicular (n = 4) and CA3 (n = 1) neurons could not be analyzed for changes in burstiness because of problems with their files. Hippocampal principal cells most likely to become more bursty during the preictal period were CA1 pyramidal cells (12 of 75 neurons, 16%) and regular spiking subicular neurons (5 of 32 neurons, 16%). These findings reveal that limited subpopulations of subicular and CA1 pyramidal cells are more likely to discharge bursts of action potentials in the moments leading up to a spontaneous seizure.
Table 5.
Number and percentage of bursting and regular spiking neurons in the subiculum, CA1, CA3, and dentate gyrus that were significantly more or less likely to discharge bursts of action potentials during the preictal period (1.5–0 min before seizure onset)
| More bursty | Less bursty | |
|---|---|---|
| Subiculum | ||
| Bursting (n = 54) | 2 (4%) | 2 (4%) |
| Regular spiking (n = 32) | 5 (16%) | 0 (0%) |
| CA1 | ||
| Bursting (n = 70) | 10 (14%) | 1 (1%) |
| Regular spiking (n = 5) | 2 (40%) | 0 (0%) |
| CA3 | ||
| Bursting (n = 54) | 3 (6%) | 1 (2%) |
| Dentate gyrus | ||
| Bursting (n = 38) | 1 (3%) | 3 (8%) |
| Regular spiking (n = 14) | 0 (0%) | 0 (0%) |
Ictal unit activity
Although the present study focused on preictal activity, recordings extended through seizures, and average single-unit firing rates during seizures were measured. In the dentate gyrus, average action potential firing rates during seizures were 3.2 times higher than baseline (Fig. 6D1), similar to our previous report (Bower and Buckmaster, 2008). In contrast, in the subiculum, CA1, and CA3, average action potential firing rates were reduced during seizures and were only 34, 52, and 50% of baseline, respectively (Figs. 5B,C, 6A1–C1). Examination of simultaneously recorded multiunit activity, action potentials of sorted units, and LFPs revealed that, despite abundant multiunit activity and clear seizure activity recorded by the same tetrode, single units appeared to discharge action potentials less frequently during seizures recorded in CA3, CA1, and the subiculum (Fig. 3A). Decreased firing and incomplete unit participation during seizures has been reported (Kandel and Spencer, 1961; Matsumoto and Ajmone Marsan, 1964; Sypert and Ward, 1967; Babb and Crandall, 1976; Babb et al., 1987; Bikson et al., 2003; Ziburkus et al., 2006; Gnatkovsky et al., 2008; Truccolo et al., 2011; Grasse et al., 2013). In the penumbra of a core seizure zone, neuronal activity can be inhibited (Prince and Wilder, 1967; Schevon et al., 2012). However, apparently reduced unit activity of excitatory neurons during seizures might be an artifact, because spike-sorting methods make false negatives probable during periods of high activity (Henze et al., 2000; Cymerblit-Sabba and Schiller, 2012). Therefore, in the present study, single-unit firing rate data during seizures is difficult or impossible to interpret.
Discussion
The present study reports the most extensive dataset currently available of preictal activity by individual hippocampal neurons before spontaneous seizures. The main findings are that, in the pilocarpine-treated rat model of temporal lobe epilepsy, average action potential firing rates of principal neurons in CA1, dentate gyrus, and subiculum increased progressively beginning 2–4 min before locally recorded spontaneous seizures. Many individual neurons in the dentate gyrus, CA1, and subiculum displayed increased preictal activity patterns that were significantly consistent across multiple seizures. Preictal activation was earliest and most extensive in the subiculum, moderate in CA3 and the dentate gyrus, and minimal or nonexistent in CA3. Theta was significantly more likely to occur preictally, and theta-correlated increased firing was common in the subiculum and CA1. Increased preictal activity of dentate gyrus neurons was independent of theta. In addition, significant proportions of CA1 and dentate gyrus neurons displayed reduced preictal firing rates.
Heterogeneous preictal activity
Preictal activity was increased in some neurons in the subiculum, CA1, and dentate gyrus and decreased or unchanged in others. Reduced activity might be the result of inhibition by interneurons driven by excitatory neurons whose preictal activity is increased. In addition, many interneurons are more active during theta (Ranck, 1973). The effect of theta on seizure activity is controversial, but some evidence suggests that it is seizure resistant (Miller et al., 1994; Colom et al., 2006). Reduced preictal activity is unlikely to be attributable to lateral inhibition from a seizure core (Schevon et al., 2012), because in epileptic pilocarpine-treated rats, firing rates of preictal-decrease cells fall beginning 90 s before seizure onset (Bower and Buckmaster, 2008), whereas seizures spread throughout the brain more quickly (Toyoda et al., 2013). Neurons with unchanged preictal activity were common in all hippocampal regions. It is unclear whether unchanged activity is attributable to lack of input or balanced excitatory and inhibitory influences that cancel out. Overall, these findings support previous reports of heterogeneous preictal activity of neurons before spontaneous seizures (Bower and Buckmaster, 2008; Truccolo et al., 2011).
Hippocampal subregion heterogeneity
CA3 neurons displayed no average change in precital firing rate, which was surprising because CA3 is reported to be a common site of seizure initiation in pilocarpine-treated rats (Lévesque et al., 2012). Grasse et al. (2013) also found no significant preictal change in average firing rate of CA3 neurons, although there were changes in synchrony. It is unclear why CA3 neurons display less preictal activity than other hippocampal neurons, but the findings suggest that CA3 does not contribute to the buildup in activity leading to spontaneous seizures.
In contrast, the dentate gyrus and CA1 contained substantial proportions of preictal-increase and preictal-decrease neurons, and average preictal firing rates of all recorded neurons in those regions increased 2.0–2.5 min before locally recorded seizure onsets. The CA1 results are novel, but the dentate gyrus findings are similar to our previous report (Bower and Buckmaster, 2008). The present study found higher average preictal firing rates and fewer preictal-decrease cells, which might be attributable to variability in sample populations or differences in data acquisition and analysis methods. Preictal firing rate in CA1 plateaued during the last minute before seizure onset instead of continuing to increase as in other regions. Curtailment of CA1 firing during the last 30 s before seizure onset (Fig. 6B) might be attributable to concurrently high levels of theta (Fig. 8B2), because many inhibitory interneurons in CA1 are activated during theta (Klausberger et al., 2003). However, principal neurons in CA1 also are more active during theta, and increased preictal activity correlated with increased preictal theta. In contrast, mechanisms underlying the theta-independent preictal activation of dentate gyrus neurons remain to be identified.
The subiculum virtually lacked preictal-decrease cells, contained the highest proportion of preictal-increase neurons, and exhibited the earliest increase in average preictal firing rate. As in CA1, much of the increased preictal activity of subicular neurons correlated with preictal theta. It is unclear whether preictal activity in the subiculum was driven from afferent input or generated intrinsically. Major afferents include the entorhinal cortex and CA1, but CA1 is an unlikely source considering its more delayed and less robust preictal activation. Several potentially epileptogenic changes in the subiculum have been revealed in tissue from humans with epilepsy (Cohen et al., 2002; Huberfeld et al., 2007; Alonso-Nanclares et al., 2011) and animal models (Lehmann et al., 2001; Wellmer et al., 2002; Knopp et al., 2005, 2008; He et al., 2010), but their role in preictal activation of subicular neurons is unclear. In summary, neurons in different hippocampal subregions exhibited distinct dynamics and potential mechanisms of preictal activity. These findings are consistent with the concept that different hippocampal subregions might play different roles in ictogenesis (see Introduction).
Consistent preictal activity of individual neurons
In the dentate gyrus, CA1, and subiculum, 41–57% of neurons displayed significantly consistent increased preictal activity. In contrast, results of other studies suggest that seizure-initiating mechanisms are more stochastic. Neuronal activation is more variable before interictal epileptiform events in hippocampal slices exposed to pro-convulsant conditions (Takano et al., 2012; Feldt Muldoon et al., 2013) and in the neocortex of humans with epilepsy (Keller et al., 2010). However, the present study evaluated spontaneous epileptic seizures, which might be different. Neocortical neuronal activity before spontaneous seizures in epileptic humans is more variable (Truccolo et al., 2011), but those recordings were obtained from a different brain region. Hippocampal multiunit activity before spontaneous seizures in epileptic humans is more variable (Bower et al., 2012), but activity of individual excitatory principal neurons might be different. The findings of the present study of significantly consistent increased preictal activity have potential implications for ictogenesis and seizure prediction.
Will unit activity be useful for seizure prediction?
Results of the present study suggest limitations and possibilities for using unit activity to predict seizures. Limitations include technical challenges of recording and isolating unit activity of individual neurons. Many neurons fail to display significant changes in preictal activity (Fig. 7). Even those neurons with significantly consistent preictal activity had variable baseline firing rates, raising the possibility of false-positive seizure warnings (Fig. 5B). Therefore, seizure prediction is likely to require simultaneous recording and averaging data from multiple units, which is not necessarily equivalent to simply recording multiunit activity. Findings of the present study also revealed that preictal firing rate increases in some regions (subiculum and CA1) correlated with theta and were not necessarily specifically correlated with seizures, again raising the possibility of false-positive seizure warnings.
Despite limitations, possibilities for seizure prediction emerge from the present results. Average firing rates increased significantly in the subiculum, CA1, and dentate gyrus of the dorsal hippocampus beginning 2–4 min before seizure onset (Fig. 6), although it is likely that most seizures initiated elsewhere in the brain. These findings suggest three potentially important points. First, there may be sufficient time to detect preictal changes in firing rate before electrographic onset and loss of consciousness. Second, it might not be necessary to record at the site of seizure onset to detect preictal activity, which broadens opportunities. Third, because many neurons in CA1, dentate gyrus, and especially the subiculum displayed significantly consistent changes in preictal activity across multiple seizures, it might be possible to provide more reliable predictions by focusing analysis on specific cells.
How do spontaneous seizures start?
One speculative hypothesis is that a minutes-long buildup of preictal activity in the dentate gyrus, CA1, and subiculum contributes to the beginning of spontaneous seizures. The present study obtained recordings from the right dorsal hippocampus in 13 rats as they experienced 790 seizures. Without electrodes implanted in many other brain regions, it is impossible to know where seizures initiated. Onset site tends to vary from seizure to seizure in patients with temporal lobe epilepsy (Lieb et al., 1976; Spencer et al., 1990; Spencer and Spencer, 1994; Spencer, 1998, 2002) and in rodent models of temporal lobe epilepsy (Bertram, 1997; Bertram et al., 2001; Lévesque et al., 2012). Based on our previous recordings of many brain regions in pilocarpine-treated rats (Toyoda et al., 2013), only 9% of seizures in the present study were likely to have initiated in the region where unit recordings were obtained. It may seem surprising then that high proportions of subicular, CA1, and dentate gyrus principal neurons displayed significantly consistent preictal activity patterns, in many cases for 100% of recorded seizures. These findings suggest the existence of a neuronal network whose activity changes minutes before spontaneous seizures initiate, regardless of where in the network the electrographic onset eventually occurs. Seizure generation has been proposed to involve not one but a network of structures that includes the hippocampus (Spencer and Spencer, 1994; Bragin et al., 2000; Bartolomei et al., 2008; Fabó et al., 2008). The present study extends that idea earlier into the preictal period and provides evidence of a network of preictally activated (and in some cases, inactivated) principal cells in some but not all subregions of the dorsal hippocampus. Remaining questions include whether there are other members of this preictal network and whether blocking preictal activation of specific subregions is sufficient to prevent seizures.
Footnotes
This work was supported by National Institutes of Health/National Institute of Neurological Disorders and Stroke.
The authors declare no competing financial interests.
References
- Alme CB, Buzzetti RA, Marrone DF, Leutgeb JK, Chawla MK, Schaner MJ, Bohanick JD, Khoboko T, Leutgeb S, Moser EI, Moser MB, McNaughton BL, Barnes CA. Hippocampal granule cells opt for early retirement. Hippocampus. 2010;20:1109–1123. doi: 10.1002/hipo.20810. [DOI] [PubMed] [Google Scholar]
- Alonso-Nanclares L, Kastanauskaite A, Rodriguez JR, Gonzalez-Soriano J, Defelipe J. A stereological study of synapse number in the epileptic human hippocampus. Front Neuroanat. 2011;5:8. doi: 10.3389/fnana.2011.00008. [DOI] [PMC free article] [PubMed] [Google Scholar]
- Anderson MI, O'Mara SM. Analysis of recordings of single-unit firing and population activity in the dorsal subiculum of unrestrained, freely moving rats. J Neurophysiol. 2003;90:655–665. doi: 10.1152/jn.00723.2002. [DOI] [PubMed] [Google Scholar]
- Avoli M, Barbarosie M, Lücke A, Nagao T, Lopantsev V, Köhling R. Synchronous GABA-mediated potentials and epileptiform discharges in the rat limbic system in vitro. J Neurosci. 1996;16:3912–3924. doi: 10.1523/JNEUROSCI.16-12-03912.1996. [DOI] [PMC free article] [PubMed] [Google Scholar]
- Babb TL, Crandall PH. Epileptogenesis of human limbic neurons in psychomotor epileptics. Electroencephalogr Clin Neurophysiol. 1976;40:225–243. doi: 10.1016/0013-4694(76)90147-4. [DOI] [PubMed] [Google Scholar]
- Babb TL, Wilson CL, Isokawa-Akesson M. Firing patterns of human limbic neurons during stereoencephalography (SEEG) and clinical temporal lobe seizures. Electroencephalogr Clin Neurophysiol. 1987;66:467–482. doi: 10.1016/0013-4694(87)90093-9. [DOI] [PubMed] [Google Scholar]
- Bartolomei F, Khalil M, Wendling F, Sontheimer A, Régis J, Ranjeva JP, Guye M, Chauvel P. Entorhinal cortex involvement in human mesial temporal lobe epilepsy: an electrophysiologic and volumetric study. Epilepsia. 2005;46:677–687. doi: 10.1111/j.1528-1167.2005.43804.x. [DOI] [PubMed] [Google Scholar]
- Bartolomei F, Chauvel P, Wendling F. Epileptogenicity of brain structures in human temporal lobe epilepsy: a quantified study from intracerebral EEG. Brain. 2008;131:1818–1830. doi: 10.1093/brain/awn111. [DOI] [PubMed] [Google Scholar]
- Bertram EH. Functional anatomy of spontaneous seizures in a rat model of limbic epilepsy. Epilepsia. 1997;38:95–105. doi: 10.1111/j.1528-1157.1997.tb01083.x. [DOI] [PubMed] [Google Scholar]
- Bertram EH, Mangan PS, Zhang D, Scott CA, Williamson JM. The midline thalamus: alterations and a potential role in limbic epilepsy. Epilepsia. 2001;42:967–978. doi: 10.1046/j.1528-1157.2001.042008967.x. [DOI] [PubMed] [Google Scholar]
- Bikson M, Fox JE, Jefferys JGR. Neuronal aggregate formation underlies spatiotemporal dynamics of nonsynaptic seizure initiation. J Neurophysiol. 2003;89:2330–2333. doi: 10.1152/jn.00764.2002. [DOI] [PubMed] [Google Scholar]
- Bland BH, Konopacki J, Dyck R. Heterogeneity among hippocampal pyramidal neurons revealed by their relation to theta-band oscillation and synchrony. Exp Neurol. 2005;195:458–474. doi: 10.1016/j.expneurol.2005.06.007. [DOI] [PubMed] [Google Scholar]
- Bower MR, Buckmaster PS. Changes in granule cell firing rates precede locally recorded spontaneous seizures by minutes in an animal model of temporal lobe epilepsy. J Neurophysiol. 2008;99:2431–2442. doi: 10.1152/jn.01369.2007. [DOI] [PubMed] [Google Scholar]
- Bower MR, Stead M, Meyer FB, Marsh WR, Worrell GA. Spatiotemporal neuronal correlates of seizure generation in focal epilepsy. Epilepsia. 2012;53:807–816. doi: 10.1111/j.1528-1167.2012.03417.x. [DOI] [PMC free article] [PubMed] [Google Scholar]
- Bragin A, Engel J, Jr, Wilson CL, Vizentin E, Mathern GW. Electrophysiologic analysis of a chronic seizure model after unilateral hippocampal KA injection. Epilepsia. 1999;40:1210–1221. doi: 10.1111/j.1528-1157.1999.tb00849.x. [DOI] [PubMed] [Google Scholar]
- Bragin A, Wilson CL, Engel J., Jr Chronic epileptogenesis requires development of a network of pathologically interconnected neuron clusters: a hypothesis. Epilepsia. 2000;41(Suppl 6):S144–S152. doi: 10.1111/j.1528-1157.2000.tb01573.x. [DOI] [PubMed] [Google Scholar]
- Butuzova MV, Kitchigina VF. Repeated blockade of GABAA receptors in the medial septal region induces epileptiform activity in the hippocampus. Neurosci Lett. 2008;434:133–138. doi: 10.1016/j.neulet.2008.01.050. [DOI] [PubMed] [Google Scholar]
- Buzsáki G. Theta oscillations in the hippocampus. Neuron. 2002;33:325–340. doi: 10.1016/s0896-6273(02)00586-x. [DOI] [PubMed] [Google Scholar]
- Chauvière L, Rafrafi N, Thinus-Blanc C, Bartolomei F, Esclapez M, Bernard C. Early deficits in spatial memory and theta rhythm in experimental temporal lobe epilepsy. J Neurosci. 2009;29:5402–5410. doi: 10.1523/JNEUROSCI.4699-08.2009. [DOI] [PMC free article] [PubMed] [Google Scholar]
- Chen S, Su H, Yue C, Remy S, Royeck M, Sochivko D, Opitz T, Beck H, Yaari Y. An increase in persistent sodium current contributes to intrinsic neuronal bursting after status epilepticus. J Neurophysiol. 2011;105:117–129. doi: 10.1152/jn.00184.2010. [DOI] [PubMed] [Google Scholar]
- Cohen I, Navarro V, Clemenceau S, Baulac M, Miles R. On the origin of interictal activity in human temporal lobe epilepsy in vitro. Science. 2002;298:1418–1421. doi: 10.1126/science.1076510. [DOI] [PubMed] [Google Scholar]
- Colom LV, García-Hernández A, Castañeda MT, Perez-Cordova MG, Garrido-Sanabria ER. Septo-hippocampal networks in chronically epileptic rats: potential antiepileptic effects of theta rhythm generation. J Neurophysiol. 2006;95:3645–3653. doi: 10.1152/jn.00040.2006. [DOI] [PubMed] [Google Scholar]
- Csicsvari J, Hirase H, Czurkó A, Mamiya A, Buzsáki G. Oscillatory coupling of hippocampal pyramidal cells and interneurons in the behaving rat. J Neurosci. 1999;19:274–287. doi: 10.1523/JNEUROSCI.19-01-00274.1999. [DOI] [PMC free article] [PubMed] [Google Scholar]
- Cymerblit-Sabba A, Schiller Y. Development of hypersynchrony in the cortical network during chemoconvulsant-induced epileptic seizures in vivo. J Neurophysiol. 2012;107:1718–1730. doi: 10.1152/jn.00327.2011. [DOI] [PubMed] [Google Scholar]
- Engel J, Jr, Williamson PD, Wieser HG. Mesial temporal lobe epilepsy. In: Engel J Jr, Pedley TA, editors. Epilepsy: a comprehensive textbook. Philadelphia: Lippincott-Raven; 1997. pp. 2417–2426. [Google Scholar]
- Fabó D, Maglóczky Z, Wittner L, Pék A, Eross L, Czirják S, Vajda J, Sólyom A, Rásonyi G, Szucs A, Kelemen A, Juhos V, Grand L, Dombovári B, Halász P, Freund TF, Halgren E, Karmos G, Ulbert I. Properties of in vivo interictal spike generation in the human subiculum. Brain. 2008;131:485–499. doi: 10.1093/brain/awm297. [DOI] [PubMed] [Google Scholar]
- Feldt Muldoon SF, Soltesz I, Cossart R. Spatially clustered neuronal assemblies comprise the microstructure of synchrony in chronically epileptic networks. Proc Natl Acad Sci U S A. 2013;110:3567–3572. doi: 10.1073/pnas.1216958110. [DOI] [PMC free article] [PubMed] [Google Scholar]
- Fox SE, Ranck JB., Jr Localization and anatomical identification of theta and complex spike cells in dorsal hippocampal formation of rats. Exp Neurol. 1975;49:299–313. doi: 10.1016/0014-4886(75)90213-7. [DOI] [PubMed] [Google Scholar]
- Gnatkovsky V, Librizzi L, Trombin F, de Curtis M. Fast activity at seizure onset is mediated by inhibitory circuits in the entorhinal cortex in vitro. Ann Neurol. 2008;64:674–686. doi: 10.1002/ana.21519. [DOI] [PubMed] [Google Scholar]
- Grasse DW, Karunakaran S, Moxon KA. Neuronal synchrony and the transition to spontaneous seizures. Exp Neurol. 2013;248:72–84. doi: 10.1016/j.expneurol.2013.05.004. [DOI] [PubMed] [Google Scholar]
- Harris KD, Henze DA, Csicsvari J, Hirase H, Buzsáki G. Accuracy of tetrode spike separation as determined by simultaneous intracellular and extracellular measurements. J Neurophysiol. 2000;84:401–414. doi: 10.1152/jn.2000.84.1.401. [DOI] [PubMed] [Google Scholar]
- He de F, Ma DL, Tang YC, Engel J, Jr, Bragin A, Tang FR. Morpho-physiologic characteristics of dorsal subicular network in mice after pilocarpine-induced status epilepticus. Brain Pathol. 2010;20:80–95. doi: 10.1111/j.1750-3639.2009.00243.x. [DOI] [PMC free article] [PubMed] [Google Scholar]
- Hellier JL, Dudek FE. Spontaneous motor seizures of rats with kainate-induced epilepsy: effect of time of day and activity state. Epilepsy Res. 1999;35:47–57. doi: 10.1016/S0920-1211(98)00127-2. [DOI] [PubMed] [Google Scholar]
- Henze DA, Borhegyi Z, Csicsvari J, Mamiya A, Harris KD, Buzsáki G. Intracellular features predicted by extracellular recordings in the hippocampus in vivo. J Neurophysiol. 2000;84:390–400. doi: 10.1152/jn.2000.84.1.390. [DOI] [PubMed] [Google Scholar]
- Huberfeld G, Wittner L, Clemenceau S, Baulac M, Kaila K, Miles R, Rivera C. Perturbed chloride homeostasis and GABAergic signaling in human temporal lobe epilepsy. J Neurosci. 2007;27:9866–9873. doi: 10.1523/JNEUROSCI.2761-07.2007. [DOI] [PMC free article] [PubMed] [Google Scholar]
- Huberfeld G, Menendez de la Prida L, Pallud J, Cohen I, Le Van Quyen M, Adam C, Clemenceau S, Baulac M, Miles R. Glutamatergic pre-ictal discharges emerge at the transition to seizure in human epilepsy. Nat Neurosci. 2011;14:627–634. doi: 10.1038/nn.2790. [DOI] [PubMed] [Google Scholar]
- Inostroza M, Brotons-Mas JR, Laurent F, Cid E, de la Prida LM. Specific impairment of “what-where-when” episodic-like memory in experimental models of temporal lobe epilepsy. J Neurosci. 2013;33:17749–17762. doi: 10.1523/JNEUROSCI.0957-13.2013. [DOI] [PMC free article] [PubMed] [Google Scholar]
- Jefferys JGR, Hass HL. Synchronized bursting of CA1 hippocampal pyramidal cells in the absence of synaptic transmission. Nature. 1982;300:448–450. doi: 10.1038/300448a0. [DOI] [PubMed] [Google Scholar]
- Jensen MS, Yaari Y. Role of intrinsic burst firing, potassium accumulation, and electrical coupling in the elevated potassium model of hippocampal epilepsy. J Neurophysiol. 1997;77:1224–1233. doi: 10.1152/jn.1997.77.3.1224. [DOI] [PubMed] [Google Scholar]
- Jung MW, McNaughton BL. Spatial selectivity of unit activity in the hippocampal granular layer. Hippocampus. 1993;3:165–182. doi: 10.1002/hipo.450030209. [DOI] [PubMed] [Google Scholar]
- Kandel ER, Spencer WA. Excitation and inhibition of single pyramidal cells during hippocampal seizure. Exp Neurol. 1961;4:162–179. doi: 10.1016/0014-4886(61)90038-3. [DOI] [PubMed] [Google Scholar]
- Keller CJ, Truccolo W, Gale JT, Eskandar E, Thesen T, Carlson C, Devinsky O, Kuzniecky R, Doyle WK, Madsen JR, Schomer DL, Mehta AD, Brown EN, Hochberg LR, Ulbert I, Halgren E, Cash SS. Heterogeneous neuronal firing patterns during interictal epileptiform discharges in the human cortex. Brain. 2010;133:1668–1681. doi: 10.1093/brain/awq112. [DOI] [PMC free article] [PubMed] [Google Scholar]
- Kitchigina VF, Butuzova MV. Theta activity of septal neurons during different epileptic phases: the same frequency but different significance? Exp Neurol. 2009;216:449–458. doi: 10.1016/j.expneurol.2009.01.001. [DOI] [PubMed] [Google Scholar]
- Klausberger T, Magill PJ, Márton LF, Roberts JDB, Cobden PM, Buzsáki G, Somogyi P. Brain-state- and cell-type-specific firing of hippocampal interneurons in vivo. Nature. 2003;421:844–848. doi: 10.1038/nature01374. [DOI] [PubMed] [Google Scholar]
- Knopp A, Kivi A, Wozny C, Heinemann U, Behr J. Cellular and network properties of the subiculum in the pilocarpine model of temporal lobe epilepsy. J Comp Neurol. 2005;483:476–488. doi: 10.1002/cne.20460. [DOI] [PubMed] [Google Scholar]
- Knopp A, Frahm C, Fidzinski P, Witte OW, Behr J. Loss of GABAergic neurons in the subiculum and its functional implications in temporal lobe epilepsy. Brain. 2008;131:1516–1527. doi: 10.1093/brain/awn095. [DOI] [PubMed] [Google Scholar]
- Lehmann TN, Gabriel S, Eilers A, Njunting M, Kovacs R, Schulze K, Lanksch WR, Heinemann U. Fluorescent tracer in pilocarpine-treated rats shows widespread aberrant hippocampal neuronal connectivity. Eur J Neurosci. 2001;14:83–95. doi: 10.1046/j.0953-816x.2001.01632.x. [DOI] [PubMed] [Google Scholar]
- Lenck-Santini PP, Holmes GL. Altered phase precession and compression of temporal sequences by place cells in epileptic rats. J Neurosci. 2008;28:5053–5062. doi: 10.1523/JNEUROSCI.5024-07.2008. [DOI] [PMC free article] [PubMed] [Google Scholar]
- Leutgeb JK, Leutgeb S, Moser MB, Moser EI. Pattern separation in the dentate gyrus and CA3 of the hippocampus. Science. 2007;315:961–966. doi: 10.1126/science.1135801. [DOI] [PubMed] [Google Scholar]
- Lévesque M, Salami P, Gotman J, Avoli M. Two seizure-onset types reveal specific patterns of high-frequency oscillations in a model of temporal lobe epilepsy. J Neurosci. 2012;32:13264–13272. doi: 10.1523/JNEUROSCI.5086-11.2012. [DOI] [PMC free article] [PubMed] [Google Scholar]
- Lieb JP, Walsh GO, Babb TL, Walter RD, Crandall PH. A comparison of EEG seizure patterns recorded with surface and depth electrodes in patients with temporal lobe epilepsy. Epilepsia. 1976;17:137–160. doi: 10.1111/j.1528-1157.1976.tb03392.x. [DOI] [PubMed] [Google Scholar]
- Lin H, Hangya B, Fox SE, Muller RU. Repetitive convulsant-induced seizures reduce the number but not precision of hippocampal place cells. J Neurosci. 2012;32:4163–4178. doi: 10.1523/JNEUROSCI.4900-11.2012. [DOI] [PMC free article] [PubMed] [Google Scholar]
- Margerison JH, Corsellis JA. Epilepsy and the temporal lobes. Brain. 1966;89:499–530. doi: 10.1093/brain/89.3.499. [DOI] [PubMed] [Google Scholar]
- Matsumoto H, Ajmone Marsan C. Cortical cellular phenomena in experimental epilepsy: ictal manifestations. Exp Neurol. 1964;9:305–326. doi: 10.1016/0014-4886(64)90026-3. [DOI] [PubMed] [Google Scholar]
- Mello LE, Cavalheiro EA, Tan AM, Kupfer WR, Pretorius JK, Babb TL, Finch DM. Circuit mechanisms of seizures in the pilocarpine model of chronic epilepsy: cell loss and mossy fiber sprouting. Epilepsia. 1993;34:985–995. doi: 10.1111/j.1528-1157.1993.tb02123.x. [DOI] [PubMed] [Google Scholar]
- Miller JW, Turner GM, Gray BC. Anticonvulsant effects of the experimental induction of hippocampal theta activity. Epilepsy Res. 1994;18:195–204. doi: 10.1016/0920-1211(94)90040-X. [DOI] [PubMed] [Google Scholar]
- Mitchell SJ, Ranck JB., Jr Generation of theta rhythm in medial entorhinal cortex of freely moving rats. Brain Res. 1980;189:49–66. doi: 10.1016/0006-8993(80)90006-2. [DOI] [PubMed] [Google Scholar]
- Mody I, Lambert JDC, Heinemann U. Low extracellular magnesium induces epileptiform activity and spreading depression in rat hippocampal slices. J Neurophysiol. 1987;57:869–888. doi: 10.1152/jn.1987.57.3.869. [DOI] [PubMed] [Google Scholar]
- Neunuebel JP, Knierim JJ. Spatial firing correlates of physiologically distinct cell types of the rat dentate gyrus. J Neurosci. 2012;32:3848–3858. doi: 10.1523/JNEUROSCI.6038-11.2012. [DOI] [PMC free article] [PubMed] [Google Scholar]
- Paxinos G, Watson C. The rat brain in stereotaxic coordinates. Ed 6. Burlington, MA: Elsevier/Academic; 2009. [Google Scholar]
- Popova IY, Sinelnikova VV, Kitchigina VF. Disturbance of the correlation between hippocampal and septal EEGs during epileptogenesis. Neurosci Lett. 2008;442:228–233. doi: 10.1016/j.neulet.2008.07.016. [DOI] [PubMed] [Google Scholar]
- Prince DA, Wilder BJ. Control mechanisms in cortical epileptogenic foci. Arch Neurol. 1967;16:194–202. doi: 10.1001/archneur.1967.00470200082007. [DOI] [PubMed] [Google Scholar]
- Quesney LF. Clinical and EEG features of complex partial seizures of temporal lobe origin. Epilepsia. 1986;27(Suppl 2):S27–S45. doi: 10.1111/j.1528-1157.1986.tb05738.x. [DOI] [PubMed] [Google Scholar]
- Racine RJ. Modification of seizure activity by electrical stimulation: II. Motor seizure. Electroencephalogr Clin Neurophysiol. 1972;32:281–294. doi: 10.1016/0013-4694(72)90177-0. [DOI] [PubMed] [Google Scholar]
- Rafiq A, DeLorenzo RJ, Coulter DA. Generation and propagation of epileptiform discharges in a combined entorhinal cortex/hippocampal slice. J Neurophysiol. 1993;70:1962–1974. doi: 10.1152/jn.1993.70.5.1962. [DOI] [PubMed] [Google Scholar]
- Ranck JB., Jr Studies on single neurons in dorsal hippocampal formation and septum in unrestrained rats. I. Behavioral correlates and firing repertoires. Exp Neurol. 1973;41:461–531. doi: 10.1016/0014-4886(73)90290-2. [DOI] [PubMed] [Google Scholar]
- Royer S, Zemelman BV, Losonczy A, Kim J, Chance F, Magee JC, Buzsáki G. Control of timing, rate and bursts of hippocampal place cells by dendritic and somatic inhibition. Nat Neurosci. 2012;15:769–775. doi: 10.1038/nn.3077. [DOI] [PMC free article] [PubMed] [Google Scholar]
- Sanabria ERG, Su H, Yaari Y. Initiation of network bursts by Ca2+-dependent intrinsic bursting in the rat pilocarpine model of temporal lobe epilepsy. J Physiol. 2001;532:205–216. doi: 10.1111/j.1469-7793.2001.0205g.x. [DOI] [PMC free article] [PubMed] [Google Scholar]
- Schevon CA, Weiss SA, McKhann G, Jr, Goodman RR, Yuste R, Emerson RG, Trevelyan AJ. Evidence of an inhibitory restraint of seizure activity in humans. Nat Commun. 2012;3:1060. doi: 10.1038/ncomms2056. [DOI] [PMC free article] [PubMed] [Google Scholar]
- Sedigh-Sarvestani M, Thuku GI, Sunderam S, Parkar A, Weinstein SL, Schiff SJ, Gluckman BJ. Rapid eye movement sleep and hippocampal theta oscillations precede seizure onset in the tetanus toxin model of temporal lobe epilepsy. J Neurosci. 2014;34:1105–1114. doi: 10.1523/JNEUROSCI.3103-13.2014. [DOI] [PMC free article] [PubMed] [Google Scholar]
- Sharp PE, Green C. Spatial correlates of firing patterns of single cells in the subiculum of the freely moving rat. J Neurosci. 1994;14:2339–2356. doi: 10.1523/JNEUROSCI.14-04-02339.1994. [DOI] [PMC free article] [PubMed] [Google Scholar]
- Sirota A, Montgomery S, Fujisawa S, Isomura Y, Zugaro M, Buzsáki G. Entrainment of neocortical neurons and gamma oscillations by the hippocampal theta rhythm. Neuron. 2008;60:683–697. doi: 10.1016/j.neuron.2008.09.014. [DOI] [PMC free article] [PubMed] [Google Scholar]
- Spencer SS. Substrates of localization-related epilepsies: biologic implications of localizing findings in humans. Epilepsia. 1998;39:114–123. doi: 10.1111/j.1528-1157.1998.tb01349.x. [DOI] [PubMed] [Google Scholar]
- Spencer SS. Neural networks in human epilepsy: evidence of and implications for treatment. Epilepsia. 2002;43:219–227. doi: 10.1046/j.1528-1157.2002.26901.x. [DOI] [PubMed] [Google Scholar]
- Spencer SS, Spencer DD. Entorhinal-hippocampal interactions in medial temporal lobe epilepsy. Epilepsia. 1994;35:721–727. doi: 10.1111/j.1528-1157.1994.tb02502.x. [DOI] [PubMed] [Google Scholar]
- Spencer SS, Williamson PD, Spencer DD, Mattson RH. Human hippocampal seizure spread studied by depth and subdural recording: the hippocampal commissure. Epilepsia. 1987;28:479–489. doi: 10.1111/j.1528-1157.1987.tb03676.x. [DOI] [PubMed] [Google Scholar]
- Spencer SS, Spencer DD, Williamson PD, Mattson R. Combined depth and subdural electrode investigation in uncontrolled epilepsy. Neurology. 1990;40:74–79. doi: 10.1212/WNL.40.1.74. [DOI] [PubMed] [Google Scholar]
- Spencer SS, Guimaraes P, Katz A, Kim J, Spencer D. Morphological patterns of seizures recorded intracranially. Epilepsia. 1992;33:537–545. doi: 10.1111/j.1528-1157.1992.tb01706.x. [DOI] [PubMed] [Google Scholar]
- Sperling MR, O'Connor MJ. Comparison of depth and subdural electrodes in recording temporal lobe seizures. Neurology. 1989;39:1497–1504. doi: 10.1212/WNL.39.11.1497. [DOI] [PubMed] [Google Scholar]
- Sypert GW, Ward AA. The hyperexcitable neuron: microelectrode studies of the chronic epileptic focus in the intact, awake monkey. Exp Neurol. 1967;19:107–114. doi: 10.1016/0014-4886(67)90010-6. [DOI] [PubMed] [Google Scholar]
- Takano H, McCartney M, Ortinski PI, Yue C, Putt ME, Coulter DA. Deterministic and stochastic neuronal contributions to distinct synchronous CA3 network bursts. J Neurosci. 2012;32:4743–4754. doi: 10.1523/JNEUROSCI.4277-11.2012. [DOI] [PMC free article] [PubMed] [Google Scholar]
- Toyoda I, Bower MR, Leyva F, Buckmaster PS. Early activation of ventral hippocampus and subiculum during spontaneous seizures in a rat model of temporal lobe epilepsy. J Neurosci. 2013;33:11100–11115. doi: 10.1523/JNEUROSCI.0472-13.2013. [DOI] [PMC free article] [PubMed] [Google Scholar]
- Traynelis SF, Dingledine R. Potassium-induced spontaneous electrographic seizures in the rat hippocampal slice. J Neurophysiol. 1988;59:259–276. doi: 10.1152/jn.1988.59.1.259. [DOI] [PubMed] [Google Scholar]
- Truccolo W, Donoghue JA, Hochberg LR, Eskandar EN, Madsen JR, Anderson WS, Brown EN, Halgren E, Cash SS. Single-neuron dynamics in human focal epilepsy. Nat Neurosci. 2011;14:635–641. doi: 10.1038/nn.2782. [DOI] [PMC free article] [PubMed] [Google Scholar]
- Tyler AL, Mahoney JM, Richard GR, Holmes GL, Lenck-Santini PP, Scott RC. Functional network changes in hippocampal CA1 after status epilepticus predict spatial memory deficits in rats. J Neurosci. 2012;32:11365–11376. doi: 10.1523/JNEUROSCI.1516-12.2012. [DOI] [PMC free article] [PubMed] [Google Scholar]
- Verzeano M, Crandall PH, Dymond A. Neuronal activity of the amygdala in patients with psychomotor epilepsy. Neuropsychologia. 1971;9:331–344. doi: 10.1016/0028-3932(71)90029-7. [DOI] [PubMed] [Google Scholar]
- Viskontas IV, Ekstrom AD, Wilson CL, Fried I. Characterizing interneuron and pyramidal cells in the human medial temporal lobe in vivo using extracellular recordings. Hippocampus. 2007;17:49–57. doi: 10.1002/hipo.20241. [DOI] [PubMed] [Google Scholar]
- Walker WG, Dovey VJ. Electro-encephalography in cases of sub-cortical tumour. J Neurol Neurosurg Psych. 1944;7:57–65. doi: 10.1136/jnnp.7.3-4.57. [DOI] [PMC free article] [PubMed] [Google Scholar]
- Wellmer J, Su H, Beck H, Yaari Y. Long-lasting modification of intrinsic discharge properties in subicular neurons following status epilepticus. Eur J Neurosci. 2002;16:259–266. doi: 10.1046/j.1460-9568.2002.02086.x. [DOI] [PubMed] [Google Scholar]
- Wennberg R, Arruda F, Quesney LF, Olivier A. Preeminence of extrahippocampal structures in the generation of mesial temporal seizures: evidence from human depth electrode recordings. Epilepsia. 2002;43:716–726. doi: 10.1046/j.1528-1157.2002.31101.x. [DOI] [PubMed] [Google Scholar]
- West MJ, Slomianka L, Gundersen HJ. Unbiased stereological estimation of the total number of neurons in the subdivisions of the rat hippocampus using the optical fractionator. Anat Rec. 1991;231:482–497. doi: 10.1002/ar.1092310411. [DOI] [PubMed] [Google Scholar]
- Ziburkus J, Cressman JR, Barreto E, Schiff SJ. Interneuron and pyramidal cell interplay during in vitro seizure-like events. J Neurophysiol. 2006;95:3948–3954. doi: 10.1152/jn.01378.2005. [DOI] [PMC free article] [PubMed] [Google Scholar]