

Abstract
OBJECTIVES:
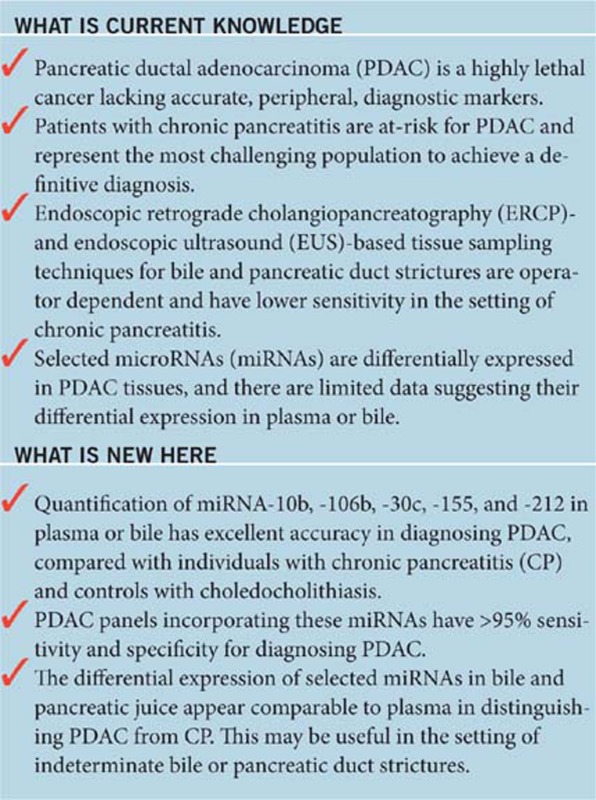
Accurate peripheral markers for the diagnosis of pancreatic ductal adenocarcinoma (PDAC) are lacking. We measured the differential expression of select microRNAs (miRNAs) in plasma and bile among patients with PDAC, chronic pancreatitis (CP), and controls.
METHODS:
We identified patients (n=215) with treatment-naive PDAC (n=77), CP with bile/pancreatic duct pathology (n=67), and controls (n=71) who had been prospectively enrolled in a Pancreatobiliary Biorepository at the time of endoscopic retrograde cholangiopancreatography or endoscopic ultrasound. Controls were patients with choledocholithiasis but normal pancreata. The sample was separated into training (n=95) and validation (n=120) cohorts to establish and then test the performance of PDAC Signature Panels in diagnosing PDAC. The training cohort (n=95) included age-matched patients with PDAC, CP, and controls. Panels were derived from the differential expression of 10 candidate miRNAs in plasma or bile. We selected miRNAs having excellent accuracy for inclusion in regression models.
RESULTS:
Using the training cohort, we confirmed the differential expression of 9/10 miRNAs in plasma (miR-10b, -30c, -106b, -132, -155, -181a, -181b, -196a, and -212) and 7/10 in bile (excluding miR-21, -132, and -181b). Of these, five (miR-10b, -155, -106b, -30c, and -212) had excellent accuracy for distinguishing PDAC. In the training and validation cohorts, the sensitivity/specificity for a PDAC Panel derived from plasma was 95/100% and 100/100%, respectively; in bile, these were 96/100% and 100/100%.
CONCLUSIONS:
Increased expression of miRNA-10b, -155, and -106b in plasma appears highly accurate in diagnosing PDAC. Additional studies are needed to confirm this Panel and explore its value as a prognostic test.
INTRODUCTION
The absence of reliable blood markers for pancreatic ductal adenocarcinoma (PDAC) reduces the potential effectiveness of screening strategies in at-risk populations such as those with chronic pancreatitis (CP). Furthermore, among individuals with PDAC, there are no histological or molecular targets currently applied in the clinical setting to direct therapy or inform survival estimates. Therefore, the discovery of biomarkers derived from blood or bile that facilitate the distinction of PDAC from CP and provide prognostic information for individuals with PDAC would greatly affect patient management. In addition, biomarkers may guide studies designed to elucidate dysplasia-to-carcinoma mechanism(s) specific to PDAC and identify gene or protein targets for novel therapies.
Because of their biological stability and role in cancer pathobiology (1, 2, 3), microRNAs (miRNAs) have substantial potential as cancer biomarkers (4, 5). The miRNAs are short, noncoding RNAs consisting of 18–25 nucleotides that function by targeting specific mRNA moieties for translational repression or degradation, thereby regulating several biological processes including cell proliferation, migration, invasion, survival, and metastasis (6, 7, 8, 9). The miRNAs have also been implicated in the modulation of PDAC progression and patient survival (10, 11, 12, 13, 14, 15, 16). The majority of studies evaluating miRNAs in PDAC are derived from surgical tissue samples; nearly 100 miRNAs have been identified by their differential expression in PDAC tissue (10, 11, 12, 13, 14, 15, 16, 17, 18). For maximal utility in the clinical setting—screening, treatment planning, and assessment of treatment response—the optimal PDAC biomarker(s) would be identified from a blood sample, and following referral for specialized endoscopic procedures, biomarkers could be readily assayed in bile or pancreatic juice aspirates, or PDAC tissue obtained by fine-needle aspirate.
The primary objective of this pilot study was to assess the utility of select miRNAs as diagnostic markers for differentiating PDAC from CP and from individuals without pancreatic disorders by comparing the differential expression of miRNAs in plasma and bile among individuals with PDAC, CP, and normal pancreas. Secondarily, we describe the differential expression of miRNAs in the subgroup of individuals having pancreatic juice samples available for analysis.
METHODS
Patient cohort
We selected patients from a cohort who had been prospectively enrolled between July 2012 and February 2014 into a Pancreatobiliary Diseases Database and Biological Repository at Indiana University School of Medicine. This database includes individuals with PDAC, CP, or other benign pancreatobiliary diseases undergoing endoscopic ultrasound (EUS) or endoscopic retrograde cholangiopancreatography (ERCP) at Indiana University Health University Hospital, Indianapolis, Indiana. This represents a tertiary referral center for individuals with advanced pancreatic disease such as CP and PDAC. From this Repository, we selected patients having available plasma, bile, pancreatic juice, or some combination. All samples were procured immediately before or during their endoscopy.
We included all patients in the Repository with a confirmed tissue diagnosis of PDAC and no prior therapy for PDAC. To develop and validate the PDAC Signature Panel for diagnosing PDAC, we established a training cohort and a validation cohort derived from the Repository. To reduce the confounding effect of age on diagnostic accuracy of miRNAs, we designed the training cohort to include a random subgroup of the individuals with PDAC and an age-matched sample of individuals enrolled into the Repository having a confirmation of CP or other benign biliary disorders (controls) with available specimens for analysis using the frequency matching scheme. All patients with CP were undergoing ERCP for the treatment of bile or pancreatic duct pathology (i.e., strictures). All patients classified as controls were undergoing ERCP for the treatment of choledocholithiasis. The sample size targeted for the training cohort was chosen to provide >80% power to detect a difference of 0.1 in diagnostic accuracy, indicated by the area under the receiver operating characteristic (ROC) curve, for distinguishing PDAC and other patients using plasma miRNAs in comparison with carbohydrate antigen 19-9 (CA19-9). We assumed an α-level of 0.1 because of the exploratory nature of the study. The diagnostic accuracy of CA19-9 was assumed to have an area under the ROC curve (AUC) of 0.85 based on previous research (19, 20). To validate the diagnostic performance of a miRNA Panel developed from the training cohort, we then established a validation cohort comprising individuals having the same diagnoses using a separate, random sample derived from the Repository, where patients were not age matched so that the data represent a real-world cohort of individuals presenting for EUS, ERCP, or both with suspected PDAC, CP, and choledocholithiasis.
Relevant clinical data were collected at the time of the procedure, and a diagnosis of PDAC required cytopathological confirmation. All individuals with PDAC were enrolled before the initiation of therapy (treatment naive). Individuals with CP were classified by the Cambridge criteria on computed tomography, ERCP, or both (21). Control subjects had previously undergone normal cross-sectional imaging of the pancreas. Before subject enrollment, our local Institutional Review Board approved this study protocol and each subject signed informed consent.
Sample procurement
After signing consent and before the onset of endoscopy, no more than 20 ml of blood was collected and equally distributed into EDTA-coated tubes. Among subjects undergoing ERCP, 1–5 ml of bile and/or pancreatic juice was aspirated and collected in an uncoated tube. Specimens were initially stored at 4–8 °C, and then rapidly processed by centrifugation followed by collection of supernatant. After processing, all supernatants were stored at −80 °C until analysis.
Rationale for miRNA selection and assay methodology
Investigators analyzing samples (A.J.G., S.D.M., and M.K.) were blinded to the underlying diagnosis. Based on previous studies by our group and others, we assayed plasma, pancreatic juice, and bile aspirates for 10 miRNA candidates (miR-10b, -21, -30c, -106b, -132, --155, -181a, -181b, -196a, and -212) having a known or suspected association with PDAC. Each of these miRNAs are overexpressed in PDAC or have been linked mechanistically to RB dysfunction or the epidermal growth factor receptor, both of which have crucial roles in PDAC pathobiology (22, 23, 24, 25, 26, 27, 28, 29, 30, 31, 32). Compared with normal or CP patients, we previously reported elevation in miRNA-10b levels in archival plasma samples from individuals with PDAC (12). Importantly, miRNA-10b is one of the most frequently upregulated miRNAs in PDAC, and we have previously utilized biopsies from EUS-derived fine-needle aspirates to correlate decreased miRNA-10b expression in the cancer cells in PDAC with improved survival, response to neoadjuvant radiochemotherapy, and delayed time to metastasis (29). Therefore, we hypothesized that these 10 plasma miRNAs would represent a broad variety of functions in PDAC and had high potential for release into the circulation. The rationale for including bile and pancreatic juice is that many patients with PDAC and CP present with bile or pancreatic duct obstruction. This usually prompts ERCP for drainage and intraductal tissue sampling in conjunction with EUS-derived fine-needle aspirates. Tissue sampling is operator dependent and cytopathology inaccurate in the setting of CP, and hence a diagnostic test requiring aspiration of bile or pancreatic juice would be clinically useful in certain cases.
Total RNA was isolated from samples using Trizol-LS (Life Technologies, Carlsbad, CA). Complementary DNA was generated using 10 ng of RNA in conjunction with miRNA-10b, -21, -30c, -106b, -132, -155, -181a, -181b, -196a, -212, or -425-5p reverse transcription primers and a miRNA reverse transcription kit (Life Technologies) according to the manufacturer's recommendations. Quantitative PCR was performed for each miRNA using Taqman (Life Technologies, Grand Island, NY) miRNA expression assay reagents. Expression levels for all candidate miRNAs were normalized to miRNA-425-5p that was expressed at similar levels in all samples, exhibiting <1 cycle threshold (Ct) difference across the samples (31). MiRNA-16, -23a, and -93 were evaluated as endogenous controls, but these miRNAs exhibited greater intersample variability than miR-425-5p. After normalization to miR-425-5p (ΔCt), the ΔCt values for miRNAs in controls were averaged and subtracted from the ΔCt values of each individual sample (ΔΔCt) and expression levels were calculated using the 2−ΔΔCt method that indicates a twofold difference per every difference in normalized Ct values (32).
Statistical analysis
Sample characteristics, laboratory characteristics, and miRNA expression levels of patients in the PDAC, CP, and control groups were compared using analysis of variance for normally distributed continuous variables, nonparametric Kruskal–Wallis tests for nonnormally distributed continuous variables, and Pearson's χ2 tests for categorical variables. Descriptive statistics were reported using mean±s.d. for normally distributed, continuous variables and median/interquartile range for non-normally distributed continuous variables. For each variable, pairwise comparison was performed with P values adjusted using the Bonferroni approach (33).
The first step in the development of the PDAC Signature Panel involved bivariable analyses using logistic regression in the training cohort in order to determine the relationship between expression level of each miRNA and presence/absence of PDAC (PDAC vs. CP or control). Predictive performance of each miRNA was described using the ROC curve and the AUC, with excellent accuracy defined as AUC >0.90. We also evaluated the predictive performance of each miRNA in discriminating PDAC vs. CP, PDAC vs. control, and CP vs. control. In order to explore dichotomization of the expression level, miRNAs having excellent accuracy in bivariate analysis of PDAC prediction were further examined using a classification tree model.
Multivariable analyses were then performed using logistic regression in which dichotomized expression levels of all miRNAs with excellent accuracy were included in a forward stepwise selection procedure (P<0.20 for entering and staying in the model) to determine the final predictors for the PDAC Signature Panel. We chose P<0.20 in the multivariable model because of the exploratory nature of the analyses. Finally, we constructed a point scoring system in which points were assigned to miRNAs using coefficients from the final logistic regression model. We calculated points associated with each miRNA by dividing the corresponding coefficient by the lowest coefficient in the final model and rounding to the nearest integer. We then computed the Panel score for each patient by adding the points for all miRNAs in the final model. The PDAC Signature Panel scoring system was repeated using plasma alone and bile alone.
To validate the PDAC Signature Panel, we applied the point scoring system constructed in the training cohort to the validation cohort by determining the risk points for each patient in the validation cohort. Performance of these Signature Panels was evaluated using sensitivity and specificity.
As there were limited pancreatic juice samples from patients, we describe the differential expression of miRNAs using data derived from both training and validation cohorts for patients with PDAC and CP in the secondary analysis. In addition, for descriptive purposes, we measured differences in miRNA expression among PDAC individuals having metastatic (stage IV) and nonmetastatic (stage I–III) disease. Statistical analysis was performed using SAS v. 9.3 (Cary, NC) and R Project software (Vienna, Austria).
RESULTS
Study population
The study included a total of 215 individuals identified in the Biological Repository, with 95 subjects comprising the training and 120 comprising the validation cohort (Figure 1). Of individuals with PDAC, 53/77 (69%) were staged T1–T3 at the time of specimen procurement. Clinical characteristics are summarized in Table 1. There were no significant differences in age and sex in the training cohort; in the validation cohort, subjects with PDAC were significantly older. Tobacco use was less prevalent among control subjects in the training cohort, but similar between PDAC and CP individuals; there were no differences in miRNA expression based on tobacco use (Supplementary Figure S1 online). Alcohol use was less prevalent among control subjects in the validation cohort, but similar between PDAC and CP individuals in both the training and validation cohorts.
Figure 1.

Study population (n=215). CP, chronic pancreatitis; PDAC, pancreatic ductal adenocarcinoma. Seven subjects with PDAC have missing stage information in the training (n=1) and validation (n=6) cohorts.
Table 1. Patient characteristics.
| Variable | PDAC | CP | Control | P value | PDAC vs. CP | PDAC vs. control | CP vs. control |
|---|---|---|---|---|---|---|---|
| Training cohort | N=40 | N=30 | N=25 | ||||
| Age, mean (s.d.)a | 66.5 (9.8) | 64.0 (10.4) | 66.4 (10.8) | 0.567 | |||
| Female sex, n (%) | 24 (60%) | 15 (50%) | 15 (60%) | 0.658 | |||
| Tobacco use, status, n (%) | |||||||
| Never | 18 (47.4%) | 6 (21.4%) | 13 (61.9%) | 0.012 | 0.083 | 1.000 | 0.016 |
| Ever | 13 (34.2%) | 9 (32.1%) | 6 (28.6%) | ||||
| Current | 7 (18.4%) | 13 (46.4%) | 2 (9.5%) | ||||
| Alcohol use, status | |||||||
| Never | 20 (51.3%) | 15 (55.6%) | 17 (81%) | 0.084 | |||
| Ever | 13 (33.3%) | 11 (40.7%) | 3 (14.3%) | ||||
| Current | 6 (15.4%) | 1 (3.7%) | 1 (4.8%) | ||||
| Tobacco and alcohol use, n (%) | 13 (35.1%) | 12 (44.4%) | 2 (9.5%) | 0.030 | 1.000 | 0.097 | 0.025 |
| Validation cohort | |||||||
| Age, mean (s.d.) | 65.2 (11.9) | 47.7 (12.2) | 48.8 (15.8) | <0.001 | <0.001 | <0.001 | 1.000 |
| Female sex, n (%) | 18 (48.7%) | 19 (51.4%) | 31 (67.4%) | 0.170 | |||
| Tobacco use, status, n (%) | |||||||
| Never | 13 (35.1%) | 8 (21.6%) | 15 (33.3%) | 0.274 | |||
| Ever | 13 (35.1%) | 9 (24.3%) | 14 (31.1%) | ||||
| Current | 11 (29.8%) | 20 (54.1%) | 16 (35.6%) | ||||
| Alcohol use, status | |||||||
| Never | 22 (61.1%) | 15 (40.5%) | 33 (73.3%) | 0.030 | 0.455 | 1.000 | 0.018 |
| Ever | 9 (25%) | 17 (46%) | 7 (15.6%) | ||||
| Current | 5 (13.9%) | 5 (13.5%) | 5 (11.1%) | ||||
| Tobacco and alcohol use, n (%) | 11 (30.6%) | 21 (56.8%) | 10 (22.2%) | 0.004 | 0.072 | 1.000 | 0.004 |
CP, chronic pancreatitis; PDAC, pancreatic ductal adenocarcinoma. We compare continuous variables that are normally distributed using analysis of variance (ANOVA) (age), likelihood ratio χ2 test for categorical variables having low expected cell counts, and other variables using Pearson's χ 2 test. Pairwise comparisons were performed using the Bonferroni multiple comparison approach.
To minimize the potential of age being a confounder in microRNA (miRNA) expression between groups, subjects were age matched in the training cohort.
Laboratory characteristics at the time of specimen procurement are summarized in Table 2. We did not perform comparative statistics for CA19-9 because values were only available for individuals with PDAC. Compared with individuals with CP and controls, median serum bilirubin and the proportion of cases having at least mild elevation in serum bilirubin (defined as >2 mg/dl) were significantly greater in PDAC cases. However, the inclusion of serum bilirubin as a potential confounding variable did not affect miRNA expression (Supplementary Figure S2) or the performance of our diagnostic panels detailed below. Observed differences in serum albumin and total protein were not clinically relevant (differences <1.0 for each measure), and white blood count and calcium levels were similar across groups.
Table 2. Laboratory characteristics.
| Variable | PDAC | CP | Normal | P value | PDAC vs. CP | PDAC vs. normal | CP vs. normal |
|---|---|---|---|---|---|---|---|
| Study cohort | N=40 | N=30 | N=25 | ||||
| CA19-9, U/ml median (IQR) | 385 (1,689) | ||||||
| Total bilirubin, mg/dl median (IQR) | 5.3 (11.2) | 0.6 (0.2) | 0.7 (1.1) | <0.001 | <0.001 | 0.001 | 1.000 |
| At least mild elevation (bilirubin >2.0 mg/dl), n (%) | 20 (55.6%) | 1 (3.5%) | 4 (20%) | <0.001 | <0.001 | 0.024 | 0.176 |
| WBC, cells × 103/μl (median, IQR) | 7.5 (3.1) | 7.8 (2.6) | 5.9 (2.5) | 0.107 | |||
| Albumin, g/dl mean (s.d.) | 3.7 (0.5) | 3.9 (0.6) | 3.9 (0.4) | 0.137 | |||
| Total protein, g/dl mean (s.d.) | 6.8 (0.8) | 7.2 (0.6) | 6.9 (0.5) | 0.078 | |||
| Calcium, mg/dl mean (s.d.) | 9.3 (0.6) | 9.4 (0.5) | 9.3 (0.8) | 0.674 | |||
| Validation cohort | N=37 | N=37 | N=46 | ||||
| CA19-9, U/ml median (IQR) | 742.5 (1,477) | ||||||
| Total bilirubin, mg/dl median (IQR) | 11.6 (13) | 0.4 (0.3) | 0.9 (1.2) | <0.001 | <0.001 | <0.001 | <0.001 |
| At least mild elevation (bilirubin >2.0 mg/dl), n (%) | 26 (78.8%) | 2 (5.4%) | 9 (20.5%) | <0.001 | <0.001 | <0.001 | 0.120 |
| WBC, cells × 103/μl (median, IQR) | 8 (4.6) | 7.6 (1.6) | 7.7 (3) | 0.859 | |||
| Albumin, g/dl mean (s.d.) | 3.5 (0.8) | 3.9 (0.5) | 3.9 (0.5) | 0.005 | 0.039 | 0.005 | 1.000 |
| Total protein, g/dl mean (s.d.) | 6.5 (0.9) | 6.9 (0.5) | 7.2 (0.8) | 0.001 | 0.074 | <0.001 | 0.285 |
| Calcium, mg/dl mean (s.d.) | 9.1 (0.5) | 9.3 (0.5) | 9.4 (0.6) | 0.070 |
CA19-9, carbohydrate antigen 19-9; CP, chronic pancreatitis; IQR, interquartile range; PDAC, pancreatic ductal adenocarcinoma; WBC, white blood count. Continuous variables that are normally distributed are compared using analysis of variance (ANOVA; albumin, total protein, calcium) and others are compared using the nonparametric Kruskal–Wallis test (total bilirubin and WBC). Likelihood ratio χ 2 test was used for the categorical variable mild bilirubin elevation because of low cell counts. Pairwise comparisons were performed using the Bonferroni multiple comparison approach.
MiRNA expression
We evaluated 10 miRNAs in plasma and bile in the training cohort: plasma was available for analysis in all but 1 control and bile in all but 15 PDAC, 7 CP, and 3 controls (Figure 2 and Supplementary Table S1). Of the plasma miRNAs, only miRNA-21 was similar across groups (P=0.426). MiRNA-10b, -30c, -106b, -155, -181b, -196a, and -212 were significantly different across all three groups with a P value of <0.001 and between individuals with PDAC and CP (P<0.001). MiRNA-132 and -181a were also significantly different across all three groups (P=0.001 and 0.007, respectively), with statistically significant differences persisting in pairwise comparison of PDAC and CP for only miRNA-181a (P=0.016). In bile, all miRNAs were significantly different across groups except for miRNA-21 (P=0.151), miRNA-132 (P=0.535), and miRNA-181b (P=0.297). Differences in miRNA expression in bile persisted in pairwise comparisons of PDAC vs. CP except for miRNA-181a (P=0.115) and miRNA-196a (P=0.198); in pairwise comparisons of PDAC vs. control, differences in bile miRNA expression persisted. The accuracy of each miRNA in distinguishing PDAC from CP and controls is illustrated by ROC curves (Figure 3).
Figure 2.

The microRNA (miRNA) expression in plasma and bile samples from the training cohort (n=95). The y axis indicates relative expression of miRNA. Box plot for each of the 10 miRNAs measured in plasma and bile from the training cohort. CP, chronic pancreatitis; IQR, interquartile range; PDAC, pancreatic ductal adenocarcinoma.
Figure 3.

Accuracy of plasma (a) and bile (b) miRNAs in diagnosing pancreatic cancer. Receiver operating characteristic curves illustrate the performance of each plasma and bile miRNA in distinguishing individuals with pancreatic cancer from those with chronic pancreatitis and benign biliary disorders.
Compared with PDAC individuals with stage I–III disease (n=53), those having stage IV disease at the time of specimen procurement (n=17, with 7 individuals lacking stage data) had similar plasma miRNA profiles for each of the 10 miRNAs measured. Although not meeting statistical significance, median (interquartile range) expression of miRNA-132 (n=24) was higher among subjects with stage IV disease (2.01 (1.44) vs. 0.57 (1.58), P=0.0926); miRNA-155 and -181b expression in bile (n=24) was lower among subjects with stage IV disease (miRNA-155: 14.59 (18.29) vs. 24.7 (20.9), P=0.0792; miRNA-181b: 0.62 (0.84) vs. 1.22 (0.82), P=0.0448). All other bile miRNAs were expressed similarly between those with stage IV and I–III disease.
PDAC Signature Panel
Bivariable logistic regression analyses showed that 5 miRNAs (miRNA-10b, -30c, -106b, -155, and -212) in plasma and bile provided excellent accuracy (AUC >0.90) for distinguishing PDAC patients from others (CP+control) based on the training cohort (Supplementary Table S2). These miRNAs also provided excellent accuracy for distinguishing PDAC from controls. In addition, each miRNA had good (plasma miRNA-212, defined as AUC >0.80) or excellent (all other plasma miRNAs and all five bile miRNAs) accuracy in distinguishing PDAC from CP subjects. Therefore, we selected these miRNAs to build a PDAC Signature Panel. Based on classification tree analyses, the thresholds for dichotomizing the expression levels were 3.579, 4.873, 2.920, 10.680, and 2.013 for plasma miRNA-10b, -30c, -106b, -155, and -212, respectively. For the same five miRNAs derived from bile, thresholds were 3.497, 3.933, 5.261, 5.232, and 4.163, respectively. Considering these thresholds, the sensitivity and specificity of these miRNAs derived from plasma and bile are computed and summarized in Table 3.
Table 3. Performance characteristics of plasma and bile miRNAs for diagnosing PDAC in the training cohort (n=95).
| Candidate miRNA | True positives (n) | True negatives (n) | False positives (n) | False negatives (n) | Sensitivity | Specificity | LR+ | LR− |
|---|---|---|---|---|---|---|---|---|
| Plasma | ||||||||
| miR-10b | 38 | 54 | 0 | 2 | 95% | 100% | 103.6 | 0.06 |
| miR-30c | 29 | 52 | 2 | 11 | 73% | 96% | 15.9 | 0.29 |
| miR-106b | 40 | 53 | 1 | 0 | 100% | 98% | 36.3 | 0.09 |
| miR-155 | 37 | 54 | 0 | 3 | 93% | 100% | 100.9 | 0.09 |
| miR-212 | 36 | 45 | 9 | 4 | 90% | 83% | 5.2 | 0.13 |
| Bile | ||||||||
| miR-10b | 24 | 45 | 0 | 1 | 96% | 100% | 87.4 | 0.06 |
| miR-30c | 24 | 44 | 1 | 1 | 96% | 98% | 29.1 | 0.04 |
| miR-106b | 24 | 45 | 0 | 1 | 96% | 100% | 87.4 | 0.06 |
| miR-155 | 24 | 45 | 0 | 1 | 96% | 100% | 87.4 | 0.06 |
| miR-212 | 24 | 45 | 0 | 1 | 96% | 100% | 87.4 | 0.06 |
LR−, negative likelihood ratio; LR+, positive likelihood ratio; miRNA, microRNA; PDAC, pancreatic ductal adenocarcinoma.
Assays of plasma and bile for miRNA-10b, -155, -106b, -30c, and -212 using samples derived from the validation cohort were performed similar to the training cohort (Figure 4). Using the dichotomized differential miRNA expression level in the training cohort, we constructed PDAC Signature Panels using plasma miRNAs alone and bile miRNAs alone (Table 4). Using plasma miRNAs alone, forward stepwise selection procedure selected miRNA-10b and -106b, with the other three miRNAs dropping from the model for P value >0.20 because of high correlation between each of the miRNA. Based on coefficients derived from the final logistic regression model including plasma miRNA-10b (parameter estimate±s.e. 3.83±1.87, P=0.0405) and miRNA-106b (5.18±1.87, P=0.0055), we assigned 1 point for high miRNA-10b (>3.579) and 1 point for high miRNA-106b (>2.920). Using a plasma Panel score of ≥2 to diagnose PDAC, we have 38/40=95% sensitivity (95% confidence interval (CI), 83–99%), 54/54=100% specificity (95% CI, 93–100%), positive likelihood ratio 103.6 (95% CI, 6.6–1,637), and negative likelihood ratio 0.06 (95% CI, 0.02–0.21) in the training cohort and 29/29=100% sensitivity (95% CI, 88–100%), 75/75=100% specificity (95% CI, 95–100%), positive likelihood ratio 151 (95% CI, 9.5–2,392), and negative likelihood ratio 0.02 (95% CI, 0.001–0.26) in the validation cohort.
Figure 4.

The microRNA (miRNA) expression in plasma and bile from the validation cohort (n=120). The y axis indicates relative expression of miRNA. Box plot for each of the five miRNAs measured in plasma and bile from the validation cohort. CP, chronic pancreatitis; IQR, interquartile range; PDAC, pancreatic ductal adenocarcinoma.
Table 4. Performance characteristics of PDAC Signature Panels derived from plasma or bile.
|
Plasma alone |
Bile alone |
|||||||||||
|---|---|---|---|---|---|---|---|---|---|---|---|---|
|
PDAC Signature Panel score |
Training cohort |
Validation cohort |
Training cohort |
Validation cohort |
||||||||
| Not PDAC | PDAC | Total | Not PDAC | PDAC | Total | Not PDAC | PDAC | Total | Not PDAC | PDAC | Total | |
| 0 | 53 | 0 | 53 | 73 | 0 | 73 | 45 | 1 (FP) | 46 | 61 | 0 | 61 |
| 1 | 1 | 2 (FN) | 3 | 2 | 0 | 2 | 0 | 24 | 9 | 0 | 28 | 28 |
| 2 | 0 | 38 | 38 | 0 | 29 | 29 | ||||||
| Total | 54 | 40 | 94 | 75 | 29 | 104 | 45 | 25 | 70 | 61 | 28 | 89 |
FN, false negative; FP, false positive; PDAC, pancreatic ductal adenocarcinoma. Shaded boxes depict values equal to or above the threshold PDAC Signature Panel scores derived from regression models using plasma miR alone (≥2) and bile miR alone (≥1).
We constructed a similar model using bile miRNA alone. The forward stepwise selection procedure confirmed that the dichotomized expression level of each of the five miRNAs performed identically in distinguishing PDAC from other etiologies. The addition of two or more bile miRNAs did not improve the performance of the Panel. Therefore, we assigned one point to a patient if any of the following miRNAs exceeded their threshold score: miRNA-10b (>3.497), -106b (5.261), -155 (5.232), and -212 (>4.163). Using a threshold bile Panel score ≥1, we have 24/25=96% sensitivity (95% CI, 80–100%), 45/45=100% specificity (95% CI, 92–100%), positive likelihood ratio 87.4 (95% CI, 5.5–1,378.2), and negative likelihood ratio 0.06 (95% CI, 0.01–0.28) in the training cohort and 28/28=100% sensitivity (95% CI, 88–100%), 61/61=100% specificity (95% CI, 94–100%), positive likelihood ratio 123 (95% CI, 7.8–1,944.4), and negative likelihood ratio 0.02 (95% CI, 0.001–0.27) in the validation cohort (Table 4).
The inclusion of serum bilirubin in regression models (i.e., controlling for differences in serum bilirubin) did not affect the performance characteristics of our PDAC Panels using plasma (P=0.73 for serum bilirubin) or bile miRNA (P=0.92 for serum bilirubin).
Pancreatic juice
As pancreatic juice was available in a limited number of individuals with PDAC (n=9) and CP (n=34) in the entire cohort, we also present the differential expression of miRNA-10b, -155, -106b, -30c, and -212 between these groups. On univariate analysis, the AUC=1.0 (100% accuracy in distinguishing PDAC from CP) for all miRNAs in the Signature Panel except miRNA-30c (AUC=0.941). Thresholds based on the classification tree were 4.42 for miRNA-155, 4.54 for miRNA-106b, 3.41 for miRNA-10b, 3.69 for miRNA-212, and 3.27 for miRNA-30c. Similar to models for plasma alone and bile alone, a PDAC Panel score ≥1 correctly diagnosed all individuals with PDAC from those with CP.
DISCUSSION
In their lifetime, PDAC will develop in 1 of 68 Americans, and only 6% of affected individuals will survive for 5 years (34). Clinical trials touting the incremental benefit of chemotherapeutic agents such as gemcitabine, combination of oxaliplatin/leucovorin/irinotecan/fluorouracil (FOLFIRINOX) (35), and albumin-bound paclitaxel (36) report survival benefits that are quantified in months. Given these dismal statistics, there is substantial interest in developing novel tests to identify PDAC at an earlier stage or even in precursor lesions such as pancreatic intraepithelial neoplasia or early-stage intraductal papillary mucinous neoplasm (37, 38, 39). The need for superior diagnostics applies to patients with or without CP who present with indeterminate bile or pancreatic duct strictures, where ERCP-based tissue sampling techniques have limited sensitivity and where bile or pancreatic juice aspirates may apply. In addition, a peripheral biomarker for PDAC could be utilized as a first-line test for patients presenting with obstructive jaundice and suspected PDAC in community hospitals where EUS and ERCP-based tissue sampling is unavailable. The miRNAs, which are short noncoding RNA, represent an attractive class of diagnostic and prognostic biomarkers for clinical application as they remain stable in tissue and bodily fluids and influence the pathobiology of cancer cells by altering the expression of various proteins such as epidermal growth factor receptor. Case–control studies evaluating different miRNA profiles in whole blood (19, 40) or plasma/serum (12, 27, 41, 42) have yielded varying results. Given the high accuracy of individual miRNA and the PDAC Signature Panel derived from our cohort, plasma appears to be a superior medium than serum (41) or whole blood (19, 43) for this indication.
In the present analysis, the performance of our panels that incorporated the differential expression of miRNAs, each having excellent accuracy in distinguishing PDAC from controls and CP, is superior to historical populations using CA19-9 (44). Therefore, the current miRNA profile may be important clinically given that CP patients are at risk of developing PDAC, and that CA19-9 levels cannot differentiate between PDAC and CP. A limitation of CA19-9 is its diminished specificity in the setting of obstructive jaundice; the miRNAs studied were unaffected by the presence of jaundice (Supplementary Figure S2), and inclusion of serum bilirubin in our models did not significantly affect the diagnostic accuracy of our panels. Our reference populations (CP patients having pancreatobiliary duct pathology and controls having choledocholithiasis) reflect a “real-world” cohort of individuals with a variety of pancreatobiliary diseases, some of which (e.g., CP) may mimic PDAC and in whom a peripheral biomarker would be most useful. We deliberately chose a control population with choledocholithiasis as opposed to a purely healthy control population in an effort to minimize selection bias. For cancer screening, a PDAC Signature Panel would unlikely apply to the general population but rather high-risk populations such as those with a family history and CP.
MiRNA stability in plasma, bile, and pancreatic juice
Plasma miRNAs are stable over a wide pH range and do not degrade when plasma is subjected to multiple freeze/thaw cycles or to boiling (45, 46). Therefore, it is not surprising that we generated reproducible results of miRNA expression in plasma, bile, and pancreatic juice. Importantly, in clinical practice, patients with bile and pancreatic duct strictures are a diagnostic conundrum. ERCP- and EUS-based tissue sampling techniques have reduced sensitivity for distinguishing PDAC from CP and other benign etiologies of stricture, and hence aspiration of bile, pancreatic juice, or both is an attractive alternative to cholangiopancreatoscopy and fluorescence in situ hybridization—current “second-tier” diagnostic tests used in clinical practice (47). In addition, tissue sampling from the pancreas or bile duct is operator dependent, whereas aspiration of bile or pancreatic juice for miRNA analysis could be performed by all ERCP providers. ERCP is often indicated in the setting of suspected PDAC for the palliation of obstructive jaundice or an indeterminate pancreatic duct stricture, and hence aspiration of bile or pancreatic juice may enhance the diagnostic performance of this intervention.
Analysis of miRNA expression from surgical explants indicates that a miRNA panel may even be able to distinguish cholangiocarcinoma from PDAC, and this will be increasingly important as systemic therapies are personalized for these cancer subtypes (48). Impressively, the performance of plasma alone had excellent accuracy for distinguishing PDAC from CP and controls. Nonetheless, future studies should explore the potential complementary roles of plasma+bile miRNAs as biomarkers for differentiating pancreatic cancer from cholangiocarcinoma or metastatic lesions to the pancreas.
Peripheral miRNA as prognostic markers
MiRNA-10b, miR-21, and miR-155 are important in PDAC biology (12, 13, 15, 17, 29). However, miR-21 did not serve as a good plasma, bile, or pancreatic juice biomarker in this study. This observation underscores the fact that the mechanisms regulating miRNA release into the circulation are complex, cannot be generalized to all miRNAs, and have not been clearly delineated. Moreover, we previously demonstrated that miRNA-10b and miRNA-21 are abundant in PDAC cells and are also present in cancer-associated fibroblasts; on the other hand, miRNA-155 localizes to CD45+ T cells within the pancreatic tumor microenvironment and is not present in cancer cells (29, 49). Therefore, the cell type in which a particular miRNA is expressed in PDAC does not necessarily dictate its usefulness as a peripheral biomarker.
We also did not observe significant differences in the expression of miRNAs among PDAC individuals with stage I–III vs. stage IV disease. However, our cross-sectional study did not include serial collection of plasma to track miRNA expression following surgical resection or systemic therapy, and PDAC patient follow-up was relatively short. Therefore, we cannot extrapolate whether certain miRNAs differentially expressed in plasma, bile, or pancreatic juice will correlate with response to specific therapies or survival. Nonetheless, the present findings indicate that a plasma miRNA signature may serve as a noninvasive diagnostic test for PDAC, and that obtaining bile or pancreatic juice for miRNA during ERCP for the evaluation and treatment of pancreatobiliary strictures may be equally accurate. In addition, the current miRNA signature could complement recently described protein biomarkers (50) without being influenced by jaundice or age. We deliberately chose age-matched individuals with CP and controls in the training cohort to eliminate the potential for it to influence the results. Consistent with previous studies, we did not observe significant differences in plasma miRNA expression among control subjects with increasing age (Supplementary Figure S3) (51, 52). The validation cohort represented a real-world cohort of individuals presenting for EUS, ERCP, or both with suspected PDAC, CP, and choledocholithiasis (controls); plasma and bile panels applied to this validation group had excellent sensitivity and specificity for diagnosing PDAC.
A limitation of our study is that we could not directly compare the performance of our PDAC Signature Panel to CA19-9—the only currently available peripheral biomarker for PDAC—as CA19-9 was unavailable for the majority of CP and control individuals. However, the miRNA Signature Panels developed in this study provided superior diagnostic accuracy than CA19-9 based on historical populations. Additional cohort studies are needed to confirm whether our miRNA panels (plasma and bile) are superior to CA19-9 for diagnosing PDAC; ideally, these would be coupled with long-term follow-up to determine the prognostic value of selected miRNAs.
In summary, a PDAC Signature Panel developed from the differential expression of miRNA in plasma, bile, or pancreatic juice represents a promising and novel diagnostic test for PDAC. This Panel accurately distinguishes individuals with PDAC from those with CP, an at-risk population who may be considered for screening, and has substantial potential to improve the diagnostic accuracy of ERCP for indeterminate bile duct strictures. Future studies are needed to validate the diagnostic accuracy of this Panel in larger cohorts, as well as to assess their usefulness as markers that correlate with survival and response to therapy for individuals with PDAC.
Study Highlights
Acknowledgments
We thank Glen Lehman, James Watkins, Lee McHenry, John DeWitt, Mohammad Al-Haddad, Julia Leblanc, and Evan Fogel for contributing patients to this study.
Guarantor of the article: Murray Korc, MD.
Specific author contributions: Study concept and design (Coté, Gore, and Korc); acquisition of data (Coté, Gore, McElyea, and Heathers); analysis and interpretation of data (Coté, Gore, Xu, and Korc); drafting of the manuscript (Coté, Gore, and Korc); critical revision of the manuscript for important intellectual content (McElyea, Xu, Sherman, and Korc); statistical analysis (Xu).
Financial support: This work was supported, in part, by NIH grant R37-CA-075059 from the NCI to M. Korc and by NIH grant 5K23DK095148 (Coté) from the NIDDK.
Potential competing interests: None.
Footnotes
SUPPLEMENTARY MATERIAL is linked to the online version of the paper at http://www.nature.com/ajg
Supplementary Material
References
- Esquela-Kerscher A, Slack FJ. Oncomirs - microRNAs with a role in cancer. Nat Rev Cancer. 2006;6:259–269. doi: 10.1038/nrc1840. [DOI] [PubMed] [Google Scholar]
- Iorio MV, Croce CM. MicroRNAs in cancer: small molecules with a huge impact. J Clin Oncol. 2009;27:5848–5856. doi: 10.1200/JCO.2009.24.0317. [DOI] [PMC free article] [PubMed] [Google Scholar]
- Valencia-Sanchez MA, Liu J, Hannon GJ, et al. Control of translation and mRNA degradation by miRNAs and siRNAs. Genes Dev. 2006;20:515–524. doi: 10.1101/gad.1399806. [DOI] [PubMed] [Google Scholar]
- Iorio MV, Croce CM. MicroRNA dysregulation in cancer: diagnostics, monitoring and therapeutics. A comprehensive review. EMBO Mol Med. 2012;4:143–159. doi: 10.1002/emmm.201100209. [DOI] [PMC free article] [PubMed] [Google Scholar]
- Stahlhut C, Slack FJ. MicroRNAs and the cancer phenotype: profiling, signatures and clinical implications. Genome Med. 2013;5:111. doi: 10.1186/gm516. [DOI] [PMC free article] [PubMed] [Google Scholar]
- Croce CM. Causes and consequences of microRNA dysregulation in cancer. Nat Rev Genet. 2009;10:704–714. doi: 10.1038/nrg2634. [DOI] [PMC free article] [PubMed] [Google Scholar]
- Hoffman AE, Liu R, Fu A, et al. Targetome profiling, pathway analysis and genetic association study implicate miR-202 in lymphomagenesis. Cancer Epidemiol Biomarkers Prev. 2013;22:327–336. doi: 10.1158/1055-9965.EPI-12-1131-T. [DOI] [PMC free article] [PubMed] [Google Scholar]
- Pizzini S, Bisognin A, Mandruzzato S, et al. Impact of microRNAs on regulatory networks and pathways in human colorectal carcinogenesis and development of metastasis. BMC Genomics. 2013;14:589. doi: 10.1186/1471-2164-14-589. [DOI] [PMC free article] [PubMed] [Google Scholar]
- Xia H, Hui KM. MicroRNAs involved in regulating epithelial-mesenchymal transition and cancer stem cells as molecular targets for cancer therapeutics. Cancer Gene Ther. 2012;19:723–730. doi: 10.1038/cgt.2012.58. [DOI] [PubMed] [Google Scholar]
- Frampton AE, Castellano L, Colombo T, et al. MicroRNAs cooperatively inhibit a network of tumor suppressor genes to promote pancreatic tumor growth and progression Gastroenterology 2014146268–277.e18. [DOI] [PubMed] [Google Scholar]
- Mohr AM, Bailey JM, Lewallen ME, et al. MUC1 regulates expression of multiple microRNAs involved in pancreatic tumor progression, including the miR-200c/141 cluster. PLoS One. 2013;8:e73306. doi: 10.1371/journal.pone.0073306. [DOI] [PMC free article] [PubMed] [Google Scholar]
- Ouyang H, Gore J, Deitz S, et al. microRNA-10b enhances pancreatic cancer cell invasion by suppressing TIP30 expression and promoting EGF and TGF-beta actions. Oncogene. 2013;33:4664–4674. doi: 10.1038/onc.2013.405. [DOI] [PMC free article] [PubMed] [Google Scholar]
- Szafranska AE, Davison TS, John J, et al. MicroRNA expression alterations are linked to tumorigenesis and non-neoplastic processes in pancreatic ductal adenocarcinoma. Oncogene. 2007;26:4442–4452. doi: 10.1038/sj.onc.1210228. [DOI] [PubMed] [Google Scholar]
- Xu L, Li Q, Xu D, et al. hsa-miR-141 downregulates TM4SF1 to inhibit pancreatic cancer cell invasion and migration. Int J Oncol. 2014;44:459–466. doi: 10.3892/ijo.2013.2189. [DOI] [PubMed] [Google Scholar]
- Greither T, Grochola LF, Udelnow A, et al. Elevated expression of microRNAs 155, 203, 210 and 222 in pancreatic tumors is associated with poorer survival. Int J Cancer. 2010;126:73–80. doi: 10.1002/ijc.24687. [DOI] [PubMed] [Google Scholar]
- Khan S, Ansarullah, Kumar D, et al. Targeting microRNAs in pancreatic cancer: microplayers in the big game. Cancer Res. 2013;73:6541–6547. doi: 10.1158/0008-5472.CAN-13-1288. [DOI] [PMC free article] [PubMed] [Google Scholar]
- Bloomston M, Frankel WL, Petrocca F, et al. MicroRNA expression patterns to differentiate pancreatic adenocarcinoma from normal pancreas and chronic pancreatitis. JAMA. 2007;297:1901–1908. doi: 10.1001/jama.297.17.1901. [DOI] [PubMed] [Google Scholar]
- Ma MZ, Kong X, Weng MZ, et al. Candidate microRNA biomarkers of pancreatic ductal adenocarcinoma: meta-analysis, experimental validation and clinical significance. J Exp Clin Cancer Res. 2013;32:71. doi: 10.1186/1756-9966-32-71. [DOI] [PMC free article] [PubMed] [Google Scholar]
- Schultz NA, Dehlendorff C, Jensen BV, et al. MicroRNA biomarkers in whole blood for detection of pancreatic cancer. JAMA. 2014;311:392–404. doi: 10.1001/jama.2013.284664. [DOI] [PubMed] [Google Scholar]
- Makawita S, Dimitromanolakis A, Soosaipillai A, et al. Validation of four candidate pancreatic cancer serological biomarkers that improve the performance of CA19.9. BMC Cancer. 2013;13:404. doi: 10.1186/1471-2407-13-404. [DOI] [PMC free article] [PubMed] [Google Scholar]
- Sarner M, Cotton PB. Classification of pancreatitis. Gut. 1984;25:756–759. doi: 10.1136/gut.25.7.756. [DOI] [PMC free article] [PubMed] [Google Scholar]
- Sicard F, Gayral M, Lulka H, et al. Targeting miR-21 for the therapy of pancreatic cancer. Mol Ther. 2013;21:986–994. doi: 10.1038/mt.2013.35. [DOI] [PMC free article] [PubMed] [Google Scholar]
- Park JK, Henry JC, Jiang J, et al. miR-132 and miR-212 are increased in pancreatic cancer and target the retinoblastoma tumor suppressor. Biochem Biophys Res Commun. 2011;406:518–523. doi: 10.1016/j.bbrc.2011.02.065. [DOI] [PMC free article] [PubMed] [Google Scholar]
- Gore AJ, Deitz SL, Palam LR, et al. Pancreatic cancer-associated retinoblastoma 1 dysfunction enables TGF-beta to promote proliferation. J Clin Invest. 2014;124:338–352. doi: 10.1172/JCI71526. [DOI] [PMC free article] [PubMed] [Google Scholar]
- Garofalo M, Romano G, Di Leva G, et al. EGFR and MET receptor tyrosine kinase-altered microRNA expression induces tumorigenesis and gefitinib resistance in lung cancers. Nat Med. 2012;18:74–82. doi: 10.1038/nm.2577. [DOI] [PMC free article] [PubMed] [Google Scholar] [Retracted]
- Preis M, Korc M. Signaling pathways in pancreatic cancer. Crit Rev Eukaryot Gene Expr. 2011;21:115–129. doi: 10.1615/critreveukargeneexpr.v21.i2.20. [DOI] [PubMed] [Google Scholar]
- Liu J, Gao J, Du Y, et al. Combination of plasma microRNAs with serum CA19-9 for early detection of pancreatic cancer. Int J Cancer. 2012;131:683–691. doi: 10.1002/ijc.26422. [DOI] [PubMed] [Google Scholar]
- Takiuchi D, Eguchi H, Nagano H, et al. Involvement of microRNA-181b in the gemcitabine resistance of pancreatic cancer cells. Pancreatology. 2013;13:517–523. doi: 10.1016/j.pan.2013.06.007. [DOI] [PubMed] [Google Scholar]
- Preis M, Gardner TB, Gordon SR, et al. MicroRNA-10b expression correlates with response to neoadjuvant therapy and survival in pancreatic ductal adenocarcinoma. Clin Cancer Res. 2011;17:5812–5821. doi: 10.1158/1078-0432.CCR-11-0695. [DOI] [PMC free article] [PubMed] [Google Scholar]
- Szafranska AE, Doleshal M, Edmunds HS, et al. Analysis of microRNAs in pancreatic fine-needle aspirates can classify benign and malignant tissues. Clin Chem. 2008;54:1716–1724. doi: 10.1373/clinchem.2008.109603. [DOI] [PMC free article] [PubMed] [Google Scholar]
- Chang KH, Mestdagh P, Vandesompele J, et al. MicroRNA expression profiling to identify and validate reference genes for relative quantification in colorectal cancer. BMC Cancer. 2010;10:173. doi: 10.1186/1471-2407-10-173. [DOI] [PMC free article] [PubMed] [Google Scholar]
- Livak KJ, Schmittgen TD. Analysis of relative gene expression data using real-time quantitative PCR and the 2(-Delta Delta C(T)) method. Methods. 2001;25:402–408. doi: 10.1006/meth.2001.1262. [DOI] [PubMed] [Google Scholar]
- Dunn OJ. Multiple comparisons among means. J Am Stat Assoc. 1961;56:52–64. [Google Scholar]
- Siegel R, Naishadham D, Jemal A. Cancer statistics, 2013. CA Cancer J Clin. 2013;63:11–30. doi: 10.3322/caac.21166. [DOI] [PubMed] [Google Scholar]
- Conroy T, Desseigne F, Ychou M, et al. FOLFIRINOX versus gemcitabine for metastatic pancreatic cancer. N Engl J Med. 2011;364:1817–1825. doi: 10.1056/NEJMoa1011923. [DOI] [PubMed] [Google Scholar]
- Von Hoff DD, Ervin T, Arena FP, et al. Increased survival in pancreatic cancer with nab-paclitaxel plus gemcitabine. N Engl J Med. 2013;369:1691–1703. doi: 10.1056/NEJMoa1304369. [DOI] [PMC free article] [PubMed] [Google Scholar]
- Lee LS, Szafranska-Schwarzbach AE, Wylie D, et al. Investigating MicroRNA Expression Profiles in Pancreatic Cystic Neoplasms. Clin Transl Gastroenterol. 2014;5:e47. doi: 10.1038/ctg.2013.18. [DOI] [PMC free article] [PubMed] [Google Scholar]
- Matthaei H, Wylie D, Lloyd MB, et al. miRNA biomarkers in cyst fluid augment the diagnosis and management of pancreatic cysts. Clin Cancer Res. 2012;18:4713–4724. doi: 10.1158/1078-0432.CCR-12-0035. [DOI] [PMC free article] [PubMed] [Google Scholar]
- Yu J, Li A, Hong SM, et al. MicroRNA alterations of pancreatic intraepithelial neoplasias. Clin Cancer Res. 2012;18:981–992. doi: 10.1158/1078-0432.CCR-11-2347. [DOI] [PMC free article] [PubMed] [Google Scholar]
- Bauer AS, Keller A, Costello E, et al. Diagnosis of pancreatic ductal adenocarcinoma and chronic pancreatitis by measurement of microRNA abundance in blood and tissue. PLoS One. 2012;7:e34151. doi: 10.1371/journal.pone.0034151. [DOI] [PMC free article] [PubMed] [Google Scholar]
- Liu R, Chen X, Du Y, et al. Serum microRNA expression profile as a biomarker in the diagnosis and prognosis of pancreatic cancer. Clin Chem. 2012;58:610–618. doi: 10.1373/clinchem.2011.172767. [DOI] [PubMed] [Google Scholar]
- Wang J, Chen J, Chang P, et al. MicroRNAs in plasma of pancreatic ductal adenocarcinoma patients as novel blood-based biomarkers of disease. Cancer Prev Res (Phila) 2009;2:807–813. doi: 10.1158/1940-6207.CAPR-09-0094. [DOI] [PMC free article] [PubMed] [Google Scholar]
- Buchsbaum DJ, Croce CM. Will detection of microRNA biomarkers in blood improve the diagnosis and survival of patients with pancreatic cancer. JAMA. 2014;311:363–365. doi: 10.1001/jama.2013.284665. [DOI] [PMC free article] [PubMed] [Google Scholar]
- Locker GY, Hamilton S, Harris J, et al. ASCO 2006 update of recommendations for the use of tumor markers in gastrointestinal cancer. J Clin Oncol. 2006;24:5313–5327. doi: 10.1200/JCO.2006.08.2644. [DOI] [PubMed] [Google Scholar]
- Chen X, Ba Y, Ma L, et al. Characterization of microRNAs in serum: a novel class of biomarkers for diagnosis of cancer and other diseases. Cell Res. 2008;18:997–1006. doi: 10.1038/cr.2008.282. [DOI] [PubMed] [Google Scholar]
- Lawrie CH, Gal S, Dunlop HM, et al. Detection of elevated levels of tumour-associated microRNAs in serum of patients with diffuse large B-cell lymphoma. Br J Haematol. 2008;141:672–675. doi: 10.1111/j.1365-2141.2008.07077.x. [DOI] [PubMed] [Google Scholar]
- Cote GA, Sherman S. Biliary stricture and negative cytology: what next. Clin Gastroenterol Hepatol. 2011;9:739–743. doi: 10.1016/j.cgh.2011.04.011. [DOI] [PubMed] [Google Scholar]
- Collins AL, Wojcik S, Liu J, et al. A differential microRNA profile distinguishes cholangiocarcinoma from pancreatic adenocarcinoma. Ann Surg Oncol. 2013;21:133–138. doi: 10.1245/s10434-013-3240-y. [DOI] [PMC free article] [PubMed] [Google Scholar]
- Sempere LF, Preis M, Yezefski T, et al. Fluorescence-based codetection with protein markers reveals distinct cellular compartments for altered MicroRNA expression in solid tumors. Clin Cancer Res. 2010;16:4246–4255. doi: 10.1158/1078-0432.CCR-10-1152. [DOI] [PMC free article] [PubMed] [Google Scholar]
- Nie S, Lo A, Wu J, et al. Glycoprotein biomarker panel for pancreatic cancer discovered by quantitative proteomics analysis. J Proteome Res. 2014;13:1873–1884. doi: 10.1021/pr400967x. [DOI] [PMC free article] [PubMed] [Google Scholar]
- Creemers EE, Tijsen AJ, Pinto YM. Circulating microRNAs: novel biomarkers and extracellular communicators in cardiovascular disease. Circ Res. 2012;110:483–495. doi: 10.1161/CIRCRESAHA.111.247452. [DOI] [PubMed] [Google Scholar]
- Noren Hooten N, Fitzpatrick M, Wood WH, 3rd, et al. Age-related changes in microRNA levels in serum. Aging (Albany, NY) 2013;5:725–740. doi: 10.18632/aging.100603. [DOI] [PMC free article] [PubMed] [Google Scholar]
Associated Data
This section collects any data citations, data availability statements, or supplementary materials included in this article.