Abstract
Due to the lack of patient-specific inlet flow waveform measurements, most computational fluid dynamics (CFD) simulations of intracranial aneurysms usually employ waveforms that are not patient-specific as inlet boundary conditions for the computational model. The current study examined how this assumption affects the predicted hemodynamics in patient-specific aneurysm geometries. We examined wall shear stress (WSS) and oscillatory shear index (OSI), the two most widely studied hemodynamic quantities that have been shown to predict aneurysm rupture, as well as maximal WSS (MWSS), energy loss (EL) and pressure loss coefficient (PLc). Sixteen pulsatile CFD simulations were carried out on four typical saccular aneurysms using 4 different waveforms and an identical inflow rate as inlet boundary conditions. Our results demonstrated that under the same mean inflow rate, different waveforms produced almost identical WSS distributions and WSS magnitudes, similar OSI distributions but drastically different OSI magnitudes. The OSI magnitude is correlated with the pulsatility index of the waveform. Furthermore, there is a linear relationship between aneurysm-averaged OSI values calculated from one waveform and those calculated from another waveform. In addition, different waveforms produced similar MWSS, EL and PLc in each aneurysm. In conclusion, inlet waveform has minimal effects on WSS, OSI distribution, MWSS, EL and PLc and a strong effect on OSI magnitude, but aneurysm-averaged OSI from different waveforms has a strong linear correlation with each other across different aneurysms, indicating that for the same aneurysm cohort, different waveforms can consistently stratify (rank) OSI of aneurysms.
Keywords: Intracranial aneurysm, computational flow dynamics, boundary condition, inlet waveform, wall shear stress, oscillatory shear index
Introduction
Intracranial aneurysms (IAs) are pathological dilatations of arterial walls that affect up to 5% of the entire population (Rinkel et al., 1998). Ruptured IAs cause subarachnoid hemorrhage and its sequelae, resulting in significant morbidity and mortality (Broderick et al., 1994; Cross et al., 2003; Hop et al., 1997). Image-based computational fluid dynamics (CFD) has been widely used to obtain patient-specific hemodynamic fields in IAs to stratify aneurysm rupture risk (Cebral et al., 2011; Jou et al., 2008; Meng et al., 2013; Shojima et al., 2004; Xiang et al., 2011a; Xiang et al., 2013). Recent studies show that hemodynamics are promising metrics to directly impact the clinical practice on treating aneurysms (Cebral et al., 2011; Xiang et al., 2011a; Xiang et al., 2013). Two hemodynamic parameters, wall shear stress (WSS, the tangential frictional stress caused by the action of flowing blood on the vessel wall endothelium) and oscillatory shear index (OSI, the WSS direction change during one cardiac cycle), have received particular attention due to their ability to elicit biological responses of the arterial wall (Meng et al., 2013; Shojima et al., 2004; Xiang et al., 2011a). In our previous study, we have found that low WSS and high OSI are independently associated with aneurysm rupture (Xiang et al., 2011a). This finding was corroborated by several other aneurysm hemodynamics studies (Kawaguchi et al., 2012; Lu et al., 2011; Miura et al., 2013; Zhang et al., 2011). However, a few studies have also reported high WSS to be correlated with aneurysm growth and rupture status (Castro et al., 2009; Cebral et al., 2011; Sugiyama et al., 2012).
In a recent AJNR editorial, Kallmes raised concerns on the conflicting findings and CFD modeling and assumptions (Kallmes, 2012), which has spurned a debate (Cebral and Meng, 2012; Robertson and Watton, 2012; Strother and Jiang, 2012). It has recently been proposed that both low and high WSS can elicit pathological remodeling of IAs, via different biological pathways (Meng et al., 2013). On the other hand, it is unclear if such discrepancies could also be caused by population bias, or differences in assumptions or simplifications in CFD simulations (Cebral and Meng, 2012).
One such assumption is the inlet boundary condition. Because patient-specific inlet flow and velocity waveform is not routinely obtained, assumptions have to be made regarding CFD boundary conditions. Ideally both patient-specific aneurysm 3D geometries and patient-specific boundary conditions are required for accurate CFD simulation of aneurysms, and most image-based CFD studies are able to adopt patient-specific aneurysm geometries. While patient-specific 3D aneurysm geometries can be reconstructed from a variety of routine imaging modalities including 3D digital subtraction angiography, computed tomography angiography, and magnetic resonance (MR) angiography, patient-specific inlet boundary conditions (for flow rate and waveform) are not available from these imaging modalities. Phase-contrast MR (PC-MR) imaging or transcranial Doppler (TCD) ultrasound would be required for inlet flow measurement, but such procedures are not normally justifiable as a part of the clinical routine. Although a few CFD studies applied patient-specific boundary conditions in their simulations, these studies involved small cohorts (Boussel et al., 2008; Hassan et al., 2004; Jou et al., 2003; Sugiyama et al., 2012). The vast majority of image-based CFD studies have to adopt flow rates and waveforms measured from normal subjects or typical waveforms averaged from multiple subjects as inlet boundary conditions (Cebral et al., 2005b; Jou et al., 2008; Shojima et al., 2004; Xiang et al., 2011a). This raises important questions: What are the effects of the inlet waveform on computational hemodynamics of IAs? How might this affect aneurysm rupture risk prediction based on hemodynamic factors? The objective of this study was to examine the sensitivity of widely used hemodynamic factors derived from CFD to different inlet waveforms under the same inflow rate. We specifically focus on WSS and OSI, the two independent parameters predictive of rupture in our multivariate logistic regression model (Xiang et al., 2011a).
Method
Four typical internal carotid artery (ICA) aneurysms were analyzed in this study (Aneurysms A, B, C and D in Figure 1). Aneurysm A (unruptured, in a 68-year-old woman) was a sidewall aneurysm with a quasi-spherical shape; Aneurysm B (unruptured, in a 66-year-old man) was a near-spherical bifurcation aneurysm with a daughter aneurysm; Aneurysm C (ruptured, in a 45-year-old woman) was a sidewall aneurysm with an irregular oblong shape and a daughter sac; and Aneurysm D (unruptured with headache symptom, in a 56-year-old woman) was a giant aneurysm on the ICA trunk. Three-dimensional angiography images of the patients’ aneurysms were obtained with a Toshiba Infinix VFi/BP frontal C-arm system (Toshiba America Medical Systems, Inc., Tustin, CA). Three-dimensional images of the ICA were then reconstructed in surface-triangulation format using in-house software based on the open-source Visualization Tool Kit libraries, as previously described (Dhar et al., 2008).
Figure 1.
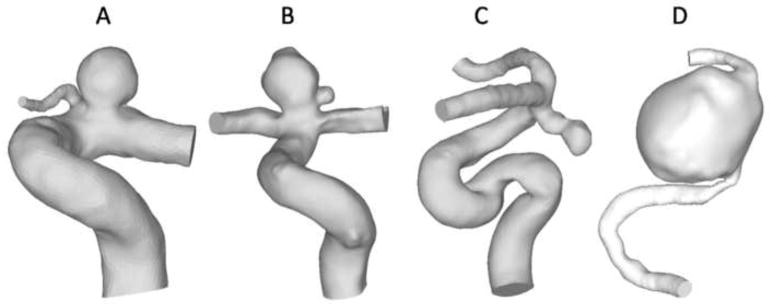
Four patient-specific ICA aneurysm models for current study: Aneurysm A, a sidewall aneurysm with a quasi-spherical shape; Aneurysm B, a near-spherical bifurcation aneurysm with a daughter aneurysm; Aneurysm C, a sidewall aneurysm with an irregular oblong shape and a daughter sac and Aneurysm D, a giant, sidewall aneurysm.
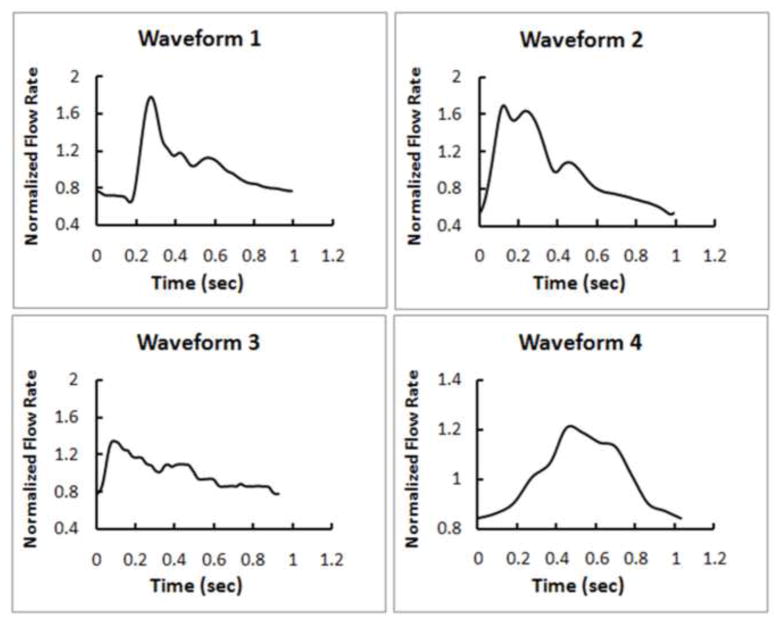
Four different inlet boundary waveforms were used in flow simulations for each aneurysm (Waveform 1, 2, 3 and 4 in Figure 2). Waveform 1 was a typical ICA waveform from 17 healthy young, normal volunteers (Ford et al., 2005); Waveform 2 was a typical ICA waveform from 94 older adults (Hoi et al., 2010); Waveform 3 was an ICA waveform from a normal subject (Xiang et al., 2011a); Waveform 4 was an ICA waveform from a 56-year-old female patient with an ICA aneurysm. In order to compare the effect by different shapes of the waveforms, the same ICA mean flow rate was used for each aneurysm in the flow simulation. Additionally, steady-state simulation for each aneurysm was performed in order to compare with time-averaged WSS from the corresponding pulsatile simulations. Thus, 20 CFD simulations were performed in total.
Figure 2.
Four different waveforms as inlet boundary conditions to CFD investigated in this study. Waveform 1, a typical waveform extracted from 17 young normal volunteers (Ford et al., 2005); Waveform 2, a typical waveform extracted from 94 older adults (Hoi et al., 2010); Waveform 3, a waveform from a normal subject (Xiang et al., 2011a); Waveform 4, a waveform from an ICA aneurysm patient.
Unstructured volumetric meshes were created using the octree approach in ICEM CFD (ANSYS, Inc., Canonsburg, PA). Finite-volume meshes consisted of tetrahedral elements with the maximum size of 0.3 mm and three prism layers with a total height of 0.1 mm near the wall for accurate calculation of WSS. The total numbers of elements ranged from 0.5 to 1 million elements in different aneurysm models. The mesh setup was based on a grid refinement study, where we tested grid sizes of 0.6 to 0.2 mm for the time-averaged velocity and pressure at centerline, and aneurysm-averaged WSS and OSI with the convergence of less than 5%. Using the CFD solver Star-CD (CD Adapco, Melville, NY) with SIMPLE solution method, we solved the flow-governing Navier-Stokes equations with second-order accuracy in space and first-order accuracy in time under pulsatile flow conditions. For spatial resolution, the liner upwind differencing scheme was applied to solve the momentum equations, while the center differencing scheme was applied to solve the mass conservation equation. For temporal resolution, Euler implicit temporal discretization was used. The Algebraic Multigrid method was used to solve the system of equations. In all simulations, a typical ICA flow rate of 4.6 mL/s from the literature (Fahrig et al., 1999) was used as inlet mean flow rate at the inlet of each model, from which the inlet mean velocity is obtained by dividing it with the inlet area. The four aforementioned velocity waveforms were scaled to this mean velocity. Traction-free boundary conditions were implemented at the outlets. When multiple outlets were present, the mass flow rate through each outlet artery was made proportional to the cube of its diameter based on the principle of optimal work (Oka and Nakai, 1987). Justified in large vessels (Lee and Steinman, 2007), blood was modeled as a Newtonian fluid and laminar flow, with a density of 1056 kg/m3 and a viscosity of 0.0035 N·s/m2. A time step of 1 ms was used, which gave 1,000 time steps per cardiac cycle. Pulsatile flow simulations were run for three cardiac cycles to ensure that numerical stability had been reached, and the solutions were saved at every 0.02 second of the last cycle for postprocessing. A steady-state simulation was also performed for each aneurysm under the inlet flow rate of 4.6 mL/s (equal to the mean flow rate at the inlet in all pulsatile simulations).
We used both qualitative (contour distribution) and quantitative WSS and OSI representations over the last cardiac cycle to test their sensitivity to the inlet boundary condition. The instantaneous WSS at any point in space is time-averaged over a cardiac cycle. For quantitative comparisons of results from different waveforms, we further spatially averaged WSS and OSI over the aneurysm sac (Xiang et al., 2011a) to give the aneurysm-averaged WSS and OSI. Other hemodynamic parameters we analyzed include maximal WSS (MWSS) (Cebral et al., 2011), energy loss (EL) (Qian et al., 2011) and pressure loss coefficient (PLc) (Takao et al., 2012). These have been reported to be associated with IA rupture in studies from other groups.
Results
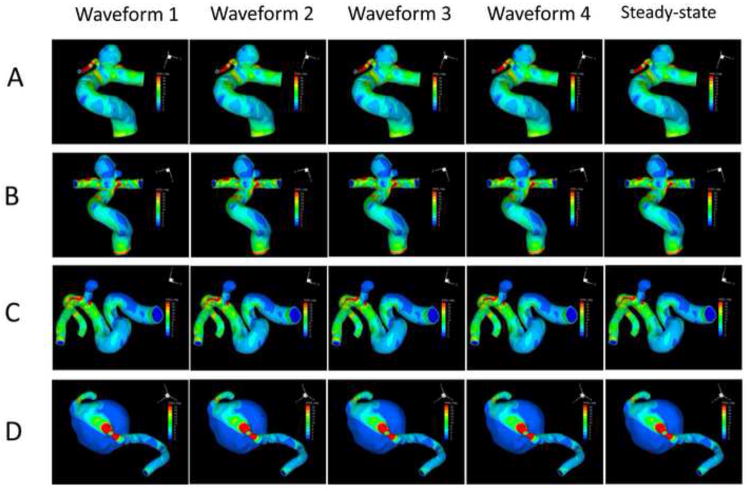
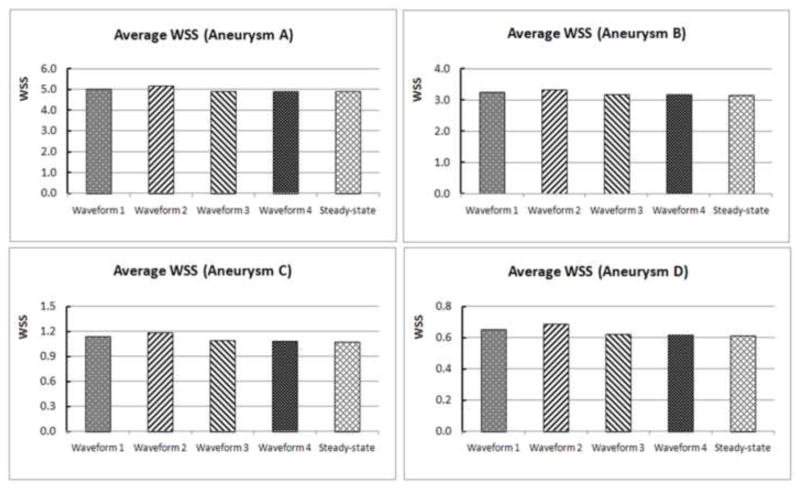
Figure 3 shows the luminal distributions of time-averaged WSS predicted by the four pulsatile simulations with different inlet flow waveforms and the WSS from the steady-state simulations. For each aneurysm, different waveforms gave almost identical WSS contour distributions, which were the same as the WSS distribution from the steady-state simulation for the same aneurysm. Figure 4 quantitatively compares the aneurysm-averaged WSS for the four aneurysms obtained from the four waveforms and the steady-state simulation for each ICA aneurysm. Most global differences were within 1%, with the largest difference between any two aneurysm-averaged WSS below 5%.
Figure 3.
WSS distributions at the luminal wall of the four aneurysms (A, B, C and D) from pulsatile flow simulations using the four different waveforms (1, 2, 3 and 4) and the corresponding steady-state flow simulations using the same mean inflow boundary condition.
Figure 4.
Quantitative comparison of the aneurysm-averaged WSS for the four aneurysms (A, B, C and D) from pulsatile flow simulations using four different waveforms (1, 2, 3 and 4) and the corresponding steady-state flow simulations.
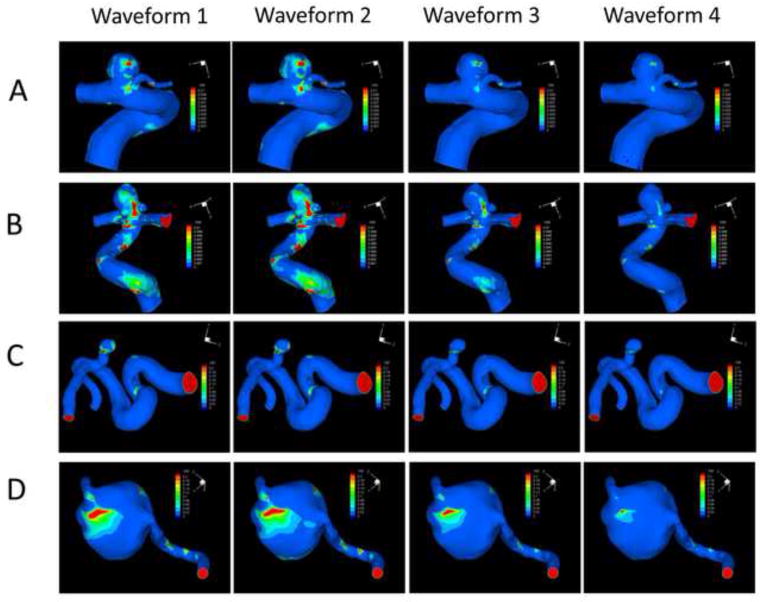
Figure 5 gives the OSI distributions for the four aneurysms based on the four inlet waveforms (steady-state simulations would generate zero OSI everywhere). It clearly demonstrates that, in all the four aneurysms, different waveforms produced similar distributions but different values of OSI. The patterns of OSI distribution seem to remain the same for each aneurysm (e.g. the maximal OSI are always at the same locations) regardless of the waveform used in the CFD simulation.
Figure 5.
OSI distributions at the luminal wall of the four aneurysms (A, B, C and D) using the four different waveforms (1, 2, 3 and 4).
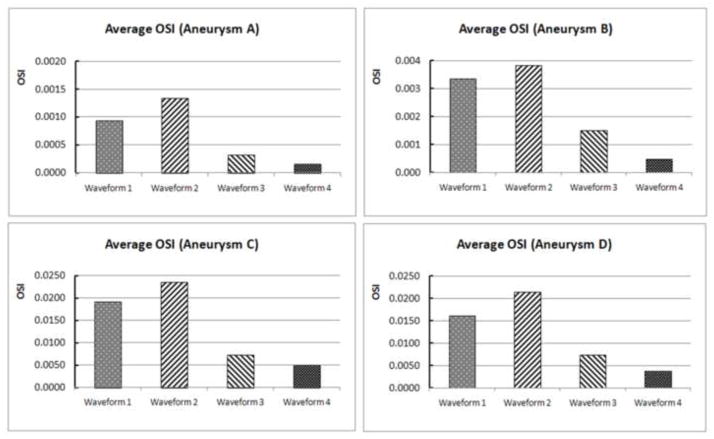
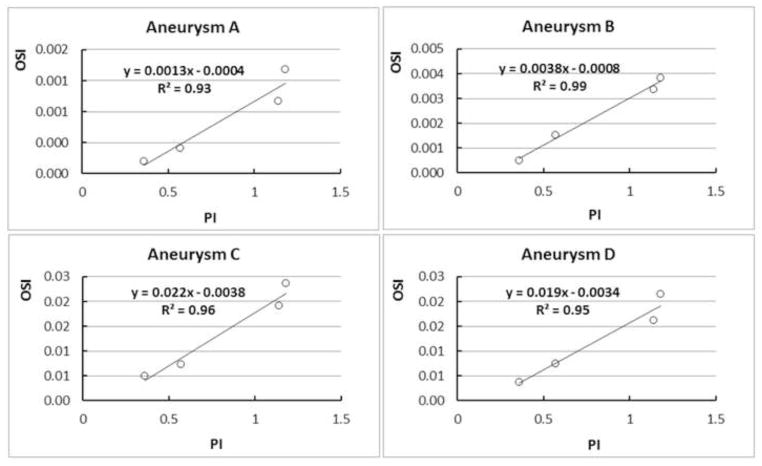
Figure 6 gives a quantitative comparison of the aneurysm-averaged OSI generated from CFD by different waveforms, showing drastic variation of this global quantity in each aneurysm. However, when we plotted the aneurysm-averaged OSI value and the pulsatility index (PI) of the waveform in each aneurysm, we found the strong correlation between OSI and PI (Figure 7). Pulsatility index is defined as the difference between the maximum and minimum flow rate (velocity) divided by the cycle average flow rate (velocity) in a cardiac cycle at specific vessel location (here the inlet vessel). It is considered the most characteristic index that captures the waveform feature (Ford et al., 2005). The PI values for these four waveforms used in the current study were 1.14, 1.18, 0.57 and 0.36 for Waveforms 1, 2, 3 and 4, respectively. Our finding demonstrates that in the same aneurysm geometry, the average OSI value is proportional to PI of the waveform. The inlet waveform influences aneurysmal OSI mainly through the pulsatility of the waveform—the relative dynamic range of the inlet velocity.
Figure 6.
Quantitative comparison of the aneurysm-averaged OSI in the four aneurysms (A, B, C and D) using the four different waveforms (waveform 1, 2, 3 and 4).
Figure 7.
In each aneurysm, the aneurysm-averaged OSI and pulsatility index (PI) are strongly correlated across different waveforms (represented by open circles).
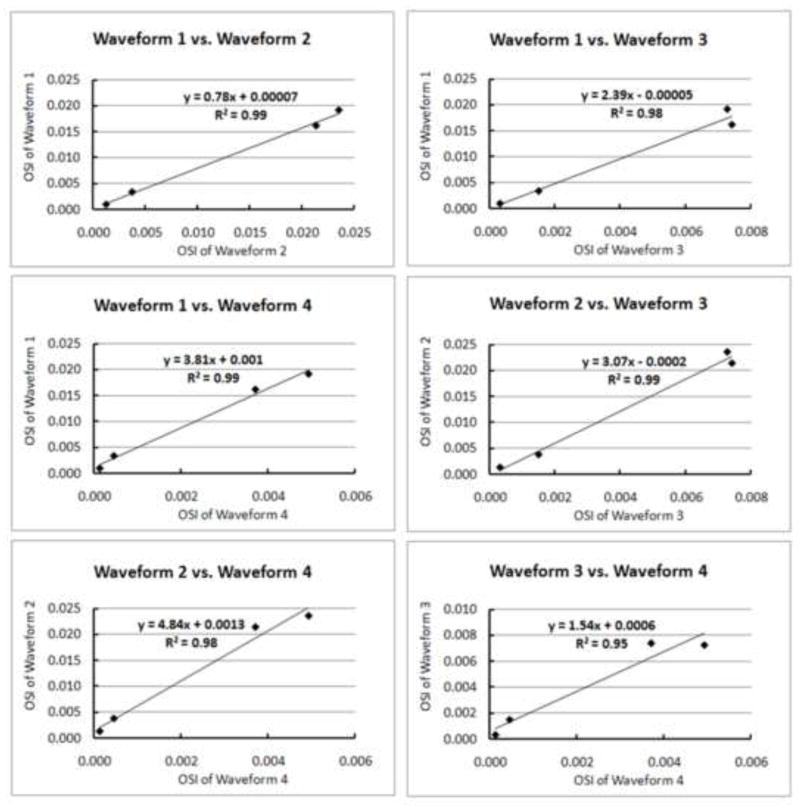
We also examined whether across different aneurysms there was any correlation between the aneurysm-averaged OSI values from any two waveforms against each other. Figure 8 shows the strong correlations (R2 = 0.95–0.99) displayed between any two approaches, indicating that different waveforms gave the same stratification (rank) of OSI across all aneurysms.
Figure 8.
Aneurysm-averaged OSI values calculated from any two waveforms display strong linear correlation, providing a basis for linear transformation of OSI from one waveform to another. Here, aneurysm-averaged OSI provides consistent stratification (ranking) of aneurysms (diamond symbols) regardless of the waveform input.
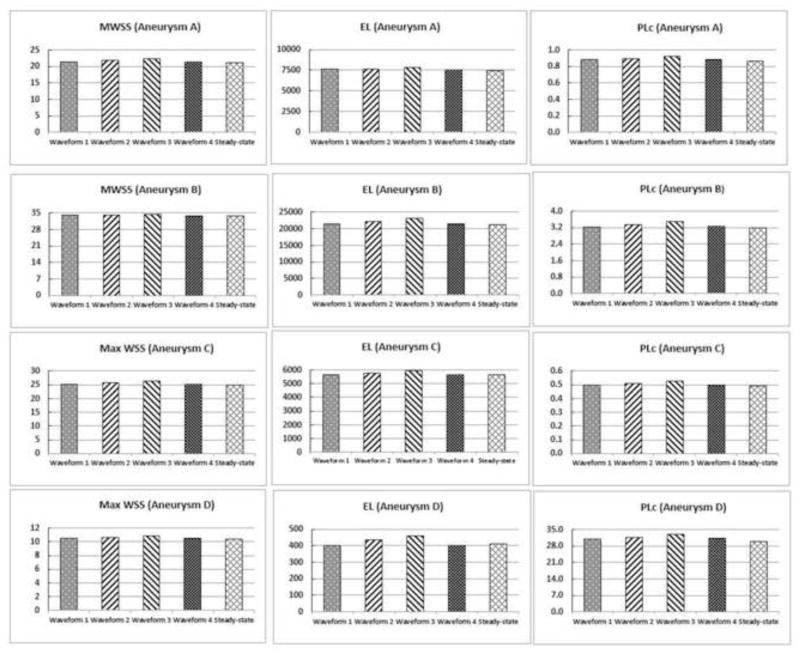
Figure 9 shows quantitative comparison of MWSS, EL and PLc from pulsatile simulations using the four different waveforms and steady-state simulations in all aneurysms. Similar to findings of aneurysm-averaged WSS, we found that values of these hemodynamic parameters in each aneurysm are almost identical under different waveforms (<5% differences).
Figure 9.
Quantitative comparison of additional hemodynamic parameters (MWSS, EL and PLc) in the four aneurysms (A, B, C and D) using the four different waveforms and the corresponding steady-state flow simulations.
Discussions
With the advancement of medical imaging over the past decade, image-based CFD of IAs has emerged as a promising approach to studying aneurysm rupture risk stratification (Antiga et al., 2008; Cebral et al., 2011; Steinman, 2002; Xiang et al., 2011a; Xiang et al., 2013). CFD simulations provide important clues about the roles that hemodynamic forces may play in the natural history of IAs (Meng et al., 2013; Xiang et al., 2013). In order to make image-based CFD simulation tractable, it often requires assumptions such as blood viscosity, aneurysm and artery wall dispensability, and inlet flow boundary conditions (Steinman, 2002). In particular, since patient-specific inlet flow measurement is not usually allowed as a part of normal clinical routine, CFD researchers have to resort to using non-patient-specific flow waveforms (often from measurement in one normal subject, or from the literature that provides a waveform of one individual patient) as the inlet boundary condition for aneurysm CFD simulations (Xiang et al., 2013), except for some studies that have approved PC-MR measurement protocols (Boussel et al., 2008; Sugiyama et al., 2012).
While using a surrogate waveform is a common practice where no other options are available, the waveform effects on CFD-simulated aneurysmal hemodynamics have not been extensively studied before and remain a wide concern within the CFD community. This study investigated the effects of the inlet waveform on computational hemodynamics of IAs. In particular, we examined how this affects two hemodynamic parameters (WSS and OSI) that have been shown by multivariate logistic regression to independently predict aneurysm rupture in a large cohort of patients (Xiang et al., 2011a).
Our study supports findings from the few studies that have tested the sensitivity of inlet boundary conditions on aneurysm CFD simulations in the literature (Cebral et al., 2005a; Evju et al., 2013; Geers et al., 2014; Marzo et al., 2011; Marzo et al., 2009). Geers et al systematically varied inlet flow rate waveform to represent different heart rates, pulsatility indices and flow rates. They found that steady flow simulations accurately approximated the time-averaged WSS from pulsatile simulations under the same mean inlet flow rate (Geers et al., 2014), which is consistent with our results (Figure 3). Marzo et al compared the effects of inlet boundary conditions by three different methods: (1) patient-specific PC-MR measurements, (2) estimated flow rate and waveform from a 1D circulation model, and (3) the same estimated waveform with a flow rate scaled to produce a mean WSS of 1.5 Pa at the inlet (Marzo et al., 2011). They found as much as 69% differences in WSS between measured and modeled boundary conditions. However, when the WSS was normalized, the WSS discrepancies were significantly reduced, and the WSS distributions became almost identical among the three methods, which is consistent with our results on WSS (Figure 3). In another study, Evju et al also found strong correlations between WSS values from two different inflow conditions among 12 aneurysms (Evju et al., 2013). Moreover, Marzo et al found that the OSI distributions from had similar patterns with difference magnitudes (up to 23% difference), which echoes our findings (Figures 5 and 6), except that we have seen as much as 8 times differences in OSI magnitude. Furthermore we have found that the OSI magnitude difference is most likely contributed by the PI of the waveform. In addition, OSI values from different waveforms are correlated with each other across different aneurysms. Although the setups of these studies were different, they arrived at a similar conclusion: different inlet boundary conditions have only limited effects on aneurysmal WSS and OSI for the purpose of aneurysm rupture stratification.
These results may shed light on some of the seemingly confounding results obtained by various CFD researchers, a concern raised by Kallmes in the AJNR editorial (Kallmes, 2012). If confirmed in larger cohorts, our findings suggest that CFD carried out under the same inlet flow rate for the same group of aneurysm geometries using the same analysis methods, albeit with different waveform boundary conditions, could give similar time-averaged WSS distributions and magnitudes, similar OSI distributions with different magnitudes, which nonetheless could stratify or rank aneurysms (according to aneurysm-averaged OSI) consistently.
To be sure, the WSS distribution and aneurysm-averaged WSS should not remain identical when the inlet waveforms changes, even under the same inlet flow rate. The waveform affects the flow acceleration and deceleration, which varies spatially and temporally. In complex geometry, transient 3D flow dynamics becomes very complex due to sometimes additive and sometimes opposing effects of inertial force, pressure gradient and viscose force. It takes time for blood in the aneurysm to accelerate and decelerate in response to flow rate changes in the parent vessel (Geers et al., 2014). Therefore, the waveform should be expected to affect both instantaneous and time-averaged WSS distribution. However, when inlet flow rate is fixed, the inlet waveform has little effect on the WSS distribution and aneurysm-averaged WSS.
Clearly, patient-specific inlet flow rate is highly desirable for the above reasons. If this is not possible, however, one could consider taking the approach of normalizing the aneurysmal WSS by the averaged parent-vessel WSS to remove the influence of inlet boundary condition, when discussing aneurysm rupture risk (Xiang et al., 2011a).
This study has also demonstrated that under the same inlet flow rate, varying the waveform does not affect the overall OSI distribution in the aneurysm but drastically affects the OSI magnitude, and aneurysm-averaged OSI value is strongly correlated with the pulsatility index of the inlet waveform. Thus it appears that inlet waveform influences aneurysmal OSI magnitude mainly through the pulsatility of the waveform. i.e. the relative dynamic range of the inlet velocity. Furthermore, we have demonstrated that, within an aneurysm cohort, the aneurysm-averaged OSI values from CFD using one inlet waveform are linearly correlated with those from CFD using another waveform. While PC-MR or TCD measurements for patient-specific inlet waveforms will not be widely implemented in our healthcare system in the near future, we may investigate if it is possible to derive aneurysmal OSI from waveform characteristics (e.g. PI) and aneurysm geometry characteristics without performing pulsatile CFD simulations (Retarekar et al., 2014).
In addition to WSS and OSI, we have also examined, for the first time, the inlet waveform effect on other hemodynamic factors including MWSS, EL and PLc. We found that under the same inlet flow rate, varying the waveform does not affect these hemodynamic parameters.
In closing, we would like to stress that patient-specific flow boundary conditions are highly desired for image-based CFD simulations. However, only a few CFD studies have them available (Boussel et al., 2008; Hassan et al., 2004; Jou et al., 2003; Sugiyama et al., 2012), and these studies only contain limited number of cases. For studies of large cohorts aiming at finding statistical correlations between aneurysm rupture and hemodynamics, we may have to use non-patient-specific inlet boundary conditions in the current situation. Furthermore, even if PC-MR were done on all patients, there may be many variations of flow rate and waveform that would limit the value of a one-time patient-specific boundary condition. For example, there may be significant variations associated with patient stress or anxiety (Fedorov et al., 1990; Kulikov et al., 2005), physical exertion (Gonzalez-Alonso et al., 2004; Ide and Secher, 2000), and even day-today activities (Hajjar et al., 2007). Thus, patient-specific boundary conditions measured with a patient lying in a scanner with stress or anxiety, might not represent the normal physiology for that patient, and thus might not exactly characterize the type of boundary conditions for the flow simulations and statistical associations (Marzo et al., 2011). It is possible that in the future, patient-specific boundary conditions will be obtained as part of routine clinical procedures for all patients. Until then, we may have to rely on assumed inlet waveforms.
There are several limitations in this study. First, commonly adopted CFD assumptions such as Newtonian fluid, rigid wall, and outlet flow split were used in this study and they may affect the simulated flow field (Xiang et al., 2011b). For example, rigid-wall model tends to slightly overestimate WSS (Dempere-Marco et al., 2006). However, we believe their effect is minimal for current study, which investigated the effect of different waveforms and thus it is better to make other assumptions as control. Secondly, we only investigated 4 ICA aneurysm geometries. The study aims to shed light on how different waveforms affect aneurysmal hemodynamics in typical patient-specific aneurysms. Thirdly, only one aneurysm location is examined, although we believe that other locations will produce similar results. However, these findings need to be validated in a larger cohort with different locations in the future. Lastly, the flow simulations in current study are based on laminar flow assumption. Recently, Valen-Sendstad et al reported that transitional flow may occur in some bifurcation aneurysms using high-resolution CFD simulation (Valen-Sendstad et al., 2013; Valen-Sendstad and Steinman, 2014). It may affect our conclusion in this study and need further investigation in the future.
Conclusion
Inlet waveform has minimal effects on WSS, OSI distribution, MWSS, EL and PLc in patient-specific aneurysms as long as inlet mean flow rate is unchanged. It has a strong effect on OSI magnitude, mainly through pulsatility of the waveform. The aneurysm-averaged OSI predicted from different waveforms has a strong linear correlation with each other across different aneurysms in a cohort, indicating that different waveforms can consistently stratify (rank) OSI of aneurysms.
Footnotes
Conflict of Interest Statement
Xiang: awardee for the American Society for Quality Biomedical Division Dr. Richard J. Schlesinger grant and principal investigator of Brain Aneurysm Foundation grant. Siddiqui: grants–co-investigator of aforementioned NIH grant, University at Buffalo; financial interests–Hotspur, Intratech Medical, StimSox, Valor Medical; consultant–Codman & Shurtleff, Concentric Medical, ev3/Covidien Vascular Therapies, GuidePoint Global Consulting, Penumbra; speakers’ bureaus—Codman & Shurtleff, Genentech; advisory board–Codman & Shurtleff; honoraria–Abbott Vascular, Codman & Shurtleff, Genentech, Neocure Group LLC. Meng: principal investigator of NIH grant (R01NS064592).
Publisher's Disclaimer: This is a PDF file of an unedited manuscript that has been accepted for publication. As a service to our customers we are providing this early version of the manuscript. The manuscript will undergo copyediting, typesetting, and review of the resulting proof before it is published in its final citable form. Please note that during the production process errors may be discovered which could affect the content, and all legal disclaimers that apply to the journal pertain.
References
- Antiga L, Piccinelli M, Botti L, Ene-Iordache B, Remuzzi A, Steinman DA. An image-based modeling framework for patient-specific computational hemodynamics. Med Biol Eng Comput. 2008;46:1097–1112. doi: 10.1007/s11517-008-0420-1. [DOI] [PubMed] [Google Scholar]
- Boussel L, Rayz V, McCulloch C, Martin A, Acevedo-Bolton G, Lawton M, Higashida R, Smith WS, Young WL, Saloner D. Aneurysm growth occurs at region of low wall shear stress: patient-specific correlation of hemodynamics and growth in a longitudinal study. Stroke; a journal of cerebral circulation. 2008;39:2997–3002. doi: 10.1161/STROKEAHA.108.521617. [DOI] [PMC free article] [PubMed] [Google Scholar]
- Broderick JP, Brott TG, Duldner JE, Tomsick T, Leach A. Initial and recurrent bleeding are the major causes of death following subarachnoid hemorrhage. Stroke. 1994;25:1342–1347. doi: 10.1161/01.str.25.7.1342. [DOI] [PubMed] [Google Scholar]
- Castro M, Putman C, Radaelli A, Frangi A, Cebral J. Hemodynamics and rupture of terminal cerebral aneurysms. Acad Radiol. 2009;16:1201–1207. doi: 10.1016/j.acra.2009.03.022. [DOI] [PubMed] [Google Scholar]
- Cebral JR, Castro MA, Appanaboyina S, Putman CM, Millan D, Frangi AF. Efficient pipeline for image-based patient-specific analysis of cerebral aneurysm hemodynamics: technique and sensitivity. IEEE transactions on medical imaging. 2005a;24:457–467. doi: 10.1109/tmi.2005.844159. [DOI] [PubMed] [Google Scholar]
- Cebral JR, Castro MA, Burgess JE, Pergolizzi RS, Sheridan MJ, Putman CM. Characterization of cerebral aneurysms for assessing risk of rupture by using patient-specific computational hemodynamics models. AJNR Am J Neuroradiol. 2005b;26:2550–2559. [PMC free article] [PubMed] [Google Scholar]
- Cebral JR, Meng H. Counterpoint: realizing the clinical utility of computational fluid dynamics--closing the gap. AJNR American journal of neuroradiology. 2012;33:396–398. doi: 10.3174/ajnr.A2994. [DOI] [PMC free article] [PubMed] [Google Scholar]
- Cebral JR, Mut F, Weir J, Putman C. Quantitative characterization of the hemodynamic environment in ruptured and unruptured brain aneurysms. AJNR American journal of neuroradiology. 2011;32:145–151. doi: 10.3174/ajnr.A2419. [DOI] [PMC free article] [PubMed] [Google Scholar]
- Cross DT, 3rd, Tirschwell DL, Clark MA, Tuden D, Derdeyn CP, Moran CJ, Dacey RG., Jr Mortality rates after subarachnoid hemorrhage: variations according to hospital case volume in 18 states. J Neurosurg. 2003;99:810–817. doi: 10.3171/jns.2003.99.5.0810. [DOI] [PubMed] [Google Scholar]
- Dempere-Marco L, Oubel E, Castro M, Putman C, Frangi A, Cebral J. CFD analysis incorporating the influence of wall motion: application to intracranial aneurysms. Medical image computing and computer-assisted intervention : MICCAI … International Conference on Medical Image Computing and Computer-Assisted Intervention. 2006;9:438–445. doi: 10.1007/11866763_54. [DOI] [PubMed] [Google Scholar]
- Dhar S, Tremmel M, Mocco J, Kim M, Yamamoto J, Siddiqui AH, Hopkins LN, Meng H. Morphology parameters for intracranial aneurysm rupture risk assessment. Neurosurgery. 2008;63:185–196. doi: 10.1227/01.NEU.0000316847.64140.81. discussion 196–187. [DOI] [PMC free article] [PubMed] [Google Scholar]
- Evju O, Valen-Sendstad K, Mardal KA. A study of wall shear stress in 12 aneurysms with respect to different viscosity models and flow conditions. Journal of biomechanics. 2013;46:2802–2808. doi: 10.1016/j.jbiomech.2013.09.004. [DOI] [PubMed] [Google Scholar]
- Fahrig R, Nikolov H, Fox AJ, Holdsworth DW. A three-dimensional cerebrovascular flow phantom. Medical physics. 1999;26:1589–1599. doi: 10.1118/1.598672. [DOI] [PubMed] [Google Scholar]
- Fedorov BM, Sebekina TV, Sinitsyna TM, Strel’tsova EN, Vakulenko VM, Nikolaeva TG. Stress and blood circulation in man. Kosm Biol Aviakosm Med. 1990;24:35–40. [PubMed] [Google Scholar]
- Ford MD, Alperin N, Lee SH, Holdsworth DW, Steinman DA. Characterization of volumetric flow rate waveforms in the normal internal carotid and vertebral arteries. Physiol Meas. 2005;26:477–488. doi: 10.1088/0967-3334/26/4/013. [DOI] [PubMed] [Google Scholar]
- Geers AJ, Larrabide I, Morales HG, Frangi AF. Approximating hemodynamics of cerebral aneurysms with steady flow simulations. Journal of biomechanics. 2014;47:178–185. doi: 10.1016/j.jbiomech.2013.09.033. [DOI] [PubMed] [Google Scholar]
- Gonzalez-Alonso J, Dalsgaard MK, Osada T, Volianitis S, Dawson EA, Yoshiga CC, Secher NH. Brain and central haemodynamics and oxygenation during maximal exercise in humans. J Physiol. 2004;557:331–342. doi: 10.1113/jphysiol.2004.060574. [DOI] [PMC free article] [PubMed] [Google Scholar]
- Hajjar I, Selim M, Novak P, Novak V. The relationship between nighttime dipping in blood pressure and cerebral hemodynamics in nonstroke patients. J Clin Hypertens (Greenwich) 2007;9:929–936. doi: 10.1111/j.1524-6175.2007.07342.x. [DOI] [PMC free article] [PubMed] [Google Scholar]
- Hassan T, Timofeev EV, Saito T, Shimizu H, Ezura M, Tominaga T, Takahashi A, Takayama K. Computational replicas: anatomic reconstructions of cerebral vessels as volume numerical grids at three-dimensional angiography. AJNR Am J Neuroradiol. 2004;25:1356–1365. [PMC free article] [PubMed] [Google Scholar]
- Hoi Y, Wasserman BA, Lakatta EG, Steinman DA. Carotid bifurcation hemodynamics in older adults: effect of measured versus assumed flow waveform. J Biomech Eng. 2010;132:071006. doi: 10.1115/1.4001265. [DOI] [PMC free article] [PubMed] [Google Scholar]
- Hop JW, Rinkel GJ, Algra A, van Gijn J. Case-fatality rates and functional outcome after subarachnoid hemorrhage: a systematic review. Stroke; a journal of cerebral circulation. 1997;28:660–664. doi: 10.1161/01.str.28.3.660. [DOI] [PubMed] [Google Scholar]
- Ide K, Secher NH. Cerebral blood flow and metabolism during exercise. Prog Neurobiol. 2000;61:397–414. doi: 10.1016/s0301-0082(99)00057-x. [DOI] [PubMed] [Google Scholar]
- Jou LD, Lee DH, Morsi H, Mawad ME. Wall shear stress on ruptured and unruptured intracranial aneurysms at the internal carotid artery. AJNR American journal of neuroradiology. 2008;29:1761–1767. doi: 10.3174/ajnr.A1180. [DOI] [PMC free article] [PubMed] [Google Scholar]
- Jou LD, Quick CM, Young WL, Lawton MT, Higashida R, Martin A, Saloner D. Computational approach to quantifying hemodynamic forces in giant cerebral aneurysms. AJNR Am J Neuroradiol. 2003;24:1804–1810. [PMC free article] [PubMed] [Google Scholar]
- Kallmes DF. Point: CFD--computational fluid dynamics or confounding factor dissemination. AJNR American journal of neuroradiology. 2012;33:395–396. doi: 10.3174/ajnr.A2993. [DOI] [PMC free article] [PubMed] [Google Scholar]
- Kawaguchi T, Nishimura S, Kanamori M, Takazawa H, Omodaka S, Sato K, Maeda N, Yokoyama Y, Midorikawa H, Sasaki T, Nishijima M. Distinctive flow pattern of wall shear stress and oscillatory shear index: similarity and dissimilarity in ruptured and unruptured cerebral aneurysm blebs. J Neurosurg. 2012;117:774–780. doi: 10.3171/2012.7.JNS111991. [DOI] [PubMed] [Google Scholar]
- Kulikov VP, Grechishnikov VN, Sidor MV. Response of cerebral hemodynamics to combined stress impacts. Patol Fiziol Eksp Ter. 2005:7–9. [PubMed] [Google Scholar]
- Lee SW, Steinman DA. On the relative importance of rheology for image-based CFD models of the carotid bifurcation. Journal of biomechanical engineering. 2007;129:273–278. doi: 10.1115/1.2540836. [DOI] [PubMed] [Google Scholar]
- Lu G, Huang L, Zhang XL, Wang SZ, Hong Y, Hu Z, Geng DY. Influence of hemodynamic factors on rupture of intracranial aneurysms: patient-specific 3D mirror aneurysms model computational fluid dynamics simulation. AJNR American journal of neuroradiology. 2011;32:1255–1261. doi: 10.3174/ajnr.A2461. [DOI] [PMC free article] [PubMed] [Google Scholar]
- Marzo A, Singh P, Larrabide I, Radaelli A, Coley S, Gwilliam M, Wilkinson ID, Lawford P, Reymond P, Patel U, Frangi A, Hose DR. Computational hemodynamics in cerebral aneurysms: the effects of modeled versus measured boundary conditions. Annals of biomedical engineering. 2011;39:884–896. doi: 10.1007/s10439-010-0187-z. [DOI] [PubMed] [Google Scholar]
- Marzo A, Singh P, Reymond P, Stergiopulos N, Patel U, Hose R. Influence of inlet boundary conditions on the local haemodynamics of intracranial aneurysms. Computer methods in biomechanics and biomedical engineering. 2009;12:431–444. doi: 10.1080/10255840802654335. [DOI] [PubMed] [Google Scholar]
- Meng H, Tutino VM, Xiang J, Siddiqui A. High WSS or Low WSS? Complex Interactions of Hemodynamics with Intracranial Aneurysm Initiation, Growth, and Rupture: Toward a Unifying Hypothesis. AJNR. American journal of neuroradiology. 2013 doi: 10.3174/ajnr.A3558. [DOI] [PMC free article] [PubMed] [Google Scholar]
- Miura Y, Ishida F, Umeda Y, Tanemura H, Suzuki H, Matsushima S, Shimosaka S, Taki W. Low wall shear stress is independently associated with the rupture status of middle cerebral artery aneurysms. Stroke; a journal of cerebral circulation. 2013;44:519–521. doi: 10.1161/STROKEAHA.112.675306. [DOI] [PubMed] [Google Scholar]
- Oka S, Nakai M. Optimality principle in vascular bifurcation. Biorheology. 1987;24:737–751. doi: 10.3233/bir-1987-24624. [DOI] [PubMed] [Google Scholar]
- Qian Y, Takao H, Umezu M, Murayama Y. Risk analysis of unruptured aneurysms using computational fluid dynamics technology: preliminary results. AJNR American journal of neuroradiology. 2011;32:1948–1955. doi: 10.3174/ajnr.A2655. [DOI] [PMC free article] [PubMed] [Google Scholar]
- Retarekar R, Ramachandran M, Berkowitz B, Harbaugh RE, Hasan D, Rosenwasser RH, Ogilvy CS, Raghavan ML. Stratification of a population of intracranial aneurysms using blood flow metrics. Computer methods in biomechanics and biomedical engineering. 2014 doi: 10.1080/10255842.2013.869322. [DOI] [PMC free article] [PubMed] [Google Scholar]
- Rinkel GJ, Djibuti M, Algra A, van Gijn J. Prevalence and risk of rupture of intracranial aneurysms: a systematic review. Stroke; a journal of cerebral circulation. 1998;29:251–256. doi: 10.1161/01.str.29.1.251. [DOI] [PubMed] [Google Scholar]
- Robertson AM, Watton PN. Computational fluid dynamics in aneurysm research: critical reflections, future directions. AJNR American journal of neuroradiology. 2012;33:992–995. doi: 10.3174/ajnr.A3192. [DOI] [PMC free article] [PubMed] [Google Scholar]
- Shojima M, Oshima M, Takagi K, Torii R, Hayakawa M, Katada K, Morita A, Kirino T. Magnitude and role of wall shear stress on cerebral aneurysm: computational fluid dynamic study of 20 middle cerebral artery aneurysms. Stroke; a journal of cerebral circulation. 2004;35:2500–2505. doi: 10.1161/01.STR.0000144648.89172.0f. [DOI] [PubMed] [Google Scholar]
- Steinman DA. Image-based computational fluid dynamics modeling in realistic arterial geometries. Annals of biomedical engineering. 2002;30:483–497. doi: 10.1114/1.1467679. [DOI] [PubMed] [Google Scholar]
- Strother CM, Jiang J. Intracranial aneurysms, cancer, x-rays, and computational fluid dynamics. AJNR American journal of neuroradiology. 2012;33:991–992. doi: 10.3174/ajnr.A3163. [DOI] [PMC free article] [PubMed] [Google Scholar]
- Sugiyama S, Meng H, Funamoto K, Inoue T, Fujimura M, Nakayama T, Omodaka S, Shimizu H, Takahashi A, Tominaga T. Hemodynamic analysis of growing intracranial aneurysms arising from a posterior inferior cerebellar artery. World Neurosurg. 2012;78:462–468. doi: 10.1016/j.wneu.2011.09.023. [DOI] [PubMed] [Google Scholar]
- Takao H, Murayama Y, Otsuka S, Qian Y, Mohamed A, Masuda S, Yamamoto M, Abe T. Hemodynamic differences between unruptured and ruptured intracranial aneurysms during observation. Stroke; a journal of cerebral circulation. 2012;43:1436–1439. doi: 10.1161/STROKEAHA.111.640995. [DOI] [PubMed] [Google Scholar]
- Valen-Sendstad K, Mardal KA, Steinman DA. High-resolution CFD detects high-frequency velocity fluctuations in bifurcation, but not sidewall, aneurysms. Journal of biomechanics. 2013;46:402–407. doi: 10.1016/j.jbiomech.2012.10.042. [DOI] [PubMed] [Google Scholar]
- Valen-Sendstad K, Steinman DA. Mind the gap: impact of computational fluid dynamics solution strategy on prediction of intracranial aneurysm hemodynamics and rupture status indicators. AJNR American journal of neuroradiology. 2014;35:536–543. doi: 10.3174/ajnr.A3793. [DOI] [PMC free article] [PubMed] [Google Scholar]
- Xiang J, Natarajan SK, Tremmel M, Ma D, Mocco J, Hopkins LN, Siddiqui AH, Levy EI, Meng H. Hemodynamic-morphologic discriminants for intracranial aneurysm rupture. Stroke; a journal of cerebral circulation. 2011a;42:144–152. doi: 10.1161/STROKEAHA.110.592923. [DOI] [PMC free article] [PubMed] [Google Scholar]
- Xiang J, Tremmel M, Kolega J, Levy EI, Natarajan SK, Meng H. Newtonian viscosity model could overestimate wall shear stress in intracranial aneurysm domes and underestimate rupture risk. Journal of neurointerventional surgery. 2011b doi: 10.1136/neurintsurg-2011-010089. [DOI] [PubMed] [Google Scholar]
- Xiang J, Tutino VM, Snyder KV, Meng H. CFD: Computational Fluid Dynamics or Confounding Factor Dissemination? The Role of Hemodynamics in Intracranial Aneurysm Rupture Risk Assessment. AJNR. American journal of neuroradiology. 2013 doi: 10.3174/ajnr.A3710. [DOI] [PMC free article] [PubMed] [Google Scholar]
- Zhang Y, Mu S, Chen J, Wang S, Li H, Yu H, Jiang F, Yang X. Hemodynamic analysis of intracranial aneurysms with daughter blebs. Eur Neurol. 2011;66:359–367. doi: 10.1159/000332814. [DOI] [PubMed] [Google Scholar]


