

Abstract
Objectives: Although most controlled feeding trials have failed to show an adverse effect of fructose on blood pressure, concerns continue to be raised regarding the role of fructose in hypertension. To quantify the association between fructose-containing sugar (high-fructose corn syrup, sucrose, and fructose) intake and incident hypertension, a systematic review and meta-analysis of prospective cohort studies was undertaken.
Methods: MEDLINE, EMBASE, CINAHL and the Cochrane Library (through February 5, 2014) were searched for relevant studies. Two independent reviewers reviewed and extracted relevant data. Risk estimates were aggregated comparing the lowest (reference) quintile with highest quintile of intake using inverse variance random effect models and expressed as risk ratios (RR) with 95% confidence intervals (CIs). Interstudy heterogeneity was assessed (Cochran Q statistic) and quantified (I 2 statistic). The Newcastle–Ottawa Scale assessed study quality. Clinicaltrials.gov NCT01608620.
Results: Eligibility criteria were met by 3 prospective cohorts (n = 37,375 men and 185,855 women) with 58,162 cases of hypertension observed over 2,502,357 person-years of follow-up. Median fructose intake was 5.7–6.0% total energy in the lowest quintile and 13.9–14.3% total energy in the highest quintile. Fructose intake was not associated with incident hypertension (RR = 1.02, 95% CI, 0.99–1.04), with no evidence of heterogeneity (I 2 = 0%, p = 0.59). Spline curve modeling showed a U-shaped relationship with a negative association at intakes ≤50th percentile (∼10% total energy) and a positive association at higher intakes.
Conclusions: Total fructose intake was not associated with an increased risk of hypertension in 3 large prospective cohorts of U.S. men and women.
Key words: fructose, hypertension, meta-analysis, systematic review, prospective cohort
INTRODUCTION
Hypertension is a leading cause of mortality globally [1], and its prevalence is projected to exceed 1.56 billion by 2025 [2]. It is a significant risk factor for stroke, renal failure, and cardiovascular morbidity [3]. Treatment of hypertension and its associated complications is estimated to account for 10% the health budget of developed countries [4]. Despite its high prevalence, blood pressure remains highly modifiable, particularly through diet and lifestyle interventions [3–6]. A major dietary component attributed to the development of hypertension is fructose [7,8]. A compelling mechanism has been proposed wherein fructose depletes adenosine triphosphate, resulting in downstream uric acid generation, consequently inducing oxidative stress in vascular smooth muscle cells, endothelial dysfunction, and the renin–angiotensin system [9]. Evidence supporting this relationship is derived primarily from animal experiments using extreme levels (50–66% of energy) of fructose exposure [10–15]. Indirect evidence also arises from a recent clinical trial which showed that treatment with the xanthine oxidase inhibitor allopurinol reduced uric acid levels and features of the metabolic syndrome compared with no allopurinol on a background of diets supplemented with excess energy from fructose [16]. It is unclear whether this outcome would have differed if another source of excess calories was used, as there was no energy matched comparator used. In addition, weak evidence from cross-sectional analyses also buttress positive associations between prevalence of hypertension and sugar-sweetened beverages (SSBs) [17–19].
These data contrast with high-quality evidence from systematic reviews and meta-analyses of controlled feeding trials on the effect of fructose in isocaloric substitution for other carbohydrates on blood pressure [20] and uric acid [21]. Although the isocaloric comparisons were at relatively high doses (median dose: 79 g/d; range: 53–182 g/d), these studies consistently demonstrated no evidence of harm, even suggesting a potential beneficial blood pressure effect. Whether fructose intakes at “real-world” levels plays a role in the development of hypertension remains unclear [22]. To clarify the role of total fructose-containing sugars in the development of hypertension and provide better evidence to support dietary guidelines, we conducted a systematic review and meta-analysis of prospective cohorts investigating the relationship between self-reported, “real-world” total fructose-containing sugar intakes and incident hypertension.
MATERIALS AND METHODS
Design
We followed the Cochrane Handbook for Systematic Reviews of Interventions in conducting this meta-analysis [23]. Results are reported according to the “Meta-Analysis of Observational Studies in Epidemiology” and “Preferred Reporting Items for Systematic Reviews and Meta-Analyses” guidelines [24,25]. The protocol was registered at ClinicalTrials.gov (identifier: NCT01608620).
Study Selection
MEDLINE, EMBASE, CINAHL, and The Cochrane Registry were searched through to February 5, 2014, using an inclusive search term (Supplementary Table 1). Manual searches of references supplemented database searches. Only prospective cohort studies reporting associations between total fructose-containing sugar (fructose, sucrose, and high-fructose corn syrup [HFCS]) intake on incident hypertension were eligible for inclusion.
Table 1. Trial Characteristics.
| Study* | Surjects† | Age ‡ | Country | Follow-Up (years) | Frequency of Data Collection§ | Method of Fructose Measure || | Method of Outcome Measure |
|---|---|---|---|---|---|---|---|
| HPFS | 37,375 M | 52 (44–61) | USA | 18 (1986–2004) | every 4 years | fructose intake as % total energy | self-reported physician diagnosed hypertension |
| NHS-I | 88,540 F | 49 (49–50) | USA | 20 (1984–2004) | every 4 years | fructose intake as % total energy | self-reported physician diagnosed hypertension |
| NHS-II |
97,315 F |
36 (32–40) |
USA |
14 (1991–2005) |
every 4 years |
fructose intake as % total energy |
self-reported physician diagnosed hypertension |
| Total Number of | Total | ||||||
| Quantile | Lowest | Highest | Hypertension | Person- | Quality Score | ||
| Divisions |
Quintile# |
Quintile# |
Cases** |
Years †† |
Adjustments |
‡‡ |
Funding Source§§ |
| quintiles | 5.7 (0.5 to 6.9) | 13.9 (12.2 to 36.2) | 11,192 | 426,063 | age, BMI, physical activity,smoking status, family history ofhypertension, total energy intake, intakes of alcohol, caffeine, folate, and vitamin C | 6 | Agency |
| quintiles | 6.0 (0.1 to 7.2) | 14.3 (12.7 to 37.8) | 31,107 | 990,646 | age, BMI, physical activity,smoking status, family history ofhypertension, total energy intake, intakes of alcohol, caffeine, folate, and vitamin C | 6 | Agency |
| quintiles | 5.7 (0.7 to 6.7) | 14.3 (12.2 to 45.9) | 15,863 | 1,085,648 | age, BMI, physical activity,smoking status, family history ofhypertension, total energy intake, intakes of alcohol, caffeine, folate, and vitamin C | 6 | Agency |
*HPFS: Health Professionals Follow-up Study; NHS-I: Nurses Health Study I; NHS-II: Nurses Health Study II.†M, male; F, female.‡Median age (interquartile range).§Dietary infonnation collected via a semiquantitative FFQ that inqured about average use of >130 foods/beverages during previous year.||The percentage of total caloric intake from fuctose was calculated as the percentage of caloric intake obtained from free fructose plus half the percentage of caloric intake.obtained from sucrose. Dietary fructose sources from foods and vegetables were also included in the calculation.#Quintiles calculated as % of total energy intake from fructose.**Calculated by adding number of cases through all quintiles.††Calculated by adding number of person-years through all quintiles.‡‡Quality score was assessed using the NewCastle-Ottawa Assessment Scale for Cohort Studies, where a maximum of 9 points can be awarded.§§Agency funding is that from government, university, or not-for-profit health agency.
Data Extraction
Following systematic exclusion of studies based on title and abstract (V.H.J., I.S.), 2 reviewers (V.H.J., V.H.) independently fully reviewed the remaining articles and produced a final list of cohorts to include in the analysis. A kappa (κ) score was calculated to quantify between-reviewer agreement (0 = complete disagreement, 1 = full agreement). All cohort characteristics were extracted using a standardized pro forma. Data extracted included authorship, publication year, cohort name, sample size, participant characteristics (age, gender, health status), fructose form (fruits/SSBs/supplement/sucrose), fructose exposure levels (as percentage of energy), duration/person-years of follow-up, number of cases, background diet profile, and covariates included in the most-adjusted models. Relative risks for incident hypertension were extracted from clinical event data across all quintiles of exposure.
Study Quality
Study quality was assessed using the Newcastle–Ottawa Scale (NOS) for Cohort Studies, awarding points based on cohort selection, adequacy of outcome measures, and comparability of cohorts regarding design or analysis [26]. A maximum of 9 points could be awarded, where 6 or more points was considered high quality [27,28].
Statistical Analyses
The natural log-transformed relative risks for incident hypertension, comparing the highest exposure level to the reference group from each cohort, were pooled using the generic inverse variance method with random effects models and expressed as risk ratios (RRs) with 95% confidence intervals (CIs). Interstudy heterogeneity was assessed using the Cochran Q (χ2) statistic at α < 0.10 and quantified by the I 2 statistic, where I 2 ≥ 50% represented considerable heterogeneity [23]. Sources of heterogeneity were explored using a priori subgroup analyses of disease status, gender (male vs female), sugar type (fructose, sucrose, HFCS), follow-up (<10 years vs ≥10 years), degree of covariate adjustment, and study quality (NOS <6 vs NOS ≥6) on the effect of total fructose-containing sugars. Dose–response analyses were carried out using random-effects generalized least squares trend (GLST) estimation models [29,30]. Where no evidence of a linear relationship was observed, spline curve modeling was undertaken (the MKSPLINE procedure) to characterize segments of the dose–response curve where a linear approximation may best describe the data [31]. Sensitivity analyses, where each study was systematically removed and the effect size recalculated in the remaining studies, were carried out to explore the impact of individual studies on the pooled risk. Publication bias was assessed by the inspection of funnel plots and statistically evaluated using Begg's and Egger's tests, where p < 0.10 was considered evidence of small-study effects. Pooled analyses were conducted using Review Manager (RevMan) version 5.1.7 (The Nordic Cochrane Centre, The Cochrane Collaboration, Copenhagen, Denmark). Meta-regressions, GLST, MKSPLINE, and Begg's and Egger's tests were conducted using Stata version 12.1 (StataCorp, College Station, TX).
RESULTS
Search Results
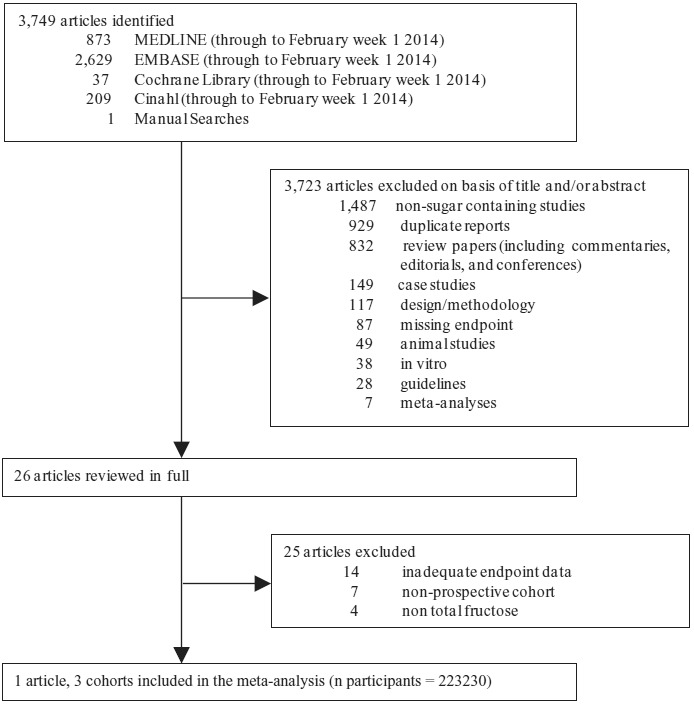
Figure 1 summarizes the flow of literature from conception to study selection. Three thousand seven hundred forty-nine articles were identified from database and manual searches. Of these, 3723 articles were excluded based on title and abstract. Of the remaining 26 articles, one article providing data on 3 prospective cohorts was identified (Health Professionals Follow-Up Study [HPFS], Nurses’ Health Study I [NHS-I], and Nurses’ Health Study II [NHS-II]) for meta-analyses [32]. A kappa statistic of 1 was calculated for between-reviewer agreement.
Fig. 1. Flow of the literature. Of the 3470 identified articles, 3444 were excluded based on title and abstract. The remaining 26 were reviewed in full. Three prospective cohorts were included in the meta-analysis.
Trial Characteristics
Cohort characteristics are provided in Table 1. The 3 prospective cohorts included a total of 223,230 participants, with a total 58,162 cases of hypertension observed over 2,502,375 person-years of follow up. One cohort followed men (HPFS, n = 37,375) with a median age of 52 years (range: 44–61), and the other 2 followed women. In the NHS-I (n = 88,540), the median age was 49 years (range: 44–56), whereas in the NHS-II (n = 97,315) the median age was 36 (range: 32–40). Median follow-up was 18 years (range: 14–20). Total fructose intake was assessed by validated food frequency questionnaires collected every 4 years [33–35], and incidence of hypertension (systolic ≥140 mmHg or diastolic ≥90 mmHg) was assessed from physician diagnoses that were self-reported on biennial questionnaires. All cohorts reported total fructose intake as a percentage of total daily energy intake (%E). At baseline, fructose from major fruit sources contributed 26.5, 23.6, and 19.8% of total fructose in HPFS, NHS-I, and NHS-II, respectively. Major SSBs and fruit juice sources contributed 35.2, 35.6, and 44.0% to total fructose intake, respectively. Median fructose intake in cohorts ranged from 5.7 to 6.0% of energy in the lowest (reference) quintile to 13.9–14.3% of energy in the highest quintile. All relative risks were adjusted for age, body mass index, physical activity, smoking status, family history of hypertension, total energy, alcohol, caffeine, folate, and vitamin C intakes. All cohorts were high quality (NOS = 6), and conducted in a U.S. population by the same Harvard University investigator group.
Total Fructose Intake on Incident Hypertension
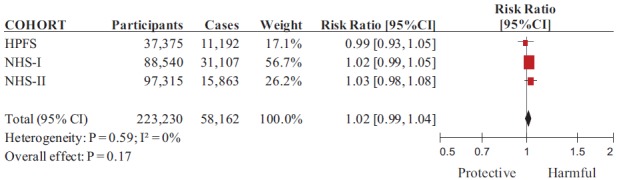
Figure 2 shows the overall association between total fructose intake and incidence of hypertension. The risk ratio for incident hypertension comparing the highest to the lowest quintile of intake was 1.02 (95% CI, 0.99–1.04, p = 0.18), with no evidence of between-cohort heterogeneity (I 2 = 0%; χ2 = 1.05, p = 0.59).
Fig. 2. Forest plot of prospective cohorts investigating the association between total fructose intake and incident hypertension. The pooled effect estimate is represented as a diamond. p Values are for generic inverse variance random effects models. Interstudy heterogeneity was assessed via Cochrane's Q (χ2) at a significance level of p < 0.10 and quantified by I 2, where I 2 > 50% was considered to be evidence of substantial heterogeneity. All data are presented as relative risks with 95% confidence intervals.(Color figure available online.).
A priori Subgroup and Sensitivity Analyses
Only one (gender) of the 6 a priori subgroup analyses was performed because the remaining 5 (disease status, sugar type, follow-up, degree of covariate adjustment, and study quality) did not vary across cohorts. The subgroup analysis by gender did not modify our results (male: RR = 0.99, 95% CI, 0.93–1.05; female: RR = 1.02, 95% CI, 1.00–1.05; p difference = 0.51). Removal of no single cohort modified the overall relationship (without HPFS: RR = 1.02; 95% CI, 1.00–1.05; p = 0.10; without NHS-I: RR = 1.01, 95% CI, 0.98–1.05; p = 0.47; without NHS-II: RR = 1.01, 95% CI, 0.98–1.04; p = 0.41).
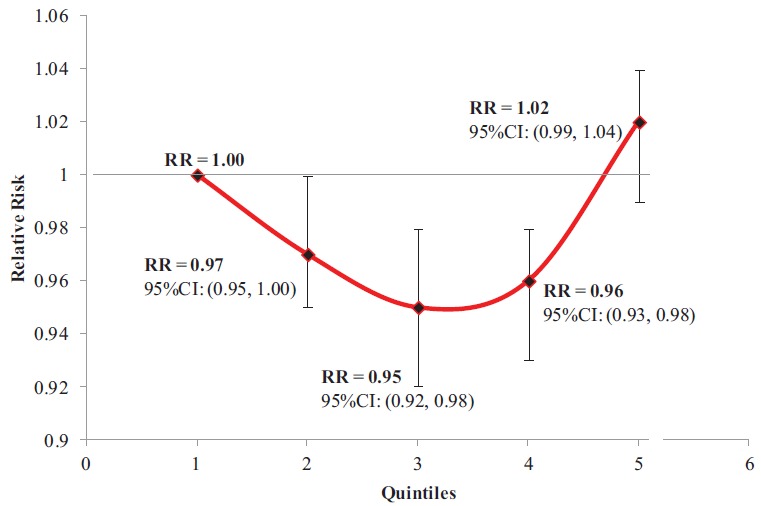
A random-effects GLST model provided no significant evidence of a linear dose–response relationship across quantiles (p = 0.99). However, separate analyses pooling data at each quantile found a significant protective association of fructose intakes at the third (9.5%E, RR = 0.95, 95% CI, 0.92–0.98, p = 0.0004) and fourth (11.2%E, RR = 0.93, 95% CI, 0.93–0.98, p = 0.001) quantiles, and a borderline significant protective association at intakes equivalent to the second quantile (7.9%E, RR = 0.97, 95% CI, 0.95–1.00, p = 0.05; Fig. 3). Using spline modelling to address this nonlinearity, we detected a breakpoint at the 50th percentile of intake (∼10%E, third quintile) [22], which revealed a borderline significant negative linear relationship for intakes at or below the 50th percentile intake (β = −0.005, p = 0.050) and a significant positive linear relationship for intakes above the 50th percentile intake (β = 0.021, p < 0.001). The risk of developing hypertension decreased 0.5% (p = 0.050) for every 1%E increase in fructose intake, when consumed at intakes from 5.9 to 9.4% total energy, whereas it increased 2.1% (p < 0.001) for every 1%E increase in fructose intake at intakes from 9.4 to 14.2% total energy, although the maximal risk achieved did not exceed that of the lowest intake.
Fig. 3. Incident hypertension across pooled quintiles of increasing fructose intake. The x-axis represents quintiles; the y-axis represents relative risk. Each point represents a meta-analyzed relative risk of data from all cohorts across each respective quintile, compared to the reference quintile. The vertical line represents each relative risk's respective 95% confidence interval.(Color figure available online.).
Publication Bias
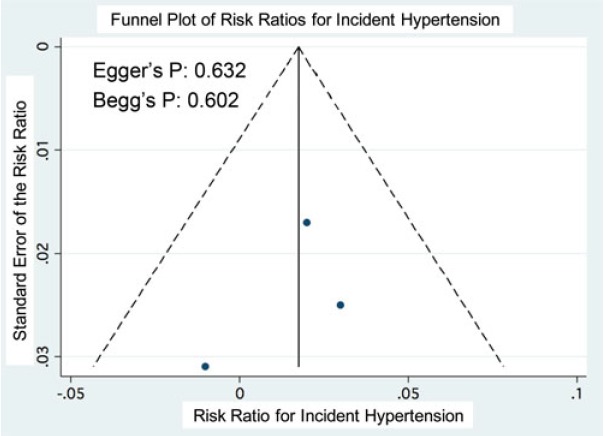
Visual inspection of funnel plots and statistical assessment through Egger's (p = 0.632) and Begg's (p = 0.602) tests did not reveal significant evidence for publication bias (Supplementary Fig. 1).
Supplementary Fig. 1. Funnel plot of risk ratios for incident hypertension comparing the lowest with the highest quintiles for fructose intake. The vertical line represents the pooled relative risk. The dashed lines represent the pseudo-95% confidence intervals of the relative risk. The circles represent risk estimates for each cohort, and the horizontal lines represent standard errors of the relative risk.
DISCUSSION
This systematic review and meta-analysis of 3 large cohorts in 37,375 men and 185,855 women, providing a total 2,502,357 person-years of follow-up and 58,162 cases of incident hypertension, found no association between fructose intake and incident hypertension, where fructose constituted up to 14% of the total energy intake, equivalent to the 90th percentile intake in the United States [22]. The relation was not modified by differences in gender, nor did we find significant evidence for a dose response. There may be a potential hypertension risk reduction with fructose intakes at the 50th percentile.
Findings in the Context of the Literature
Our results agree with high-quality clinical trials evidence [20] showing no adverse relationship between fructose and blood pressure under isocaloric conditions. These results do not support the uric acid mechanism by which fructose is proposed to elevate blood pressure [8,9], contradicting evidence from animal studies [10–15] using supraphysiological fructose doses [22], cross-sectional and prospective cohort studies of sugary beverages (not total fructose) [36,37], and acute [38] or uncontrolled trials in humans [16]. The lack of agreement may relate to the level of exposure assessed in the present set of studies. Interestingly, the same cohorts have shown linear associations between total fructose intake and uric acid [39] and total fructose intake and incident gout [40]. However, significant associations were seen only at high levels of exposure above mean population levels of intake [22] in models not adjusted for energy [41] or in energy-adjusted models that were also adjusted for energy from total carbohydrates, to estimate the effect of total fructose in isocaloric exchange with other carbohydrates [40]. Higher quality evidence from a systematic review and meta-analysis of controlled feeding trials [21] also only showed a significant effect of fructose on uric acid in hypercaloric trials. In these trials, diets were supplemented with fructose providing excess energy at extreme levels of intake above that associated with raised uric acid levels and gout in the NHS and HPFS [39,40] and more than double the 95th percentile for intake in the United States [22] compared to the same diets alone without the excess energy from fructose. Taken together, these data bring into question whether a fructose–uric acid–blood pressure axis operates at population levels of exposure or under conditions of neutral energy balance [32,42].
Similarly, fructose has not been shown to behave differently than other sources of carbohydrate in its effects on other related metabolic endpoints. A recent series of systematic reviews and meta-analyses of controlled clinical trials on the effect of fructose on cardiometabolic risk factors showed that isocaloric substitution of fructose for other sources of carbohydrate did not differentially effect body weight [43], blood lipids [44], glycemia [45], or insulin [46]. These same analyses even showed a clinically meaningful improvement in glycemic control [46]. Our results agree with these findings, suggesting that there is no evidence of harm of fructose under energy-adjusted conditions, as modeled by this meta-analysis. Each included study used the multivariate nutrient density model, in which total energy was included in the model along with percentage energy from fructose; therefore, our pooled relative risk represents the association of fructose with hypertension, holding energy constant; that is, isocaloric [47]. Nevertheless, diets supplemented with fructose providing excess energy at extreme doses well above the 95th percentile for intake did increase body weight [43], uric acid [21], glycemia [46], and insulin [45] compared to the same diets alone without the excess energy from fructose. These hypercaloric data may be more relevant to the general population, however, because the high rates of overweight and obesity suggest most individuals to be in positive energy balance. In addition, fructose-containing sugars, when consumed in the form of sugary beverages, appear to aggravate the risk for several chronic diseases including hypertension, type 2 diabetes, cardiovascular disease, and stroke, although the reasons for this remain unclear [48].
Subgroup Analyses and Dose Effects
We observed no between-cohort heterogeneity, likely because all 3 cohorts were centered at the same academic institution and used similarly validated measurement tools and standardized outcome assessment protocols in relatively homogenous cohorts. This overlap in potential sources of clinical and methodological heterogeneity between cohorts precluded most a priori subgroup analyses. In addition, due to the small number of identified cohorts, we may have been underpowered to detect true differences between subgroups (i.e., gender). Spline curve modeling revealed a significant linear relationship for increasing risk with fructose consumption above the U.S. 50th percentile intake (49 g/d or 10%E) [22]. Although no significant adverse relationship was observed, the potential of increasing hypertension risk with intakes beyond 15%E from fructose warrants further investigation. In addition, a small but significant hypertension risk reduction was observed at intakes ranging from 40 g/d up to 55 g/d. Although this evidence is largely exploratory due to the nature of the analysis, it nevertheless supports a clear of a lack of harm. Appropriately, the possibility of a beneficial relationship of moderate fructose intakes cannot be excluded [49] and should be further investigated.
Limitations
Several limitations of this systematic review and meta-analysis should be outlined. First, the only cohorts that fit our inclusion criteria were of U.S. origin with predominantly Caucasian (≤90%) populations [36], limiting the generalizability of these results. Second, all participants in this meta-analysis were health care professionals; thus, the influences of socioeconomic status and level of education [50] may complicate these results. Third, because no cohorts of adolescents or children were captured in this meta-analysis, whose fructose intakes are above that of adults [22], the extrapolation of these findings to those subpopulations is limited. Fourth, at baseline, at least 35 to 44% of the total fructose in these cohorts were from SSB sources, which approximates the 46% observed in the most recent National Health and Nutrition Examination Survey dietary intake data [22]. However, the intake of fructose from fruit and grain sources of these cohorts was higher than the National Health and Nutrition Examination Survey intake data [22], potentially obscuring the applicability of our results.
CONCLUSIONS
Fructose has been in the limelight of scientific controversy ever since its implication in the obesity epidemic [51]. Our analysis of fructose at population-level intakes questions its previously hypothesized role in the development of hypertension [7]. When total energy was accounted for, we found no adverse association between population-level fructose intake from a variety of sources and incident hypertension in primarily Caucasian U.S. male and female health professionals, with no history of hypertension. This association appears to be generalizable to population intake patterns. To test the robustness of our findings, there is a need for more specific analyses within existing cohorts to assess the relation of total fructose and fructose-containing sugars (sucrose, HFCS) from different sources with the risk of developing hypertension in different populations. Given that the current analysis presented a signal for benefit with fructose intakes approximating 10%E, it may be of interest to explore the potential beneficial effects of fructose intakes equivalent to the U.S. 50th percentile intake through large-scale, randomized, double-blind controlled clinical trials.
FUNDING
This work was funded by an unrestricted research grant from the Calorie Control Council and the Canadian Institutes of Health Research (CIHR) through the Canada-Wide Human NutritionTrialists' Network (NTN) (funding reference number, 129920). R.J.deS. was funded by a CIHR Postdoctoral Fellowship Award. V.H. was funded by an Ontario Graduate Scholar (OGS) award. A.M. was funded by a CIHR Canada Graduate Scholarship Master's award. D.J.A.J. was funded by the government of Canada through the Canada Research Chair Endowment. None of the sponsors had a role in any aspect of the present study, including design and conduct of the study; collection, management, analysis, and interpretation of the data; and preparation, review, or approval of the article.
COMPETING INTERESTS
J.L.S. has received research support from the Canadian Institutes of health Research (CIHR), Calorie Control Council, The Coca-Cola Company (investigator initiated, unrestricted grant), Pulse Canada, and The International Tree Nut Council Nutrition Research & Education Foundation. He has received travel funding, speaker fees, and/or honoraria from the American Heart Association (AHA), American College of Physicians (ACP), American Society of Nutrition (ASN), Canadian Nutrition Society (CNS), National Institute of Diabetes and Digestive and Kidney Diseases (NIDDK) of the National Institutes of Health (NIH), Canadian Diabetes Association (CDA), Calorie Control Council, Diabetes and Nutrition Study Group (DNSG) of the European Association for the Study of Diabetes (EASD), International Life Sciences Institute (ILSI) North America, ILSI Brazil, University of South Carolina, University of Alabama at Birmingham, Oldways Preservation Trust, Nutrition Foundation of Italy (NFI), Abbott Laboratories, Pulse Canada, Canadian Sugar Institute, Dr. Pepper Snapple Group, The Coca-Cola Company, and Corn Refiners Association. He is on the Clinical Practice Guidelines Expert Committee for Nutrition Therapy of both the CDA and EASD, as well as the ASN writing panel for a scientific statement on the metabolic and nutritional effects of fructose, sucrose, and high-fructose corn syrup. He is a member of the International Carbohydrate Quality Consortium (ICQC) and Board Member of the DNSG of the EASD. His wife is an employee of Unilever Canada. R.J.deS. is funded by a CIHR Postdoctoral Fellowship Award and has received research support from the CIHR, the Calorie Control Council, the Canadian Foundation for Dietetic Research and the Coca-Cola Company (investigator initiated, unrestricted grant). He has served as an external resource person to WHO's Nutrition Guidelines Advisory Group and received travel support from WHO to attend group meetings. He is the lead author of 2 systematic reviews and meta-analyses commissioned by WHO of the relation of saturated fatty acids and trans fatty acids with health outcomes. J.B. has received research support from the CIHR, Calorie Control Council, and The Coca-Cola Company (investigator initiated, unrestricted). A.M. has received research support from the CIHR. V.H. has received a Province of Ontario Graduate Scholarship and research support from the CIHR and payment from the World Health Organization (WHO) for work on a systematic review and meta-analysis commissioned by the WHO of the relation of saturated fatty acids with health outcomes. She also received a travel award to attend the “Journey Through Science Day” hosted by PepsiCo and the New York Academy of Sciences (NYAS). A.L.J. is a part owner, Vice President, and Director of Research of Glycemic Index Laboratories, Toronto, Canada. She has received research support from the CDA. T.M.S.W. is a part owner and the President of Glycemic Index Laboratories, Toronto, Canada, and has authored several popular diet books on the glycemic index for which he has received royalties from Phillipa Sandall Publishing Services and CABI Publishers. He has received consultant fees, honoraria, travel funding, or research support from or served on the scientific advisory board for CIHR, CDA Dairy Farmers of Canada, McCain Foods, Temasek Polytechnic, Northwestern University, Royal Society of London, Glycemic Index Symbol program, CreaNutrition AG, McMaster University, Canadian Society for Nutritional Sciences, National Sports and Conditioning Association, Faculty of Public Health and Nutrition—Autonomous University of Nuevo Leon, Diabetes and Nutrition Study Group of the European Association for the Study of Diabetes. C.W.C.K. has received research support from the Advanced Foods and Material Network, Agrifoods and Agriculture Canada, the Almond Board of California, the American Pistachio Growers, Barilla, the California Strawberry Commission, the Calorie Control Council, CIHR, the Canola Council of Canada, the Coca-Cola Company (investigator initiated, unrestricted grant), Hain Celestial, the International Tree Nut Council Nutrition Research and Education Foundation, Kellogg, Kraft, Loblaw Companies Ltd., Orafti, Pulse Canada, Saskatchewan Pulse Growers, Solae and Unilever. He has received travel funding, consultant fees or honoraria from Abbott Laboratories, the Almond Board of California, the American Peanut Council, the American Pistachio Growers, Barilla, Bayer, the Canola Council of Canada, the Coca-Cola Company, Danone, General Mills, the International Tree Nut Council Nutrition Research and Education Foundation, Kellogg, Loblaw Companies Ltd., NFI, Oldways Preservation Trust, Orafti, Paramount Farms, the Peanut Institute, PepsiCo, Pulse Canada, Sabra Dipping Co., Saskatchewan Pulse Growers, Solae, Sun-Maid, Tate and Lyle, and Unilever. He is on the Dietary Guidelines Committee for the DNSG of the EASD and has served on the scientific advisory board for the Almond Board of California, the International Tree Nut Council, Oldways Preservation Trust, Paramount Farms and Pulse Canada. He is a member of the ICQC and Board Member of the DNSG of the EASD. D.J.A.J. has received research grants from Saskatchewan Pulse Growers, the Agricultural Bioproducts Innovation Program through the Pulse Research Network, the Advanced Foods and Material Network, Loblaw Companies Ltd., Unilever, Barilla, the Almond Board of California, the Coca-Cola Company (investigator initiated, unrestricted grant), Solae, Haine Celestial, the Sanitarium Company, Orafti, the International Tree Nut Council Nutrition Research and Education Foundation, the Peanut Institute, the Canola and Flax Councils of Canada, the Calorie Control Council, the CIHR, the Canada Foundation for Innovation and the Ontario Research Fund. He has been on the speaker's panel, served on the scientific advisory board and/or received travel support and/or honoraria from the Almond Board of California, Canadian Agriculture Policy Institute, Loblaw Companies Ltd, the Griffin Hospital (for the development of the NuVal scoring system, the Coca-Cola Company, Saskatchewan Pulse Growers, Sanitarium Company, Orafti, the Almond Board of California, the American Peanut Council, the International Tree Nut Council Nutrition Research and Education Foundation, the Peanut Institute, Herbalife International, Pacific Health Laboratories, Nutritional Fundamental for Health, Barilla, Metagenics, Bayer Consumer Care, Unilever Canada and Netherlands, Solae, Kellogg, Quaker Oats, Procter & Gamble, the Coca-Cola Company, the Griffin Hospital, Abbott Laboratories, the Canola Council of Canada, Dean Foods, the California Strawberry Commission, Haine Celestial, PepsiCo, the Alpro Foundation, Pioneer Hi-Bred International, DuPont Nutrition and Health, Spherix Consulting and WhiteWave Foods, the Advanced Foods and Material Network, the Canola and Flax Councils of Canada, the Nutritional Fundamentals for Health, Agri-Culture and Agri-Food Canada, the Canadian Agri-Food Policy Institute, Pulse Canada, the Saskatchewan Pulse Growers, the Soy Foods Association of North America, the Nutrition Foundation of Italy (NFI), Nutra-Source Diagnostics, the McDougall Program, the Toronto Knowledge Translation Group (St. Michael's Hospital), the Canadian College of Naturopathic Medicine, The Hospital for Sick Children, the Canadian Nutrition Society (CNS), the American Society of Nutrition (ASN), Arizona State University, Paolo Sorbini Foundation and the Institute of Nutrition, Metabolism and Diabetes. He received an honorarium from the US Department of Agriculture to present the 2013 W.O. Atwater Memorial Lecture. He received the 2013 Award for Excellence in Research from the International Nut and Dried Fruit Council. He received funding and travel support from the Canadian Society of Endocrinology and Metabolism to produce mini cases for the Canadian Diabetes Association. He is a member of the ICQC. His wife is a director and partner of Glycemic Index Laboratories, and his sister received funding through a grant from the St. Michael's Hospital Foundation to develop a cookbook for one of his studies. V.H.J., S.B.M., M.D., and L.A.L. have no declared conflicts of interest related to this paper.
SUPPLEMENTARY TABLES AND FIGURES
Supplementary Table 1. Databases Searched and Strategy
| Database | Search Period | Search |
|---|---|---|
| MEDLINE |
Through to February week 1, 2014 |
1. sucrose*.mp. 2. fructose*.mp. 3. HFCS*.mp. 4. honey*.mp. 5. sugar*.mp. 6. hypertensive.mp. 7. hypertension.mp. 8. HTN.mp. 9. 1 or 2 or 3 or 4 or 5 10. 6 or 7 or 8 11. 9 and 10 12. limit 11 to animals 13. 11 not 12 14. limit 13 to animal studies 15. 13 not 14 16. limit 15 to (clinical trial or randomized controlled trial or controlled clinical trial or multicenter study or phase 1 clinical trial or phase 2 clinical trial or phase 3 clinical trial or phase 4 clinical trial) 17. 15 not 16 |
| EMBASE |
Through to February week 1, 2014 |
1. sucrose*.mp. 2. fructose*.mp. 3. HFCS*.mp. 4. honey*.mp. 5. sugar*.mp. 6. hypertensive.mp. 7. hypertension.mp. 8. HTN.mp. 9. 1 or 2 or 3 or 4 or 5 10. 6 or 7 or 8 11. 9 and 10 12. limit 11 to animals 13. 11 not 12 14. limit 13 to animal studies 15. 13 not 14 16. limit 15 to (clinical trial or randomized controlled trial or controlled clinical trial or multicenter study or phase 1 clinical trial or phase 2 clinical trial or phase 3 clinical trial or phase 4 clinical trial) 17. 15 not 16 |
| CINAHL |
Through to February week 1, 2014 |
1. “sucrose” 2. “fructose” 3. “HFCS” 4. “honey” 5. “sugar” 6. “hypertensive” 7. “hypertension” 8. “HTN” 9. “S1 or S2 or S3 or S4 or S5” 10. “S6 or S7 or S8” 11. “S9 and S10” |
| COCHRANE | Through to February week 1, 2014. | 1. “sucrose” 2. “fructose” 3. “HFCS” 4. “honey” 5. “sugar” 6. “hypertensive” 7. “hypertension” 8. “HTN” 9. “S1 or S2 or S3 or S4 or S5” 10. “S6 or S7 or S8” 11. “S9 and S10” |
REFERENCES
- World Health Organization . Global Health Risks: Mortality and Burden of Disease Attributable to Selected Major Risks. Geneva: World Health Organization; 2009. [Google Scholar]
- Tu K. Chen Z. Lipscombe LL. Prevalence and incidence of hypertension from 1995 to 2005: a population-based study. CMAJ. 2008;178:1429–1435. doi: 10.1503/cmaj.071283. [DOI] [PMC free article] [PubMed] [Google Scholar]
- Chobanian AV. Bakris GL. Black HR. Cushman WC. Green LA. Izzo JL. Jones DW. Materson BJ. Oparil S. Wright JT. Roccella EJ. The Seventh Report of the Joint National Committee on Prevention, Detection, Evaluation, and Treatment of High Blood Pressure: the JNC 7 report. JAMA. 2003;289:2560–2572. doi: 10.1001/jama.289.19.2560. [DOI] [PubMed] [Google Scholar]
- Lawes CM. Vander Hoorn S. Law MR. Elliott P. MacMahon S. Rodgers A. Blood pressure and the global burden of disease 2000. Part II: estimates of attributable burden. J Hypertens. 2006;24:423–430. doi: 10.1097/01.hjh.0000209973.67746.f0. [DOI] [PubMed] [Google Scholar]
- Daskalopoulou SS. Khan NA. Quinn RR. Ruzicka M. McKay DW. Hackam DG. Rabkin SW. Rabi DM. Gilbert RE. Padwal RS. Dawes M. Touyz RM. Campbell TS. Cloutier L. Grover S. Honos G. Herman RJ. Schiffrin EL. Bolli P. Wilson T. Feldman RD. Lindsay MP. Hemmelgarn BR. Hill MD. Gelfer M. Burns KD. Vallee M. Prasad GV. Lebel M. McLean D. Arnold JM. Moe GW. Howlett JG. Boulanger JM. Larochelle P. Leiter LA. Jones C. Ogilvie RI. Woo V. Kaczorowski J. Trudeau L. Bacon SL. Petrella RJ. Milot A. Stone JA. Drouin D. Lamarre-Cliche M. Godwin M. Tremblay G. Hamet P. Fodor G. Carruthers SG. Pylypchuk G. Burgess E. Lewanczuk R. Dresser GK. Penner B. Hegele RA. McFarlane PA. Sharma M. Campbell NR. Reid D. Poirier L. Tobe SW. The 2012 Canadian hypertension education program recommendations for the management of hypertension: blood pressure measurement, diagnosis, assessment of risk, and therapy. Can J Cardiol. 2012;28:270–287. doi: 10.1016/j.cjca.2012.02.018. [DOI] [PubMed] [Google Scholar]
- Johnson RK. Appel LJ. Brands M. Howard BV. Lefevre M. Lustig RH. Sacks F. Steffen LM. Wylie-Rosett J. Dietary sugars intake and cardiovascular health: a scientific statement from the American Heart Association. Circulation. 2009;120:1011–1020. doi: 10.1161/CIRCULATIONAHA.109.192627. [DOI] [PubMed] [Google Scholar]
- Johnson RJ. Segal MS. Sautin Y. Nakagawa T. Feig DI. Kang DH. Gersch MS. Benner S. Sanchez-Lozada LG. Potential role of sugar (fructose) in the epidemic of hypertension, obesity and the metabolic syndrome, diabetes, kidney disease, and cardiovascular disease. Am J Clin Nutr. 2007;86:899–906. doi: 10.1093/ajcn/86.4.899. [DOI] [PubMed] [Google Scholar]
- Lustig RH. Schmidt LA. Brindis CD. Public health: The toxic truth about sugar. Nature. 2012;482:27–29. doi: 10.1038/482027a. [DOI] [PubMed] [Google Scholar]
- Johnson RJ. Sanchez-Lozada LG. Nakagawa T. The effect of fructose on renal biology and disease. J Am Soc Nephrol. 2010;21:2036–2039. doi: 10.1681/ASN.2010050506. [DOI] [PubMed] [Google Scholar]
- Hwang IS. Ho H. Hoffman BB. Reaven GM. Fructose-induced insulin resistance and hypertension in rats. Hypertension. 1987;10:512–516. doi: 10.1161/01.hyp.10.5.512. [DOI] [PubMed] [Google Scholar]
- Elliott SS. Keim NL. Stern JS. Teff K. Havel PJ. Fructose, weight gain, and the insulin resistance syndrome. Am J Clin Nutr. 2002;76:911–922. doi: 10.1093/ajcn/76.5.911. [DOI] [PubMed] [Google Scholar]
- Vasdev S. Prabhakaran VM. Whelan M. Ford CA. Longerich L. Parai S. Fructose-induced hypertension, hypertriglyceridemia and elevated cytosolic calcium in rats: prevention by deuterium oxide. Artery. 1994;21:124–147. [PubMed] [Google Scholar]
- Dai S. McNeill JH. Fructose-induced hypertension in rats is concentration- and duration-dependent. J Pharmacol Toxicol Methods. 1995;33:101–107. doi: 10.1016/1056-8719(94)00063-a. [DOI] [PubMed] [Google Scholar]
- Catena C. Cavarape A. Novello M. Giacchetti G. Sechi LA. Insulin receptors and renal sodium handling in hypertensive fructose-fed rats. Kidney Int. 2003;64:2163–2171. doi: 10.1046/j.1523-1755.2003.00313.x. [DOI] [PubMed] [Google Scholar]
- Martinez FJ. Rizza RA. Romero JC. High-fructose feeding elicits insulin resistance, hyperinsulinism, and hypertension in normal mongrel dogs. Hypertension. 1994;23:456–463. doi: 10.1161/01.hyp.23.4.456. [DOI] [PubMed] [Google Scholar]
- Perez-Pozo SE. Schold J. Nakagawa T. Sanchez-Lozada LG. Johnson RJ. Lillo JL. Excessive fructose intake induces the features of metabolic syndrome in healthy adult men: role of uric acid in the hypertensive response. Int J Obes (Lond) 2010;34:454–461. doi: 10.1038/ijo.2009.259. [DOI] [PubMed] [Google Scholar]
- Jalal DI. Smits G. Johnson RJ. Chonchol M. Increased fructose associates with elevated blood pressure. J Am Soc Nephrol. 2010;21:1543–1549. doi: 10.1681/ASN.2009111111. [DOI] [PMC free article] [PubMed] [Google Scholar]
- Chen L. Caballero B. Mitchell DC. Loria C. Lin PH. Champagne CM. Elmer PJ. Ard JD. Batch BC. Anderson CA. Appel LJ. Reducing consumption of sugar-sweetened beverages is associated with reduced blood pressure: a prospective study among United States adults. Circulation. 2010;121:2398–2406. doi: 10.1161/CIRCULATIONAHA.109.911164. [DOI] [PMC free article] [PubMed] [Google Scholar]
- Nguyen S. Choi HK. Lustig RH. Hsu CY. Sugar-sweetened beverages, serum uric acid, and blood pressure in adolescents. J Pediatr. 2009;154:807–813. doi: 10.1016/j.jpeds.2009.01.015. [DOI] [PMC free article] [PubMed] [Google Scholar]
- Ha V. Sievenpiper JL. de Souza RJ. Chiavaroli L. Wang DD. Cozma AI. Mirrahimi A. Yu ME. Carleton AJ. Dibuono M. Jenkins AL. Leiter LA. Wolever TM. Beyene J. Kendall CW. Jenkins DJ. Effect of fructose on blood pressure: a systematic review and meta-analysis of controlled feeding trials. Hypertension. 2012;59:787–795. doi: 10.1161/HYPERTENSIONAHA.111.182311. [DOI] [PubMed] [Google Scholar]
- Wang DD. Sievenpiper JL. de Souza RJ. Chiavaroli L. Ha V. Cozma AI. Mirrahimi A. Yu ME. Carleton AJ. Dibuono M. Jenkins AL. Leiter LA. Wolever TM. Beyene J. Kendall CW. Jenkins DJ. The effects of fructose intake on serum uric acid vary among controlled dietary trials. J Nutr. 2012;142:916–923. doi: 10.3945/jn.111.151951. [DOI] [PMC free article] [PubMed] [Google Scholar]
- Marriott BP. Cole N. Lee E. National estimates of dietary fructose intake increased from 1977 to 2004 in the United States. J Nutr. 2009;139:1228S–1235S. doi: 10.3945/jn.108.098277. [DOI] [PubMed] [Google Scholar]
- Higgins JPT. Green S. Cochrane Collaboration . Cochrane Handbook for Systematic Reviews of Interventions.” Cochrane Book Series. Chichester, England: Wiley-Blackwell; 2008. [Google Scholar]
- Stroup DF. Berlin JA. Morton SC. Olkin I. Williamson GD. Rennie D. Moher D. Becker BJ. Sipe TA. Thacker SB. Meta-analysis of observational studies in epidemiology: a proposal for reporting. Meta-analysis of Observational Studies in Epidemiology (MOOSE) group. JAMA. 2000;283:2008–2012. doi: 10.1001/jama.283.15.2008. [DOI] [PubMed] [Google Scholar]
- Moher D. Liberati A. Tetzlaff J. Altman DG. The PRISMA Group Preferred Reporting Items for Systematic Reviews and Meta-Analyses: The PRISMA Statement. PloS Medicine. 2009;6 http://www.plosmedicine.org/article/fetchObject.action?uri=info%3Adoi%2F10.1371%2Fjournal.pmed.1000097&representation=PDF. [PMC free article] [PubMed] [Google Scholar]
- Wells GA. Shea B. O’Connell D. Peterson J. Welch V. Losos M. Tugwell P. The Newcastle–Ottawa Scale (NOS) for assessing the quality of nonrandomised studies in meta-analyses. 2000 http://www.ohri.ca/programs/clinical_epidemiology/oxford.asp. [Google Scholar]
- Stevens RD. Dowdy DW. Michaels RK. Mendez-Tellez PA. Pronovost PJ. Needham DM. Neuromuscular dysfunction acquired in critical illness: a systematic review. Intensive Care Med. 2007;33:1876–1891. doi: 10.1007/s00134-007-0772-2. [DOI] [PubMed] [Google Scholar]
- Henderson A. Korner-Bitensky N. Levin M. Virtual reality in stroke rehabilitation: a systematic review of its effectiveness for upper limb motor recovery. Top Stroke Rehabil. 2007;14:52–61. doi: 10.1310/tsr1402-52. [DOI] [PubMed] [Google Scholar]
- Orsini N. Belloco R. Greenland S. Generalized least squares for trend estimation. Stata J. 2006;6:40–57. [Google Scholar]
- Greenland S. Longnecker MP. Methods for trend estimation from summarized dose–response data, with applications to meta-analysis. Am J Epidemiol. 1992;135:1301–1309. doi: 10.1093/oxfordjournals.aje.a116237. [DOI] [PubMed] [Google Scholar]
- StataCorp LP. mkspline—Linear and restricted cubic spline construction. StataCorp LP [Google Scholar]
- Forman JP. Choi H. Curhan GC. Fructose and vitamin C intake do not influence risk for developing hypertension. J Am Soc Nephrol. 2009;20:863–871. doi: 10.1681/ASN.2008050473. [DOI] [PMC free article] [PubMed] [Google Scholar]
- Feskanich D. Rimm EB. Giovannucci EL. Colditz GA. Stampfer MJ. Litin LB. Willett WC. Reproducibility and validity of food intake measurements from a semiquantitative food frequency questionnaire. J Am Diet Assoc. 1993;93:790–796. doi: 10.1016/0002-8223(93)91754-e. [DOI] [PubMed] [Google Scholar]
- Rimm EB. Giovannucci EL. Stampfer MJ. Colditz GA. Litin LB. Willett WC. Reproducibility and validity of an expanded self-administered semiquantitative food frequency questionnaire among male health professionals. Am J Epidemiol. 1992;135:1127–1136. doi: 10.1093/oxfordjournals.aje.a116211. 1114–1126; discussion. [DOI] [PubMed] [Google Scholar]
- Willett WC. Sampson L. Stampfer MJ. Rosner B. Bain C. Witschi J. Hennekens CH. Speizer FE. Reproducibility and validity of a semiquantitative food frequency questionnaire. Am J Epidemiol. 1985;122:51–65. doi: 10.1093/oxfordjournals.aje.a114086. [DOI] [PubMed] [Google Scholar]
- Cohen L. Curhan G. Forman J. Association of sweetened beverage intake with incident hypertension. J Gen Intern Med. 2012;27:1127–1134. doi: 10.1007/s11606-012-2069-6. [DOI] [PMC free article] [PubMed] [Google Scholar]
- Winkelmayer WC. Stampfer MJ. Willett WC. Curhan GC. Habitual caffeine intake and the risk of hypertension in women. JAMA. 2005;294:2330–2335. doi: 10.1001/jama.294.18.2330. [DOI] [PubMed] [Google Scholar]
- Brown CM. Dulloo AG. Yepuri G. Montani JP. Fructose ingestion acutely elevates blood pressure in healthy young humans. Am J Physiol Regul Integr Comp Physiol. 2008;294:R730–R737. doi: 10.1152/ajpregu.00680.2007. [DOI] [PubMed] [Google Scholar]
- Gao X. Chen H. Choi HK. Curhan G. Schwarzschild MA. Ascherio A. Diet, urate, and Parkinson's disease risk in men. Am J Epidemiol. 2008;167:831–838. doi: 10.1093/aje/kwm385. [DOI] [PMC free article] [PubMed] [Google Scholar]
- Choi HK. Curhan G. Soft drinks, fructose consumption, and the risk of gout in men: prospective cohort study. BMJ. 2008;336:309–312. doi: 10.1136/bmj.39449.819271.BE. [DOI] [PMC free article] [PubMed] [Google Scholar]
- Sun SZ. Flickinger BD. Williamson-Hughes PS. Empie MW. Lack of association between dietary fructose and hyperuricemia risk in adults. Nutr Metab (Lond) 2010;7:16. doi: 10.1186/1743-7075-7-16. http://www.nutritionandmetabolism.com/content/pdf/1743-7075-7-16.pdf. [DOI] [PMC free article] [PubMed] [Google Scholar]
- Sievenpiper JL. de Souza RJ. Kendall CW. Jenkins DJ. Is fructose a story of mice but not men? J Am Diet Assoc. 2011;111:220–212. doi: 10.1016/j.jada.2010.12.001. 219–220; author reply. [DOI] [PubMed] [Google Scholar]
- Sievenpiper JL. de Souza RJ. Mirrahimi A. Yu ME. Carleton AJ. Beyene J. Chiavaroli L. Di Buono M. Jenkins AL. Leiter LA. Wolever TM. Kendall CW. Jenkins DJ. Effect of fructose on body weight in controlled feeding trials: a systematic review and meta-analysis. Ann Intern Med. 2012;156:291–304. doi: 10.7326/0003-4819-156-4-201202210-00007. [DOI] [PubMed] [Google Scholar]
- Sievenpiper JL. Carleton AJ. Chatha S. Jiang HY. de Souza RJ. Beyene J. Kendall CW. Jenkins DJ. Heterogeneous effects of fructose on blood lipids in individuals with type 2 diabetes: systematic review and meta-analysis of experimental trials in humans. Diabetes Care. 2009;32:1930–1937. doi: 10.2337/dc09-0619. [DOI] [PMC free article] [PubMed] [Google Scholar]
- Cozma AI. Sievenpiper JL. de Souza RJ. Chiavaroli L. Ha V. Wang DD. Mirrahimi A. Yu ME. Carleton AJ. Di Buono M. Jenkins AL. Leiter LA. Wolever TM. Beyene J. Kendall CW. Jenkins DJ. Effect of fructose on glycemic control in diabetes: a systematic review and meta-analysis of controlled feeding trials. Diabetes Care. 2012;35:1611–1620. doi: 10.2337/dc12-0073. [DOI] [PMC free article] [PubMed] [Google Scholar]
- Sievenpiper JL. Chiavaroli L. de Souza RJ. Mirrahimi A. Cozma AI. Ha V. Wang DD. Yu ME. Carleton AJ. Beyene J. Di Buono M. Jenkins AL. Leiter LA. Wolever TM. Kendall CW. Jenkins DJ. “Catalytic” doses of fructose may benefit glycaemic control without harming cardiometabolic risk factors: a small meta-analysis of randomised controlled feeding trials. Br J Nutr. 2012;108:418–423. doi: 10.1017/S000711451200013X. [DOI] [PMC free article] [PubMed] [Google Scholar]
- Willett W. Nutritional epidemiology. New York: Oxford University Press; 1998. [Google Scholar]
- Sievenpiper JL. de Souza RJ. Are sugar-sweetened beverages the whole story? Am J Clin Nutr. 2013;98:261–263. doi: 10.3945/ajcn.113.067215. [DOI] [PubMed] [Google Scholar]
- Madero M. Arriaga JC. Jalal D. Rivard C. McFann K. Perez-Mendez O. Vazquez A. Ruiz A. Lanaspa MA. Jimenez CR. Johnson RJ. Lozada LG. The effect of two energy-restricted diets, a low-fructose diet versus a moderate natural fructose diet, on weight loss and metabolic syndrome parameters: a randomized controlled trial. Metabolism. 2011;60:1551–1559. doi: 10.1016/j.metabol.2011.04.001. [DOI] [PubMed] [Google Scholar]
- Winkleby MA. Jatulis DE. Frank E. Fortmann SP. Socioeconomic status and health: how education, income, and occupation contribute to risk factors for cardiovascular disease. Am J Public Health. 1992;82:816–820. doi: 10.2105/ajph.82.6.816. [DOI] [PMC free article] [PubMed] [Google Scholar]
- Bray GA. Nielsen SJ. Popkin BM. Consumption of high-fructose corn syrup in beverages may play a role in the epidemic of obesity. Am J Clin Nutr. 2004;79:537–543. doi: 10.1093/ajcn/79.4.537. [DOI] [PubMed] [Google Scholar]