

Abstract
The carbon budget of the tropics has been perturbed as a result of human influences. Here, we attempt to construct a ‘bottom-up’ analysis of the biological components of the budget as they are affected by human activities. There are major uncertainties in the extent and carbon content of different vegetation types, the rates of land-use change and forest degradation, but recent developments in satellite remote sensing have gone far towards reducing these uncertainties. Stocks of carbon as biomass in tropical forests and woodlands add up to 271 ± 16 Pg with an even greater quantity of carbon as soil organic matter. Carbon loss from deforestation, degradation, harvesting and peat fires is estimated as 2.01 ± 1.1 Pg annum−1; while carbon gain from forest and woodland growth is 1.85 ± 0.09 Pg annum−1. We conclude that tropical lands are on average a small carbon source to the atmosphere, a result that is consistent with the ‘top-down’ result from measurements in the atmosphere. If they were to be conserved, they would be a substantial carbon sink. Release of carbon as carbon dioxide from fossil fuel burning in the tropics is 0.74 Pg annum−1 or 0.57 MgC person−1 annum−1, much lower than the corresponding figures from developed regions of the world.
Keywords: carbon emissions, deforestation, forest degradation, human development index, land-use change
Introduction
The tropical land surface has undergone substantial changes in the last few decades as forest has been cleared to enable other forms of land use. These changes involve the energy balance, the cycling of carbon and water and emissions of greenhouse gases at local and regional scales; they are believed to be sufficiently large to influence the climate system. Simulations using climate models suggest these changes will lead to significant feedbacks to the climate system, including an increase in temperature and a decrease in regional precipitation (Lean & Warringlow, 1989; Shukla et al., 1990; Costa & Foley, 2000; Voldoire & Royer, 2004; Medvigy et al., 2011; Ehn et al., 2014). Precipitation over tropical land masses could decrease significantly and possibly weaken the tropical atmospheric circulation (Vecchi et al., 2006), and these climatic effects may teleconnect to other parts of the world (Werth & Avissar, 2002). Consequently, interest in the carbon balance of the tropics, and especially the impact of deforestation on the carbon cycle, remains high (Ciais et al., 2010; Gloor et al., 2012; Patra et al., 2013; Aragão et al., 2014).
Most of the land surface change in the tropics is driven by the need to clear forests and woodlands to provide agricultural land (Montoya & Rull, 2011; Galan de Mera et al., 2012; Houghton et al., 2012) and also to satisfy a growing demand for timber, fibre and – more recently – biofuel (Koh & Wilcove, 2008; Aragão et al., 2014). Public attention is usually focussed on the loss and degradation of pristine tropical forests, which are often presented in media reports as ‘the lungs of the Earth’ as they exchange huge volumes of gases with the atmosphere (Laurance, 1999). However, the tropics contain other ecosystems too, most notably secondary forests, savannas (woodlands and grasslands), mangroves, plantations and many forms of agriculture. Although these normally contain less carbon per area than intact rain forests, they nevertheless must be considered in any attempt to make a comprehensive analysis of the carbon fluxes and especially the effect of the pressure placed on the tropics by an increasing population of human consumers.
Our overall knowledge of carbon stocks and fluxes has increased hugely in recent years, as a result of new tools for research, and a vigorous and multi-disciplinary approach to the detection of land-use change. Most noteworthy have been (i) the attempts to measure carbon stock changes of intact forests using networks of sample plots (Phillips et al., 1998; Malhi et al., 2002; Lewis et al., 2009), (ii) the introduction of micrometeorological methods to estimate net carbon fluxes at representative tropical forests (Grace et al., 1995; Kruijt et al., 2004; Saleska et al., 2009), (iii) innovation in satellite remote sensing for the detection of change in land cover and mapping of carbon stocks (Achard et al., 2002; Asner et al., 2010; Saatchi et al., 2011; Baccini et al., 2012; Hansen et al., 2013; Mayaux et al., 2013), (iv) measurements of carbon dioxide concentration in the atmosphere to infer carbon fluxes at a very large scale (Jacobson et al., 2007; Gatti et al., 2010, 2014; Sarmiento et al., 2010) and (v) the use of field experimentation to assess the effect of drought and disturbance on carbon stocks, fluxes and ecosystem vulnerability (San José et al., 2003; Nepstad et al., 2007; Lloyd et al., 2009; Da Costa et al., 2010; Meir & Woodward, 2010; Don et al., 2011; Salinas et al., 2011). Despite these efforts, major uncertainties in the overall carbon budget of the tropics remain (House et al., 2003; Ziegler et al., 2012; Wright, 2013), and there are strong regional variations which depend on government policies and changing patterns of global demand for products (Ciais et al., 2007, 2010; Williams et al., 2007; Achten & Verchot, 2011; Gloor et al., 2012). In this article we examine progress made in the last 10 years to define the stocks and fluxes of carbon in the tropics, and to understand the natural and anthropogenic drivers of change.
The terrestrial surface
The terrestrial surface of the tropics is defined as the land between latitudes 23.44°N and 23.44°S; it covers some 44 million km2, scattered between 93 major countries in tropical parts of Africa, Asia and South and Central America. It constitutes 8.6 per cent of the planetary surface and 30% of the global land surface; it varies in elevation from sea level to 6768 m in the Peruvian Andes.
The land on all continents except Antarctica is to some extent vegetated and thus takes up substantial amounts of carbon dioxide (CO2) from the atmosphere through the process of photosynthesis, most of which is ultimately released from ecosystems back to the atmosphere via respiration. Globally, the mass of carbon absorbed by photosynthesis, the Gross Primary Productivity, GPP, is huge, slightly more than 120 Pg C annum−1 (Lieth & Box, 1977; Roy et al., 2001; Beer et al., 2010). Most of this uptake occurs in the tropics, where the GPP is estimated to be as high as 72 Pg C annum−1 (Beer et al., 2010).
Ecosystems store carbon as macromolecules (lignin, cellulose, starch, proteins) in plants and soil for a variable period of time (Galbraith et al., 2013), subsequently releasing CO2 through plant, animal and microbial respiration, and fire. The combined efflux to the atmosphere is somewhat less than the uptake by gross photosynthesis. We know this from changes in the concentrations of gases and their isotopes in the atmosphere, and from models (Falkowski et al., 2000; Roy et al., 2001). In former times these two opposing fluxes may sometimes have been in equilibrium i.e. the uptake of CO2 by photosynthesis averaged over a number of years might well have been balanced by the loss of CO2 from respiration and fire.
Nowadays the carbon cycle is out of equilibrium as a result two classes of major perturbations. The first, perpetrated by the rich countries of the world, is the inexorable increase in fossil fuel burning; the second is the removal of forests in tropical countries. According to most authorities, the carbon released by deforestation rose sharply in the 1980s but has decreased somewhat in recent years (Houghton et al., 2012). In 2010, it was thought to be less than 1 PgC annum−1 while the global fossil fuel emissions were still on the increase, recently standing at 8.7 PgC annum−1 (Boden et al., 2010; Friedlingstein et al., 2010). Geological processes such as weathering and volcanism also contribute to the exchange of CO2 between the land and atmosphere but their contribution is only important on a geological time scale (Berner, 2003).
Apart from CO2, other carbon species may be significant. In particular, methane emissions have changed in recent decades as a result of human activity. A full discussion of methane is outside the scope of this article, and can be found elsewhere (Kirschke et al., 2013). The global emission of methane is between 0.55 and 0.68 Pg CH4 annum−1 and according to recent satellite observations the tropical component is 0.20 Pg CH4 annum−1 (Frankenberg et al., 2008). Most of the tropical component is probably from natural aquatic ecosystems, but some is associated with land-use change, particularly the increase in rice production, biomass burning and the flooding of the land to create reservoirs (Reay et al., 2010; Fearnside & Pueyo, 2012).
A century ago, when human influences were less than today, we may guess that all 44 million km2 of the tropics, with the exception of high mountains and a few dry areas, would have supported some kind of tree cover. Now, less than 18 million km2 of forest remain (FAO, 2011) and deforestation continues albeit at a reduced rate compared to the period 1960–1980, while agricultural land keeps expanding (Houghton et al., 2012). But in experiments where tropical grasslands and savannas are protected from fire and grazing, trees return and the land usually becomes forested within a few years (Bond et al., 2005; Grace et al., 2006). Another way in which humans are thought to be influencing tropical forests and woodlands is by the increase in concentrations of CO2 derived from fossil fuel burning. This increase may be stimulating photosynthesis, which may contribute significantly to uptake of atmospheric CO2 (Lloyd & Farquhar, 1996; Lloyd, 2002; Pan et al., 2011) and may explain the observation that biomass in undisturbed forest plots is increasing (Phillips et al., 1998; Lewis et al., 2009). The topic is however controversial as large scale experimentation on the effects of CO2 enrichment on tropical forests has not yet been achieved (but see Tollefson, 2013) and estimates of the CO2 effect rests on work carried out in microcosms (although some microcosms have been rather large, Rosenthal, 1998; Krner & Arnone, 1992), or theoretical considerations from physiological and biochemical knowledge (Lloyd & Farquhar, 1996). Sometimes, increases in biomass in sample plots (Phillips et al., 1998; Lewis et al., 2009) are considered to be evidence of the impact of rising CO2, but clearly other factors may also be causing such changes (Wright, 2013).
Forests and woodlands contain large and conspicuous stocks of above-ground carbon, and when they are cleared to make way for other land uses, much of this carbon is lost to the atmosphere as CO2. The land area that can be deemed ‘forest’ clearly depends on the operational definition of ‘forest’. The Food and Agriculture Organization (FAO) defines forest as ‘land with a tree cover of more than 10 per cent and an area of more than 0.5 ha’. The definition further states: ‘the trees should be able to reach a height of 5 m at maturity in situ’ (FAO, 2000). It excludes land that is ‘predominantly used for agriculture’, but clearly includes most woodland savanna but not grassland savanna.
The published areas of tropical lands covered with forests, pastures and crops may be obtained from FAO statistics and satellite remote sensing (Table 1), although the various definitions of ‘tropical forest’ adopted by authors lead inevitably to confusion and contradictory figures (see Lambin et al.,2003; Gibbs et al., 2007; Hansen et al., 2013). Here, we decided to use satellite data from the European Space Agency (ESA) as it is readily available and uses the United Nations Land Cover Classification System.
Table 1.
Wide variation in the reported area of tropical forests (including open forests and dry forests). FAO (2011) uses country reports, the others are from the interpretation of remote sensing data. Lewis et al. (2009) used the average of four different data sets including FAO and remote sensing, Globcover2009 refers to a global map produced by the European Space Agency using satellite data from January to December 2009, Saatchi et al. (2011) used various remotely sensed data products. Units are millions of km2
| FAO (2011) | Lewis et al. (2009) | GlobCover2009 | Saatchi et al. (2011) | Mean | |
|---|---|---|---|---|---|
| America | 8.90 | 7.87 | 9.90 | 12.1 | 9.69 |
| Africa | 5.95 | 6.32 | 9.78 | 7.75 | 7.45 |
| Asia | 2.94 | 3.58 | 1.98 | 4.74 | 3.31 |
| Total | 17.79 | 17.77 | 21.66 | 24.59 | 20.45 |
The ESA GLOBCOVER project created land-cover maps using observations from the MERIS sensor (300 m resolution) on board the ENVISAT satellite mission for periods between December 2004 and December 2009. It appears from the 2009 product that tropical lands are about 47% forest, with 26% pasture and 10% croplands (Table 2). The remaining land falls outside these definitions, and includes other vegetated areas, floodplains and urban complexes, and also grasslands with scattered trees below the 10% canopy cover threshold. There has been a progressive loss of tropical forest over the last 50 years, related mostly to the extent of human development which has steadily increased in parallel with population growth (DeFries et al., 2010).
Table 2.
Land use for crops, pastures and forests in the tropics. Data for crops and pastures are from Ramankutty et al., (2008) and are based on country data reported from years 1996 to 2003; data for forests are from the last column of Table 1. Note that the residual ‘Other’ for Asia is negative, implying some degree of confusion or overlap in the reported classification between forest and non-forest
| Region | Total land area (million km2) | Cropland (million km2) | Pasture (million km2) | Forest (million km2) | Other |
|---|---|---|---|---|---|
| America | 16.36 | 1.24 | 3.98 | 9.69 | 1.52 |
| Africa | 22.97 | 1.94 | 7.28 | 7.45 | 6.30 |
| Asia | 3.80 | 0.97 | 0.06 | 3.31 | −0.54 |
| Total | 43.13 | 4.15 | 11.32 | 20.45 | 7.21 |
Other natural and semi-natural ecosystems of the tropics include grasslands with various fractions of tree cover and contain substantially less carbon per area than forests, although sometimes have a larger stock of carbon below-ground as soil organic matter (Juo et al., 1995; San José & Montes, 2001; Fisher et al., 2007; Saiz et al., 2012). Mangroves for example are reported to have extremely high carbon stocks per area, averaging 1023 Mg C ha−1 when the below-ground component is included, with some of the highest values of Net Primary Productivity ever recorded (Donato et al., 2011), but their global area is only 200 thousand km2, just 0.5% of the land in the humid tropics. Forming a fringe between the lands from the ocean, they export significant quantities of recalcitrant carbon compounds to the sea (Silva et al., 1991; Kristensen et al., 2008; Tamooh et al., 2008; Alongi, 2012). This, along with the export of plant products, is an example of lateral transport of carbon from the tropics (see Gloor et al., 2012).
Ziegler et al. (2012) reported the range of above-ground carbon per area of tropical ecosystems to vary from a few tonnes per hectare to over 400 Mg C ha−1 (Fig.1). The data show that forests contain more above-ground carbon than the various cropped systems and suggest that deforestation will inevitably result in a large loss of carbon.
Figure 1.
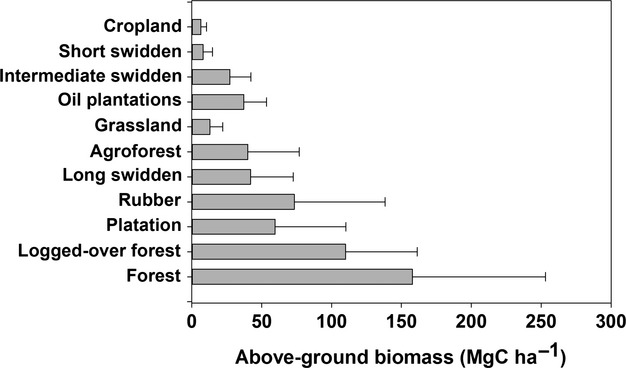
Statistical spread of above-ground Biomass for 11 types of land use in the tropics, plotted from the data of Ziegler et al. (2012). Box plots represent medians and quartiles, SD and outliers.
Substantial stocks of carbon occur in tropical soils as Soil Organic Carbon (SOC). Estimates by soil scientists for the carbon stored as SOC in the entire tropics vary from less than 200 Pg (Amundson, 2001; FAO, 2010) to 500–650 Pg (Eswaran et al., 1993; Sombroek et al., 1993; Batjes, 1996). One reason for the large discrepancies in the literature is that some authors consider the soil carbon only in the surface layers rather than in the whole soil profile, assuming the organic matter below the arbitrary depth of 1 m to be inactive. Carbonate-carbon is also significant in some regions (Batjes, 1996), and so is charcoal remaining from long-past slash and burn; however this latter component is considered by most authorities to be inert (but see Bird et al., 1999). If we take Batjes's figures of 616–640 Pg for the SOC in the top 2 m, and divide by the area of tropical lands (taken as 48 million km2), we may conclude that tropical lands have, on average 128–133 MgC ha−1 of SOC. Alternatively if we consider only the top metre of soil we have 80–84 MgC ha−1, a figure which is close to the average found by researchers in the field (Don et al., 2011).
What happens to this soil organic carbon when land use is changed is not always clear (Table 3, data from Don et al., 2011). Eclesia et al. (2012) showed that when forests are replaced by plantations of pine or eucalyptus, the soil carbon content increases linearly, and after a century it far exceeds the levels found in the native forest, except in the wettest sites. It is often proposed that plantations may be used to rehabilitate degraded lands, as they may increase the carbon and nutrient content in the surface layers (Chazdon, 2008); moreover, long-lived and slow-growing plantation species are found to have soils with remarkably high carbon content (Kraenzel et al., 2003). However, in some cases, conversion of native forest to fast-growing commercial plantations such as cocoa, coconut and oil palm is reported to cause a decline in soil carbon (Chiti et al., 2014). The whole issue of the carbon balance of tropical plantation requires further research, to be co-ordinated across regions and to be funded by agencies which have no vested interest in the results.
Table 3.
Carbon storage in soil organic carbon (SOC) and the change resulting from a transition in land use (from Don et al., 2011). Negative denotes loss of organic matter, positive denotes gain. ± shows the SE of the Mean and n is the number of observations. The data are based on paired sample plots, the time after the transition varies from 21 and 49 years
| Transition | SOC before change (Mg ha−1) | Change in SOC (Mg ha−1) | n |
|---|---|---|---|
| Primary forest to grassland | 73 ± 7 | −12.6 ± 3.0 | 93 |
| Primary forest to cropland | 83 ± 9 | −20.1 ± 5.2 | 56 |
| Primary forest to perennial crops | 105 ± 20 | −32.0 ± 3.5 | 20 |
| Primary forest to secondary forest | 91 ± 9 | −12.6 ± 2.4 | 71 |
| Secondary forest to grassland | 84 ± 6 | −11.0 ± 3.4 | 66 |
| Secondary forest to cropland | 88 ± 12 | 25.8 ± 6.9 | 26 |
| Secondary forest to perennial crops | 90 ± 17 | 5.6 ± 3.0 | 15 |
| Grassland to secondary forest | 60 ± 9 | + 12.4 ± 6.1 | 32 |
| Cropland to secondary forest | 70 ± 9 | + 33.2 ± 10.5 | 25 |
| Grassland to cropland | 64 ± 15 | + 6.0 ± 5.8 | 15 |
| Cropland to grassland | 61 ± 17 | + 7.6 ± 5.8 | 16 |
| Cropland to fallow | 43 ± 7 | + 8.9 ± 2.9 | 21 |
Contrary to common expectations, the forest-to-pasture transition may sometimes lead to an increase in soil carbon, especially in the surface layers of soil (Guo & Gifford, 2002; Don et al., 2011; Eclesia et al., 2012; Yonekura et al., 2012) as suspected from earlier research on South-American pastures made up of introduced grasses (Fisher et al., 1994). Often, the largest increases are in the wetter sites. This analysis is intriguing and relevant to much of the land-use change occurring in the tropics today, but the difference in behaviour between the various types of transition have not been explained, and results may be quite different for other plantation types (coconut, oil palm, cacao). Marin-Spoitta & Sharma (2013) found trends in soil carbon that were weaker, with an overwhelming effect of mean annual temperature and precipitation. In an extensive review of soils of sub-Saharan Africa, Vågen et al. (2005) concluded that largest potential for increasing SOC is through the establishment of natural or improved fallow systems (agroforestry), which provide rates of C sequestration in the range of 0.1–5.3 MgC ha−1 annum−1.
Forest biomass derived from national inventories
Prompted by the 1992 United Nations Conference on Environment and Development (UNCED), the Food and Agriculture Organization (FAO) publishes a biennial series called State of the World's Forests in which data on forest areas reported by national governments are compiled. Recommendations for standardized reporting of carbon stocks of forests based on ecosystem mensuration are described in several publications including Penman et al. (2003) and GOFC-GOLD (2010). The FAO data on forest area (Table 4) are widely cited by researchers as a source of information on deforestation, and the 2011 report contains additionally a table of biomass carbon changes derived from such data (FAO, 2011). Taken at face value, these figures show an annual carbon flux from deforestation in the period from 2000 to 2010 of 0.88 PgC annum−1. However, reporting has not been consistent and the quality of national data is often questioned (Achard et al., 2002; Grainger, 2008; Gloor et al., 2012). National inventory data sets are being rapidly superseded by satellite data, as discussed in a later section.
Table 4.
Areas and carbon stocks of tropical forests from 1990 to 2010 according to FAO (2011). Also included are the carbon stocks in dead wood and litter (‘litter’) and soil according to FAO
| Areas (millions of km2) | Carbon stocks in biomass (PgC) | Litter (PgC) | Soil (PgC) | |||||||
|---|---|---|---|---|---|---|---|---|---|---|
| 1990 | 2000 | 2005 | 2010 | 1990 | 2000 | 2005 | 2010 | 2010 | 2010 | |
| America | 9.78 | 9.32 | 9.09 | 8.90 | 110.9 | 106.2 | 103.9 | 102.1 | 10.0 | 75.5 |
| Africa | 6.64 | 6.29 | 6.12 | 5.95 | 60.9 | 58.3 | 57.1 | 55.9 | 7.9 | 34.5 |
| Asia | 3.25 | 3.01 | 2.99 | 2.94 | 29.1 | 27.5 | 26.5 | 25.2 | 1.0 | 16.5 |
| Total | 19.76 | 18.63 | 18.20 | 17.81 | 200.2 | 192.0 | 187.5 | 183.2 | 18.9 | 126.5 |
Forest biomass derived from research plots
Meanwhile, independent researchers have been pooling data from their own permanent sample plots, which are typically 1 ha marked areas in which all trees greater than 10 cm in diameter have been tagged and repeatedly measured using a common protocol (Phillips et al., 1998; Malhi et al., 2002; Lewis et al., 2009). Such data are now vital for the calibration of remotely sensed information. Perceived limitations of the use of these 1 ha plots are (i) samples may not be entirely representative of the range of tropical forests, considering that many forests, even when they appear pristine, are actually in stages of recovery from disturbance, both natural and anthropogenic (Phillips et al., 2002; Fisher et al., 2007; Lloyd et al., 2007; Gloor et al., 2009) (ii) the allometric equations used to convert tree diameter and height to biomass introduce uncertainties especially for the large trees which usually contain most of the carbon (Chave et al., 2005) (iii) further allometric relationships are required to estimate below-ground biomass, although below-ground biomass data are scarce because of the practical difficulties of achieving large and representative samples (Kenzo et al., 2009; Ryan et al., 2011) (iv) soil carbon stocks as soil organic matter and elemental carbon are not generally recorded, and if they are, the studies are confined to surface layers only. Despite these difficulties, analysis of some 156 sample plots covering an area of 163 ha on three continents suggests these forests have been accumulating carbon in recent decades at an average rate of 0.49 MgC ha−1 annum−1 (Lewis et al., 2009).
Forest biomass from satellite remote sensing
Satellite observations of land-use change in the tropics were first used on a large scale for the detection of deforestation in Brazil (INPE, 2003). These observations made use of the NASA Landsat satellites, which began with Landsat 1 in 1972 and continue today with Landsat 8. Other satellite missions widely used include the European SPOT (Système Pour l'Observation de la Terre) series of satellites, commencing with SPOT 1 (1986) and leading to SPOT 6 (launched 2012), which has acquired images with relatively high spatial resolution (10 m or less); ENVISAT which flew the Moderate Resolution Imaging Spectrometer MERIS from 2002 to 2012; the NOAA Advanced Very High Resolution Radiometer (AVHRR) from 1978 to the present; and NASA's Moderate resolution Imaging Spectroradiometer (MODIS) on board the Terra and Aqua satellites from 2000 to the present.
All of these instruments detect energy from the sun and sky that has been reflected from the planetary surface, in specific wavebands. Forest and ‘non-forest’ areas have different spectral signatures and so may be distinguished from each other in ideal conditions. But in the tropics the use of such optical remote sensing has been limited because of the frequent presence of clouds. Mayaux et al. (2013) describe how cloud-free data can nevertheless be attained by carefully selecting the images and using multiple satellites to obtain cloud-free images representing one year. Thus, satellites have provided valuable indications of the decline of forest cover over three decades (Achard et al., 2002; Hansen et al., 2013; Mayaux et al., 2013).
Difficulties arise when we try to make comparisons between satellite-based estimates by different authors because quite different criteria to recognize ‘forest’ have been used (compare for example Achard et al., 2002; Mayaux et al., 1998 and Hansen et al., 2010). This leads to totally different areas of forest, particularly in Africa where woodland savanna is a large part of a continuum that includes open forest and closed forest. If we define ‘forest’ broadly as having a canopy cover of 10% or more, as the FAO has done, the area of tropical forest from satellite data is 24.6 million km2 (Saatchi et al., 2011), somewhat more than the 20 million km2 identified by the FAO methodology. But Achard et al. (2002) adopt a more restricted definition called ‘humid tropical forest’, which excludes dry forests and woodlands, and they find only 11.5 million km2.
Some of the difficulties of estimating forest areas and carbon stocks from space have been overcome by new technological developments. The first of these is the deployment, from space, of active radar remote sensing, which offers the possibility of not only detecting the extent of forest but of also estimating biomass from the back-scattered radar signal (Quegan et al., 2000). Because radar sensors can ‘see’ the land surface even at night and when there is cloud cover, more data are acquired than with optical sensors. Moreover, radar penetrates the forest canopy to an extent which depends on its wavelength, and the back-scattered signal provides information on the amount of biomass per area of land (Le Toan et al., 2011; Woodhouse et al., 2012). From 2006 to 2011 the Japanese Advanced Land Observing Satellite (ALOS) carried a synthetic aperture radar sensor (PALSAR, the Phased Array type L-band Synthetic Aperture Radar) which has been used to map biomass distribution in Africa and elsewhere (Mitchard et al., 2009; Ryan et al., 2012; Reich et al., 2013).
The second recent development is the use of space-borne LIDAR to measure the height of the vegetation and thus to estimate biomass from ground-based calibration data. The NASA satellite ICESat, designed primarily to measure the changing mass of polar ice sheets using LIDAR, flew from 2003 to 2009 and provided point estimates of tropical forest mass across the tropics, which were spatially extrapolated into the first pan-tropical maps of aboveground carbon using ancillary full-cover datasets (Saatchi et al., 2011; Baccini et al., 2012). Both studies used the ICESat data in combination with remotely sensed information on forest cover to model and map the spatial distribution of biomass across three continents for the 2000s.
However, these maps are not exactly the same, despite their common ICESat origin. The differences are likely to arise partly from the fact that the calibration data were from different field plots and the allometric equations used by the two groups working independently were not the same. Very recently, Mitchard et al. (2013a, b) have compared the two sets of results. On a per country basis or on a biomass density basis they agree to within 15 per cent, but when compared to the corresponding FAO data both sets of LIDAR data show significantly more biomass carbon than estimated from inventories. Overall, the total above-ground biomass in the tropics is 179 Pg of carbon according to the FAO inventory data, 203 Pg according to Saatchi et al. (2011), and 228 Pg according to Baccini et al. (2012). The apparent underestimation by the FAO data is noteworthy, and does significantly affect the estimates of global deforestation flux. We may estimate the below-ground biomass using an ‘expansion factor’ of 1.26 calculated from Luyssaert et al. (2007), and derive the total biomass carbon in the tropics as 256–287 Pg. Alternatively, if we take the FAO figures (Table 3) we find 202.1 Pg of carbon in biomass (with litter) and a further 126 Pg of carbon as soil organic matter. The very recent satellite data set from Hansen et al. (2013) does not agree well with the FAO figures, and is more consistent with Saatchi et al. (2011) and Baccini et al. (2012).
The nature of the sources and sinks of carbon
Sources and sinks of atmospheric carbon arise when the input of carbon into the land surface does not equal the sum of all the carbon outputs. The main carbon input is by photosynthesis of green plants and the main outputs are autotrophic (i.e. plant) respiration Ra, heterotrophic (i.e. microbe and animal) respiration Rh and fire. In the several hundred ecosystems of the world which have been investigated, the annual sum of photosynthesis, known as the Gross Primary Productivity GPP, usually exceeds Ra + Rh (Luyssaert et al., 2007, 2008), implying that ecosystems are often carbon sinks at least at the local scale and over short (a few years) time scales. In a few investigations, ecosystems have been found to be a carbon source, especially following disturbance (Saleska et al., 2003). Such studies provide useful insights into processes, but they are short term and thus generally do not pick up rare catastrophic events such as storms and fires, when forests suffer periodic reductions in biomass; these events occur particularly in relation to climate extremes associated with the Southern Oscillation (Aragão et al., 2008; Flores et al., 2014). The data base of Luyssaert et al. (2007) provides consistent quality-controlled information on the constituent carbon fluxes for forest ecosystem under undisturbed conditions, enabling us to comment on the magnitudes of the tropical forest fluxes (Fig.2). We see that the photosynthetic input (GPP) of a typical tropical forest is as high as 32 MgC ha−1 annum−1, much higher than that of deciduous forest, presumably because conditions for photosynthesis are favourable all the year round in the humid tropics, whereas in other parts of the world there are climatological limitations for part of the year. However, respiratory effluxes Ra and Rh are also much higher in the tropical forest, so the Net Primary Productivity (GPP-Ra) is usually between 5 and 10 MgC ha−1 annum−1 (see also Malhi, 2012) not particularly high compared to other ecosystems in both the tropics and the temperate zone (Clark et al., 2001; Scurlock & Olson, 2002), and not nearly as high as tropical grassland sometimes can be (Long et al., 1989). One reason why NPP of tropical forests is not much higher than for temperate forests is that almost all the temperate forests are in a relatively juvenile phase, being managed to be productive and containing trees which are in their most active growth phase (Luyssaert et al., 2008).
Figure 2.
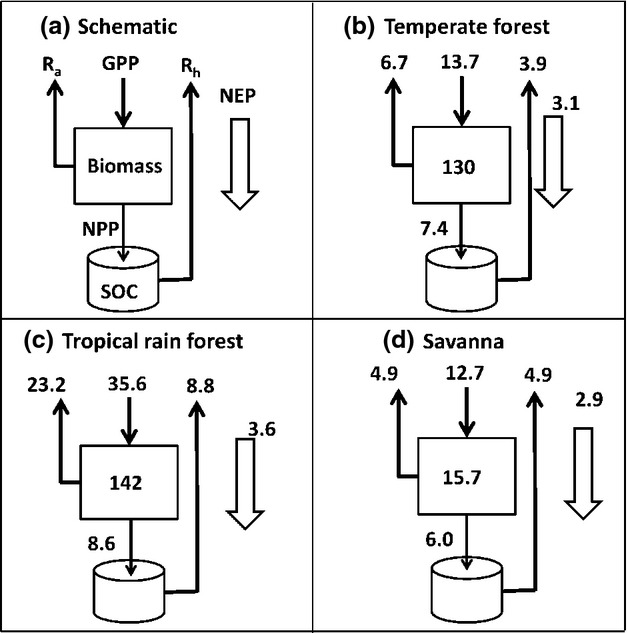
Typical carbon fluxes for temperate and tropical forests, and tropical savannah, showing Gross Primary Productivity (GPP), Net Primary Productivity (NPP), Ra (autotrophic respiration), Rh (heterotrophic respiration) and the overall carbon balance Net Ecosystem Production (NEP). Units are MgC ha−1 annum−1 for fluxes and MgC ha−1 for biomass stocks (shown in the central box). Based on data from Luyssaert et al. (2007).
Savanna ecosystems, with or without tree cover, contain much less biomass than rain forests and have a large fraction of biomass underground, a characteristic which enables them to recover from fire (Grace et al., 2006; Ribeiro et al., 2011). They have smaller annual fluxes, because growth is constrained by a long dry season in which many species shed their leaves (Sankaran et al., 2005). They are also frequently burned and so suffer periodic reductions in leaf area. In the wet season, they may have a rather high rate of carbon assimilation, partly as a result of the ground cover of C4 grasses (Miranda et al., 1997; San José et al., 2003; Santos et al., 2003, 2004; Veenendaal et al., 2004), which appear to contribute as much as 59% of the Primary Productivity of savannas world-wide (Lloyd et al., 2008).
Can the anthropogenic sources and sinks be deduced from existing data?
The ICESat-derived maps may have indeed provided the most reliable estimates of forest biomass; however, to track changes in the carbon stocks over decades one requires a long-term data set. So far, only the FAO data provide such a time series covering the whole tropics, although there are well-documented satellite data over long periods for particular areas, for example South America (Gloor et al., 2012). From the available data, we may estimate the total flux arising directly from human perturbations as the sum of the constituent terms, each one representing a type of disturbance:
In the following paragraphs, we consider the terms one-by-one.
FDeforestation the deforestation flux
To estimate the deforestation flux requires data on forest area of the entire tropics from more than one point in time. We have extracted the time series from FAO (2011). We present three estimates of deforestation flux (Table 5). The first, from FAO (2011) shows evidence of a decline in deforestation flux from 2000 to 2010, and stands at 0.80 Pg C annum−1 for 2005–2010. The second is a modification of the FAO data, obtained as the product of the area of forest ‘lost’ and the carbon content per area of land (MgC ha−1), obtained from regional average data calculated from Saatchi et al. (2011). The deforestation flux for the tropics for the period 1990–2010 using this method is 0.77 Pg C annum−1. If we use instead the recent and probably more reliable satellite-based deforestation figures (Hansen et al., 2013) instead of the FAO figures, we obtain a higher value of 0.93 Pg C annum−1 (Table 5). The regional totals from FAO and Hansen are far from being in agreement, except for South America where the data are dominated by Brazil, a country where the deforestation rate reported to the FAO is estimated by remote sensing and where the agreement between the FAO data and Hansen's data is much better. On the other hand, the deforestation rates of most African countries are less than the FAO figures, often by a margin exceeding 50%, while in Asia the discrepancy is the other way around (the Hansen deforestation rates of Indonesia and Malaysia are more than double the reported rates).
Table 5.
Estimated annual carbon flux from tropical deforestation (FAO, 2011). Comparison is made with the FAO figures using carbon density data from Saatchi to convert areas to carbon stocks (FAO-S), and satellite data from Hansen et al. (2013) over a similar period (2000–2012) also using carbon density data from Saatchi et al. (2011) to convert areas of forest loss into carbon fluxes. The final column is an estimate of the degradation flux (see text). Units PgC annum−1
| FAO 1990–2000 | FAO, 2000–2005 | FAO 2005–2010 | FAO-S 2000–2010 | Hansen 2000–2012 | Degradation flux 2000–2012 | |
|---|---|---|---|---|---|---|
| America | 0.45 | 0.45 | 0.38 | 0.46 | 0.48 | 0.05–0.24 |
| Africa | 0.28 | 0.27 | 0.27 | 0.21 | 0.12 | 0.01–0.06 |
| Asia | 0.35 | 0.05 | 0.14 | 0.098 | 0.33 | 0.03–0.15 |
| Total | 1.09 | 0.79 | 0.80 | 0.77 | 0.93 | 0.09–0.46 |
In constructing the trends over time in the carbon budget in any scenario of deforestation, it must be kept in mind that the carbon in the trees and litter is not all immediately oxidized. Some trees may survive and die later; and below-ground components, once dead, decompose rather slowly at a rate which is likely to vary enormously with the wood composition, the moisture content of the soil and the fineness of the dead material. In the analysis given above, we have made no attempt to model the decomposition rate, although some authors have done so (Gloor et al., 2012; Houghton et al., 2012).
FDegradation
‘Forest degradation’ refers to a loss of biomass which is not visible by conventional remote sensing, and which usually goes unreported. It arises mostly from selective logging, where the fraction of trees removed is not sufficient to change the land cover from ‘forest’ to ‘non-forest’ (Nepstad et al. 1999; Asner et al., 2005). It may also occur as a result of fire or drought, where damage occurs in the subcanopy and the large trees are relatively undamaged and so the canopy viewed from space is identified as ‘forest’. It may also be associated with fragmentation, the process whereby the forest is broken up into small subunits which may then be exposed to ‘edge effect’ and become more susceptible to drought. Measuring degradation has been attempted for specific regions. For example, in the Congo Basin. Ernst et al. (2013) found that the forest area affected by degradation was of a similar size as the deforested area and commented that deforestation and degradation were usually interrelated. At present, insufficient information is available to estimate the tropical degradation flux and it may be the largest uncertainty in the tropical carbon budget. Here, we assume that the degradation flux is between 10% and 50% of the deforestation flux, yielding an estimate of 0.27 ± 0.11 Pg annum−1. In the future, it is expected that radar remote sensing will provide regular information on biomass as well as forest cover, and so the uncertainty in degradation flux may be reduced (Le Toan et al., 2011).
Using Hansen's data, we estimate deforestation plus degradation fluxes of 1.20 ± 0.17 Pg annum−1, yielding total fluxes which are more or less consistent with the many data sets reviewed by Houghton et al. (2012) and the estimate of ‘about 1.2’ Pg C annum−1 by Van der Werf et al. (2009) for the emissions associated with ‘deforestation and degradation’. In Fig.3, we combine the data of Van der Werf et al. (2009), Houghton et al. (2012) and the estimates obtained in this study as FDeforestation + FDegradation using either the FAO data or the Hansen et al. (2013) data. We see large discrepancies, but the most recent results (which may be more reliable) provide support for van der Werf's estimate of 1.2 Pg C annum−1.
Figure 3.
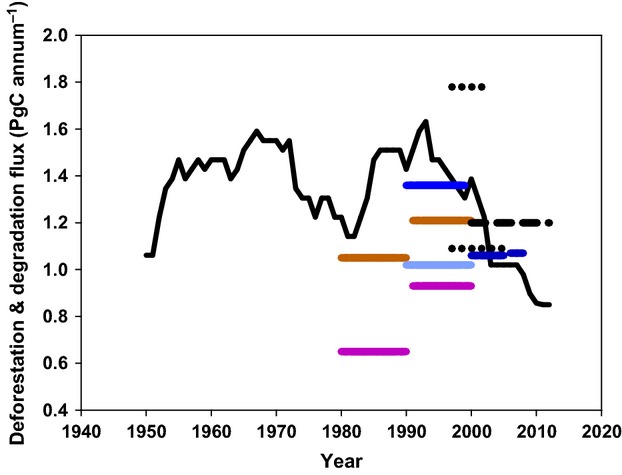
Estimates of the carbon flux from deforestation and degradation in the tropics. The solid black line is redrawn from Houghton et al. (2012). From the current analysis: black dashed line from the data of Hansen et al., 2013; the dark blue lines from calculations using the FAO data. The remaining lines are redrawn from the synthesis by Van der Werf et al. (2009) as follows: purple, DeFries et al., 2002; black dots, IPCC working group III (Barker et al., 2007; Nabuurs et al., 2007); pale blue, Achard et al., 2002; brown, IPCC working group I (Denman & Brasseur, 2007).
FPlantation, the growth of plantation flux
A proportion of the forest detected in each region is in the form of plantations, which vary enormously in their growth rates (Nambiar, 2008). Some of these are in a stage of particularly rapid growth: Laclau et al. (2000) found growth rates of 16 Mg biomass ha−1 annum−1 for eucalyptus in the Congo, and much higher rates are possible with appropriate silviculture (Stape et al., 2010). But other tree species are slow growing, including those producing high-value timber such as teak and mahogany. One of the fast-increasing types of plantation is palm oil, motivated by the goal to use the oil as fuel, thus to reduce fossil fuel emissions (Gibbs et al., 2008 Achten & Verchot, 2011; Obidzinski et al., 2012). Rubber plantations have also increased; they have expanded rapidly in tropical parts of China (Yunnan and the island of Hainen). Like palm oil, there are concerns about the destruction of species-rich forests in these parts, and the possible degradation of soil (Cheng et al., 2007; Li et al., 2007, 2008; Zhai et al., 2012; Song et al., 2013).
Food and Agriculture Organization figures (FAO 2010) suggest that plantations in the tropics have increased from 90 million ha in 1990 to 144 million ha by 2010. To estimate the impact, they are having on the tropical carbon budget we have run a simple model in which the biomass of plantation forests increases sigmoidally to reach 120 MgC ha−1 after 100 years (consistent with Ziegler et al., 2012); we further assume a constant planting rate of 2.44 million ha per year from 1960 to 2010 (matching FAO figures), and then we track the annual cohort until 2010, finally adding all the cohorts. In this scenario, plantations develop sink strength of 0.24 PgC annum−1 by 2010 and accumulate a stock of 5.48 PgC. However, in achieving this state, the native forest they replace has been lost: we estimate the loss has been 15 Pg of carbon altogether. If we take a much less favourable scenario, with lower growth rates and shorter stand cycles, the sink is lower, as little as 0.10 PgC annum−1. These figures could be refined if reliable information from country-level inventories and management regimes were to be made available.
FSecondary, the flux from the regrowth of secondary forest
A secondary forest is a forest or woodland which has regrown after a major disturbance (fire, wind-throw are natural disturbances, but the use of the land for agriculture is the major anthropogenic disturbance in the context of this review, see Chokkalingam & de Yong, 2001). In the tropics, the regrowth usually reaches the biomass of the original forest in 100 years. The biodiversity recovers more slowly (Martin et al., 2013), but can be remarkably high (Berry et al., 2010).
Much of all tropical forest is now secondary forest (sensu Brown & Lugo, 1990). According to FAO (2010) about 88% of Africa's tropical forest is now secondary; the corresponding figures for Asia and South America are 62% and 23%. This includes forest developing on abandoned farmland, forest regrowing from having been destroyed or logged and woody encroachment into savanna (Mitchard & Flintrop, 2013). Secondary forest often accumulates carbon rather rapidly when young and then more slowly (Brown & Lugo, 1990; Sierra et al., 2012). In a recent analysis of data from all three tropical continents, Bonner et al. (2013) found carbon uptake rates of secondary forest from 0.25 to 6 MgC ha−1 annum−1, with a central tendency of about 2.5 MgC ha−1 annum−1, not very different from the value obtained from the much earlier (but smaller) data set by Brown & Lugo (1990). Working in forests on poor soils at Chiapas, Mexico, Orihuela-Blemonte et al., (2013) found lower rates: the average uptake rate of carbon over 40 years, including both live and dead organic matter and also soil carbon, was 2.66 MgC ha−1 annum−1, and the rate declined over three successive cycles of slash and burn.
Using the FAO figures on the extent of secondary forest, we may estimate the uptake of carbon from these forests as being from 0.8 PgC to 1.6 PgC annum−1. This value is consistent with the tropical regrowth sink of 1.6 ± 0.5 PgC annum−1 proposed by Pan et al. (2011). In the past, many authors have neglected the secondary forest sink and focussed attention on the sink in the primary forests (Lewis et al., 2009; Wright, 2013), despite the availability of remotely sensed and inventory data on the extent of secondary forests, and its increasing importance as the expanding agricultural land reaches the point of abandonment (Lucas et al., 2000; FAO, 2010; Aragão et al., 2014).
Of all the tropical continents, Africa is the most difficult to analyse in terms of the areas of secondary vs. primary forest because its land cover and land use is the most complex, and the science infrastructure is considerably weaker than elsewhere. Recent reviews (Bombelli et al., 2009; Ciais et al., 2010; Valentini et al., 2013) have brought the area into sharp focus and it is hoped that the research effort in Africa will eventually match that in Latin America. Presently, Africa remains one of the largest sources of uncertainty in our attempt to produce a tropical carbon budget. The most recent analysis concludes that land-use emissions for Africa amount to 0.32 ± 0.05 Pg C annum−1, while the African continent as a whole is a small but uncertain net sink because the accumulation of carbon in forests and woodlands exceeds the land-use emissions (Ciais et al., 2010; Valentini et al., 2013).
FPrimary, sink in the intact forest
The adjectives ‘intact’, ‘pristine’ and ‘virgin’ are used almost interchangeably to describe forest which has not been disturbed in living memory. Here, we use ‘intact’ acknowledging that ‘intact’ forest is neither pristine or virgin, having been disturbed in various ways by humans over thousands of years (including subsistence agriculture based on slash and burn which may have occurred hundreds of years ago, see Whitney et al., 2014).
It was formerly considered that intact forest is more or less at a steady state (e.g. Odum, 1966). However, a global data set suggests it is close to but not exactly in steady state, and that even old forests accumulate carbon at a measurable rate (Luyssaert et al., 2008). This may be the result of a CO2 fertilization effect, for reasons enunciated by Lloyd & Farquhar (1996) and others, or there may be other reasons or artefacts pertaining to how forest plots have been selected and sampled (Fisher et al., 2008). The data compiled by Lewis et al. (2009) from primary forests on three continents suggest a very large pan-tropical forest sink of 1.3 Pg C annum−1, which these authors tentatively attributed to CO2 fertilization. In making their estimate, Lewis et al. (2009) estimated a rate of carbon accumulation of 0.49 MgC ha−1 annum−1 from a large network of forest plots which were ‘undisturbed’. If we apply that rate over the pan-tropical areas which are intact forests (a smaller area than that used by Lewis et al., 2009 who seems to have lumped some secondary forests with primary forests), we obtain an estimate of the pan-tropical sink strength in primary forests of 0.47 Pg annum−1.
FHarvest, the harvested products
Tropical forests are harvested (i) to provide wood-fuel and charcoal at the local level and (ii) for timber and other wood products that may be exported. Wood for fuel constitutes 70% of the total wood harvest (FAO, 2011). The two categories have different average lifetimes, but here we assume that both are destined to be converted to CO2 immediately. In harvesting timber, the species that are highly valued for their strength, appearance and durability are selected. When harvesting wood-fuel there is still some selection but it is less. The gathering of wood for fuel, or for conversion into charcoal to sell in markets, is traditionally less than the biological wood production, but in sparse African woodlands this is not always the case and villagers walk far to seek fuel-wood, consuming about 1 m3 of wood per person per year (Zimmerman & Kormos, 2012).
To calculate the carbon flux from harvesting, we assume that one cubic metre of timber contains 0.25 tonnes of carbon. The tropical timber harvest flux calculated from this method, derived from the harvested volumes published in FAO (2011) is 0.34 PgC annum−1, most of it being fuel-wood. If allowance is made for wastage (assume a maximum of 50%) at the saw mill, this figure increases only slightly to 0.36 because only a small fraction of the harvested product is destined for the saw mill. Some of the harvested timber is for export markets and so part of the emissions from this source may occur outside the tropics.
FPeat, the flux from the loss of tropical peat lands
Large quantities of peat have been deposited in some areas of the humid tropics over thousands of years (Page et al., 2011). The tropical peat-land area is thought to be over 441 000 km2 (i.e. 11% of the global peat-land area) of which more than half is in south-east Asia. In the undisturbed state, the peat deposits are assumed to decompose very slowly, so slowly that over a year their contribution to emission can be assumed to be zero. But in the process of conversion from undisturbed rain forest to industrial plantations, this peat is drained and exposed to aerobic conditions; in some cases it may burn and smoulder for years. It thus produces substantial emissions of CO2 directly to the atmosphere and may also lose carbon in the drainage waters (Moore et al., 2013). The extent of this loss has been estimated as high as 20 MgC ha−1 annum−1 from measurements of subsidence at specific research sites (Hooijer et al., 2010, 2012). Of the 27.1 Mha of peat land in south-east Asia, Hooijer et al. (2010) stated that 12.9 Mha had been deforested and mostly drained by 2006. Thus, we may expect this deforestation would lead to an average efflux of some 0.54 PgC annum−1, a large figure which has been overlooked by most researchers. Very large losses may occur in some particular years: Page et al. (2002) estimated that between 0.81 and 2.57 Gt of carbon were lost in 1997 as a result of peat fires in Indonesia.
FFire, the fire flux
Large amounts of CO2, CO and CH4 and black carbon are released into the atmosphere during biomass burning (Seiler & Crutzen, 1980; Van der Werf et al., 2003; Scholes et al., 2011). However, most of the carbon fluxes have already been accounted for above in our analysis of Fd, the deforestation flux.
There are also fluxes from shifting agriculture in regions where the natural vegetation can be either secondary forest or savanna. These result from the clearing of the woody vegetation which has developed over periods that may vary from 2 to 30 years. In a most detailed analysis, Silva et al. (2011) examined the fluxes of greenhouse gases from shifting agriculture in the tropics. Using FAO agricultural statistics and land areas from the Global Land Cover 2000 (GLC2000) data set, they estimate that carbon fluxes from the tropics were as high as 0.20 PgC annum−1 though any losses from burning might be expected to be offset by the carbon sequestration in recovering fallows, as Silva et al. (2011) acknowledged, but only in the final sentence of their article.
In burning, not all of the biomass carbon is converted to gaseous form. Working in the Amazon forest, Fearnside et al. (2001, 2007) found that 1.8% of the above-ground carbon remained as charcoal. Its fate is not well-known but some information may be gleaned from consideration of Brazil's Atlantic forest. This forest was largely removed between the 1850s and the 1970s, but the black carbon from charcoal stored in the soil continues to be found today in the drainage water (Dittmer et al., 2012).
During burning, carbon particles enter the atmosphere as smoke, and are widely dispersed over vast regions of land and ocean. They are resistant to biological decomposition, but probably not as resistant as was thought previously (see Bird et al., 1999). This carbon flux was estimated by Kuhlbusch & Crutzen (1996) to be 0.05–0.20 PgC annum−1, but a recent estimate (which we adopt in this analysis) suggests a much lower figure of 0.007 PgC annum−1 (Bond et al., 2013). It should nevertheless be kept in mind that elemental carbon, whether as charcoal or smoke, is sometimes considered to be a carbon sink as it represents transfer from the relatively volatile form (biomass) to a relatively stable form (elemental carbon). On the other hand, the presence of black carbon in the atmosphere is probably a major contributor to global warming (Bond et al., 2013).
Sum of the CO2 fluxes
The sum of the sink terms FPlantation, FSecondary, FPrimary is 1.85 ± 0.09 Pg C annum−1, while the sum of the source terms FDeforestation, FDegradation, FHarvest and FPeat is 2.01 ± 1.10 Pg annum−1, making the tropics a net carbon source of 0.16 Pg annum−1 with an uncertainty of about ± 1.1 (Fig.4). Considering the uncertainties, we may conclude that the land surface is nearly carbon neutral, but could be a strong sink if deforestation and degradation were to cease.
Figure 4.
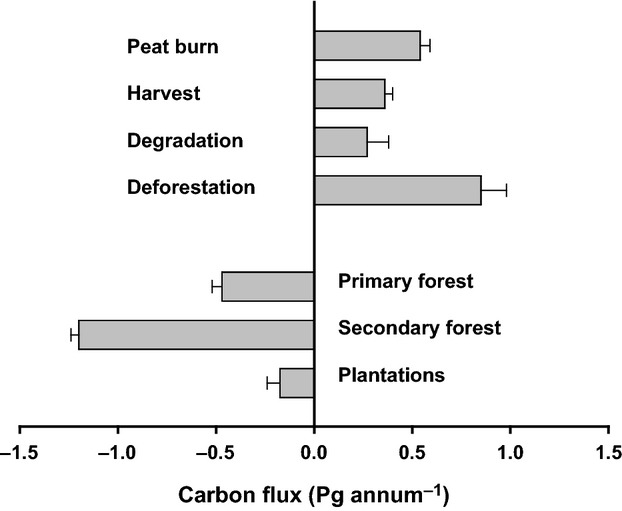
Components of human-induced change in the tropical biological carbon balance, with uncertainties. Negative denotes uptake from the atmosphere to the land surface, positive denotes loss of carbon to the atmosphere. The data are applicable to the period 2005–2010.
It may be useful to compare these data with the emissions from fossil fuel burning. For tropical countries, this now amounts to 0.74 PgC annum−1 (Boden et al., 2010). The per capita fossil fuel emissions of tropical countries are closely related to economic activity and trade (DeFries et al., 2010) and have increased sharply since 2004 suggesting that those tropical countries that have achieved significant economic development have done so by burning fossil fuels rather than by using biomass. The average annual per capita emissions of the tropical countries in this study is 0.57 MgC person−1, much lower than the corresponding figures from developed regions of the world (Australia is 5.0, USA is 4.6, UK is 2.09 MgC person−1 annum−1), and lower than the global average of 1.30 MgC person−1 annum−1.
The atmospheric signal
The carbon cycle is ‘boundless’ as several authors have emphasized (Battin et al., 2009) and site-related (ecosystem) studies suffer from the fact that sampling field plots across the entire world in a proper statistical manner is an impossibility. Not only is vegetation enormously diverse in its natural formations and even more so in its disturbed state, but also there are lateral flows of dissolved carbon that we are only beginning to understand (Richey et al., 2002; Grace & Malhi, 2002). At best, plot-based studies such as those discussed above may be used to reveal component processes and define underlying trends which can be associated with climatological variation, and used to calibrate models (Friend et al., 2007).
An alternative approach is to estimate sources and sinks from the effect the land surface has on the concentration of CO2 in the atmosphere. This can be done by using (i) measurement of CO2 concentration from a global network of points followed by an approach known as ‘atmospheric inversion’, a procedure first realized by Bolin & Keeling (1963), then developed by Enting & Mansbridge (1989) and Tans et al. (1989) or (ii) examination of many profiles of CO2 in the planetary boundary layer, achieved by aircraft flights (Chou et al., 2002; Gatti et al., 2010). Interpretation of the data is greatly enhanced by the use of isotopic concentrations: fluxes over land and ocean can be distinguished by their carbon isotopic signal δ13C, as photosynthesis favours uptake of 12CO2 against 13CO2, while the purely physical gas exchange between the atmosphere and the ocean is isotope-indiscriminate. Thus, the contributions to global sources and sinks made by ocean vs. the land may be compared.
Initially, research groups working at global scale developed their own computational procedures to estimate fluxes from concentrations, but in the late 1990s there were strong attempts to work together (Gurney et al., 2004). Data on the global distribution of fossil fuel emissions (Boden et al., 2010) are subtracted from the calculated terrestrial fluxes to reveal an estimate of the natural carbon fluxes associated with photosynthesis, respiration and air-sea exchange. Gurney et al., (2004) and Peylin et al. (2013) have reported the results from several different models covering the periods 1992–1996 and 2002–2008 respectively (Table 6). Both results say that the northern hemisphere contains a large land sink of carbon, of order 2.0 Pg annum−1, usually attributed to the extensive areas of growing forests and plantations in the temperate and boreal regions. The uncertainty term is much lower than the estimate. But for the tropics, the uncertainty is generally similar to, or greater than, the estimate. For example, of the 11 models reported by Peylin et al. (2013) one indicates the tropics to be a land sink, four suggest the tropics to be a very weak source, and five show a source greater than 1 Pg annum−1. The main reason for the large uncertainty from the inversion result is the small number of sampling stations located in the tropics. Another possibly reason is that the biological components of carbon flux are highly sensitive to temperature and drought, and thus vary across sampling periods and across sampling space.
Table 6.
Global sources and sinks according to atmospheric inversions, not counting the fossil fuel emissions. The stated values are the mean of several models followed by ± Standard Deviation (often used as the measure of uncertainty). Units: PgC annum−1
| Authors | Period | Global | North | Tropical | South | ||||
|---|---|---|---|---|---|---|---|---|---|
| Land | Ocean | Land | Ocean | Land | Ocean | Land | Ocean | ||
| Gurney et al., (2004) | 1992–1996 | −1.4 ± 0.8 | −1.5 ± 0.8 | −2.3 ± 0.8 | −1.3 ± 0.6 | 1.1 ± 1.1 | 0.3 ± 0.5 | −0.2 ± 0.7 | −0.8 ± 0.5 |
| Peylin et al. (2013) | 2001–2004 | −1.5 ± 0.6 | −1.6 ± 0.5 | −2.2 ± 0.5 | −1.1 ± 0.3 | 0.9 ± 1.0 | 0.8 ± 0.2 | −0.1 ± 0.4 | −1.3 ± 0.3 |
Several groups have inferred fluxes from vertical profiles of concentration using aircraft (Chou et al., 2002; Lloyd et al., 2007; Gatti et al., 2010, 2014). Many such data were compiled by Stephens et al. (2007), who found evidence for a rather different balance between tropical and northern sinks: they suggested that the temperate zone is less of a sink than previously thought, while the tropics may be a significant sink.
A recent aircraft study provides insights into the behaviour of the carbon sink in the Brazilian Amazon (Gatti et al., 2014). Vertical profiles of CO2 up to 4 km showed marked differences between the burning season (July–October) when the surface concentrations were enriched by several parts per million of CO2. In the rest of the year, photosynthesis by the vegetation drew down the surface concentration below the background. By contrasting the year 2010 (a drought year) with 2011 (a more normal year), and by also measuring carbon monoxide (a marker for fire), the researchers were able to separate the impact of drought on the basic biological process and on the fire occurrence. In the drought year, the uptake of carbon dioxide by the vegetation was reduced by 0.22 PgC. Overall, the Amazon basin was changed from being more or less carbon neutral in the normal year of 2011 to being a source of 0.48 PgC of carbon in the drought year.
Sensitivity of the flux to climate change
The question of whether the carbon balance of the land surface changes from year to year, and whether there are long-term changes associated with global warming remains highly controversial since the modelling paper by Cox et al. (2000), which predicted that the rainforest would be converted to savanna as a result of warming, with the loss of substantial stocks of soil carbon, a process involving a positive feedback on global warming caused by the additional release of CO2. From a physiological viewpoint, the evidence at that time was slim, and even now there are still only a few long-term experiments that have a bearing on the issue (Wood et al., 2012). Reliance on models which make simplified assumptions without any experimental evidence seems ill-advised, as matters such as the effect of elevated CO2 on photosynthesis and the effect of warming on soil respiration in the long term are not properly established. Indeed, a recent report of model outputs tends to rebut Cox's notion: only one of 22 models suggests that tropical rain forests will decline by the end of the century (Huntingford et al., 2013). There are however a few lines of enquiry which do not rely on models, but on empirical evidence, as outlined below.
Eddy covariance data of CO2 fluxes over tropical ecosystems may be used in an attempt to investigate the sensitivity of those fluxes to changes that occur naturally as a result of changing weather patterns or seasons. Using a statistical model fitted to a very limited data set, Grace et al. (1995) found that small increases in temperature turned the forest from a modest sink of carbon to a large source, as a result of the effect of temperature on respiration, especially soil respiration. Most of studies on gas exchange of vegetation and soils have been short term, particularly those on soil respiration. For soils, longer term and larger scale observations suggest a somewhat different outcome from that obtained in short campaigns, because over a period of weeks and years the microbial populations change in a process which is (speculatively) termed ‘acclimation’ (Giardina & Ryan, 2000; Grace & Rayment, 2000; Knorr et al., 2005). This may involve shifts in the quantity and quality of the organic matter available for the microbial population (Davidson & Janssens, 2006). Perhaps new microbes with different temperature sensitivities establish a strong presence in the forest soil.
The respiratory fluxes from soil are large (Fig.2). One review of the available tropical data reported annual rates of soil respiration of 3–6 μmol CO2 m−2 s−1, equating to 11–22 MgC ha−1 annum−1 compared to typical intact forest growth rates of 2–4 t ha−1 annum−1 (Sotta et al., 2004). Some of this flux is autotrophic respiration, originating from plant roots, but about half is heterotrophic respiration arising from the microbial breakdown of organic matter (Butler et al., 2012). This breakdown releases nitrogen and phosphorus from organic compounds and so is important not only because of CO2 release but also because of the possible stimulatory role in plant nutrition. In short-term experiments (hours, days) the rate of respiration is a more or less exponential function of temperature over the normal environmental range (Lloyd & Taylor, 1994). Given that the observed temperature in the tropics has increased by about 0.5 °C since 1950, and is set to increase even more (IPCC 2007), it seems likely that carbon efflux from the soil has been increasing over the last 50 years and will continue to do so. Wood et al. (2012) draw no firm conclusions about the effect of temperature on the soil carbon efflux but instead they call for long-term field experimentation in the tropics.
Some longer term manipulation experiments do exist. There have been two long-term (at least 7 years) drought experiments in the Amazon where about half the annual rainfall was excluded by means of shelters. Nepstad et al. (2007) reported an increased mortality of trees. In a very similar but independent experiment, Da Costa et al. (2010) demonstrated that 38 MgC ha−1 were lost over seven years (i.e. 5.4 MgC ha−1 annum−1) and an increased mortality of trees occurred. Individual years of extreme drought, like 2005 and 2010, are likely to cause large carbon losses according to estimates by Phillips et al. (2010) quite apart from any direct adverse effects of associated high temperatures.
There are rather few recent attempts to measure directly the effect of changing temperature on the growth of tropical trees (Clark et al., 2013; Vlam et al., 2014). They show a decline in growth rate with increasing temperature.
Modelling the effect of rising temperature on the balance between photosynthetic uptake and respiratory losses by ecosystems is challenging because there are many processes to be considered as components of ‘ecosystem metabolism’ (Malhi, 2012): the photosynthetic uptake is likely to interact with water, nutrient and CO2 supply, while the respiratory losses involve both autotrophic and heterotrophic components which are likely to be especially sensitive to water and nutrient supply, but not in the same way as photosynthesis (Lloyd & Farquhar, 1996). The temperature effect on soil respiration over long periods appears to be quite different from the exponential relation found in short-term experiments (Giardina & Ryan, 2000; Grace & Rayment, 2000; Knorr et al., 2005). Thus, modelling is not sufficiently reliable to establish a firm link between temperature and ecosystem carbon storage.
One approach towards exploring the temperature sensitivity of the carbon cycle over the long term is to investigate carbon stocks along well-defined geographical gradients. In a meta-analysis of pan-tropical data from three continents, Raich et al. (2006) demonstrated that soil organic matter decreased by 8 MgC ha−1 for every degree Kelvin, while plant biomass increased by 5.2 MgC ha−1 K−1. The differences between these two fluxes, 2.8 MgC ha−1 K−1, may be speculatively considered to be a measure of the extent to which carbon accumulation falls with temperature in the tropics. Up-scaling this temperature coefficient to the entire area of tropical forests (including primary, secondary and plantations, about 20 million km2) suggests a carbon loss of 5.6 Pg for every degree of warming. Such a large signal should be evident in the atmospheric data. To some extent it is: Langenfelds et al. (2002) showed that the interannual variations in global atmospheric CO2 concentrations were associated fluctuations in δ13CO2, showing the importance of terrestrial vegetation in the carbon cycle. They further demonstrated that years with high CO2 were associated with high CH4, CO and H2, all gases coming from biomass burning. Later, Heimann & Reichstein (2008) showed that such high CO2 years were associated with large scale El Niňo influences. The causal processes in that case may be: El Niňo → Drought and high surface temperatures → Fire → Carbon Loss. This chain of cause-and-effect may be more important than: Warm year → High respiration and Low photosynthesis → Carbon Loss.
Models, however preliminary, provide a means to begin the integration of knowledge and to upscale the information to reveal the bigger picture. Cox et al. (2013) present the most recent attempt to use climate-carbon models to infer the sensitivity of the tropical carbon cycle to warming. Seven such models were run, and their results showed considerable scatter; however the authors were able to conclude that warming is likely to release 53 ± 17 Pg carbon per degree Kelvin over the period 1960–2099. Assuming two degrees of global warming, the annual increase in emissions would therefore be substantial, at 0.76 PgC annum−1.
Concluding remarks
The perturbations to the tropical carbon cycle brought about directly by human activities cause about two million tonnes of carbon per year to be added to the atmosphere as CO2. We have shown how this loss of carbon is more or less balanced by the strong forest sink. Based on our analysis, it is difficult to deny Pan's assertion of a ‘large and persistent carbon sink in the world's forests’ (Pan et al., 2011), although Wright has recently tried to do so (Wright, 2013). There seems little doubt that the combination of primary and secondary forest produces a sink approaching 2 PgC annum−1 in the tropics. The contribution of the secondary forests has not been fully recognized previously, and seems to have been overlooked (Wright, 2013).
To what extent is the knowledge and understanding of the tropical carbon budget now adequate as the basis for REDD and REDD+ projects? The important technical advances made recently have been in satellite remote sensing, which has delivered moderately high resolution data on forest cover change (Hansen et al., 2013) and promises to provide data on biomass from radar backscatter (Le Toan et al., 2011). Previously, the technical challenge of doing this and the inadequacy of inventory-based reporting were often cited as an obstacle to the progress of REDD+. Future developments in remote sensing, outlined above, promise additional capability to detect change at scales that are appropriate to assessment of change in the global carbon cycle and even to monitor quite small, community-based, carbon projects (Mitchard et al., 2013a,b). It remains important to make such data easily available and free to governments and land managers.
Acknowledgments
John Grace and Emanuel Gloor acknowledge support from the UK's Natural Environment Research Council through the Amazonica project (ref NE/F005040/1), and from the European FP7 project Geocarbon (ref FP7-ENV-2011, 283080). Edward Mitchard is supported by a Research Fellowship from the Natural Environment Research Council (NE/I021217/1).
References
- Achard F, Eva HG, Stigberg H-J, et al. Determination of deforestation rates of the world's humid tropical forests. Science. 2002;297:999–1002. doi: 10.1126/science.1070656. [DOI] [PubMed] [Google Scholar]
- Achten WMJ, Verchot LV. Implications of biodiesel-induced land-use changes for CO2 emissions: case studies in tropical America, Africa, and Southeast Asia. Ecology and Society. 2011;16 doi: 10.5751/ES-04403–160414. [Google Scholar]
- Alongi DM. Carbon sequestration in mangrove forests. Carbon Management. 2012;3:313–322. [Google Scholar]
- Amundson R. The carbon budget in soils. Annual Review of Earth and Planetary Science. 2001;29:535–562. [Google Scholar]
- Aragão LEOC, Malhi Y, Barbier N, et al. Interactions between rainfall, deforestation and fires during recent years in the Brazilian Amazon. Philosophical Transactions of the Royal Society of London B. 2008;363:1779–1785. doi: 10.1098/rstb.2007.0026. [DOI] [PMC free article] [PubMed] [Google Scholar]
- Aragão LEOC, Poulter B, Barlow JB, et al. Environmental change and the carbon balance of Amazonian forests. Biological Reviews. 2014 doi: 10.1111/brv.12088. doi: 10.1111/brv.12088. [DOI] [PubMed] [Google Scholar]
- Asner GP, Knapp DE, Broadbent EN, et al. Selective logging in the Brazilian Amazon. Science. 2005;310:480–482. doi: 10.1126/science.1118051. [DOI] [PubMed] [Google Scholar]
- Asner GP, Powell GVN, Mascaro J, et al. High-resolution forest carbon stocks and emissions in the Amazon. Proceedings of the National Academy of Sciences. 2010;107:16738–16742. doi: 10.1073/pnas.1004875107. [DOI] [PMC free article] [PubMed] [Google Scholar]
- Baccini A, Goetz SJ, Walker WS, et al. Estimated carbon dioxide emissions from tropical deforestation improved by carbon-density maps. Nature Climate Change. 2012;2:182–185. [Google Scholar]
- Barker T, Bashmakov I, Alharthi A, et al. Climate Change 2007, Working Group III to the 4th Assessment Report of the IPCC. Cambridge: Cambridge University Press; 2007. Mitigation from a cross-sectoral perspective; pp. 620–690. [Google Scholar]
- Batjes NH. Total carbon and nitrogen in the soils of the world. European Journal of Soil Science. 1996;47:151–163. [Google Scholar]
- Battin TJ, Luyssaert S, Kapla LA. The boundless carbon cycle. Nature Geoscience. 2009;2:598–600. [Google Scholar]
- Beer C, Markus Reichstein M, Tomelleri E, et al. Terrestrial gross carbon dioxide uptake: global distribution and covariation with climate. Science. 2010;329:834–838. doi: 10.1126/science.1184984. [DOI] [PubMed] [Google Scholar]
- Berner RA. The long-term carbon cycle, fossil fuels and atmospheric composition. Nature. 2003;426:323–326. doi: 10.1038/nature02131. [DOI] [PubMed] [Google Scholar]
- Berry NJ, Phillips OL, Lewis SL, et al. The high value of logged tropical forest: lessons from northern Borneo. Biodiversity and Conservation. 2010;19:985–997. [Google Scholar]
- Bird MI, Moyo C, Veenendaal EM, et al. Stability of elemental carbon in a savanna soil. Global Biogeochemical Cycles. 1999;13:923–932. [Google Scholar]
- Boden TA, Marland G, Andres RJ. Global, Regional, and National Fossil-Fuel CO2 Emissions. Oak Ridge, Tennessee, USA: Department of Energy, Carbon Dioxide Information Analysis Center, Oak Ridge National Laboratory; 2010. doi: 10.3334/CDIAC/00001_V2010. [Google Scholar]
- Bolin B, Keeling CD. Large-scale atmospheric mixing as deduced from the seasonal and meridional variations of carbon dioxide. Journal of Geophysical Research. 1963;68:3899–3920. [Google Scholar]
- Bombelli A, Hentry M, Castaldi S, et al. An outlook on the sub-saharan Africa carbon balance. Biogeosciences. 2009;6:2193–2205. [Google Scholar]
- Bond WJ, Woodward FI, Midgley GF. The global distribution of ecosystems in a world without fire. New Phytologist. 2005;165:525–537. doi: 10.1111/j.1469-8137.2004.01252.x. [DOI] [PubMed] [Google Scholar]
- Bond TC, Doherty SJ, Fahey DW, et al. Bounding the role of black carbon in the climate system: a scientific assessment. Journal of Geophysical Research- Atmospheres. 2013;118:5380–5552. [Google Scholar]
- Bonner MTL, Schmidt S, Shoo LP. A meta-analytical global comparison of aboveground biomass accumulation between tropical secondary forests and monoculture plantations. Forest Ecology and Management. 2013;291:73–86. [Google Scholar]
- Brown S, Lugo AE. Tropical Secondary Forests. Journal of Tropical Ecology. 1990;6:1–32. [Google Scholar]
- Butler A, Meir P, Saiz G, Maracahipes L, Marimon B, Grace J. Annual variation in soil respiration and its component parts in two structurally contrasting woody savannas in Central Brazil. Plant and Soil. 2012;352:129–142. [Google Scholar]
- Chave J, Andalo C, Brown S, et al. Tree allometry and improved estimation of carbon stocks and balance in tropical forests. Oecologia. 2005;145:87–99. doi: 10.1007/s00442-005-0100-x. [DOI] [PubMed] [Google Scholar]
- Chazdon RL. Beyond deforestation: restoring forests and ecosystem services on degraded lands. Science. 2008;320:1458–1460. doi: 10.1126/science.1155365. [DOI] [PubMed] [Google Scholar]
- Cheng CM, Wang R, Jiang JS. Variation of soil fertility and carbon sequestration by planting Hevea brasiliensis in Hainan Island, China. Journal of Environmental Sciences – China. 2007;3:348–352. doi: 10.1016/s1001-0742(07)60057-6. [DOI] [PubMed] [Google Scholar]
- Chiti T, Grieco E, Perugini L, et al. Effect of the replacement of tropical tree plantations on soil organic carbon levels in the Jomoro district, Ghana. Plant and Soil. 2014;375:47–59. [Google Scholar]
- Chokkalingam U, de Yong W. Secondary forest: a working definition. International Forestry Review. 2001;3:19–26. [Google Scholar]
- Chou WW, Wofsy SC, Harriss RC, et al. Net fluxes of CO2 in Amazonia derived from aircraft observations. Journal of Geophysical Research. 2002;107 doi: 10.1029/2001JD001295. [Google Scholar]
- Ciais P, Bousquet A, Freibauer A, Naegler T. Horizontal displacement of carbon associated with agriculture and its impacts on atmospheric CO2. Global Biogeochemical Cycles. 2007;21:GB2014. doi: 10.1029/2006GB002741. [Google Scholar]
- Ciais P, Bombelli A, Williams M, et al. The carbon balance of Africa: synthesis of recent research studies. Philosophical Transactions of the Royal Society A. 2010;369:2038–2057. doi: 10.1098/rsta.2010.0328. [DOI] [PubMed] [Google Scholar]
- Clark DA, Brown S, Kicklighter DW, et al. Net primary production in tropical forests; an evaluation and synthesis of existing field data. Ecological Applications. 2001;11:371–384. [Google Scholar]
- Clark DA, Clark DB, Oberbauer SF. Field quantified responses of tropical rainforest above-ground productivity to increasing CO2 and climate. Journal of Geophysical Research: Biogeosciences. 2013;118:1–12. [Google Scholar]
- Costa MH, Foley JA. Combined effects of deforestation and doubled atmospheric CO2 concentrations on the climate of Amazonia. Journal of Climate. 2000;13:18–34. [Google Scholar]
- Cox PM, Betts RA, Jones CD, Spall SA, Totterdell IJ. Acceleration of global warming due to carbon cycle feedbacks in a coupled climate model. Nature. 2000;408:184–187. doi: 10.1038/35041539. [DOI] [PubMed] [Google Scholar]
- Cox PM, Pearson D, Booth BB, et al. Sensitivity of tropical carbon to climate change constrained by carbon dioxide variability. Nature. 2013;494:341–345. doi: 10.1038/nature11882. [DOI] [PubMed] [Google Scholar]
- Da Costa ACL, Galbraith D, Almeida S, et al. Effect of 7 year of experimental drought on vegetation dynamics and biomass storage of an eastern Amazonian rainforest. New Phytologist. 2010;187:579–591. doi: 10.1111/j.1469-8137.2010.03309.x. [DOI] [PubMed] [Google Scholar]
- Da Costa ACL, Metcalfe DB, Doughty CE, et al. Ecosystem respiration and net primary productivity after 8–10 years of experimental through-fall reduction in an eastern Amazon forest. Plant Ecology and Diversity. 2014;7:7–24. [Google Scholar]
- Davidson EA, Janssens IA. Temperature sensitivity of soil carbon decomposition and feedbacks to climate change. Nature. 2006;440:165–173. doi: 10.1038/nature04514. [DOI] [PubMed] [Google Scholar]
- DeFries RS, Houghton RA, Hansen MC, Field CB, Skole D, Townshend J. Carbon emissions from tropical deforestation and regrowth based on satellite observations for the 1980s and 1990s. Proceedings of the National Academy of Sciences. 2002;99:256–261. doi: 10.1073/pnas.182560099. [DOI] [PMC free article] [PubMed] [Google Scholar]
- DeFries RS, Rudel T, Uriarte M, Hansen M. Deforestation driven by urban population growth and agricultural trade in the twenty-first century. Nature Geosciences. 2010;3:179–181. [Google Scholar]
- Denman KL, Brasseur G. Climate Change 2007. Cambridge: Cambridge University Press; 2007. Couplings between changes in the climate system and biogeochemistry; pp. 500–587. [Google Scholar]
- Dittmer T, Eduardo de Rezende C, Manecki M, et al. Continuous flux of dissolved black carbon from a vanished tropical forest biome. Nature Geoscience. 2012;5:618–622. [Google Scholar]
- Don A, Schumacher j, Freibauer A. Impact of tropical land-use change on soil organic carbon stocks - a meta-analysis. Global Change Biology. 2011;17:1658–1670. [Google Scholar]
- Donato DC, Kauffman JB, Murdiyarso D, et al. Mangroves are the most carbon-rich forests in the tropics. Nature Geoscience. 2011;4:293–297. [Google Scholar]
- Eclesia R, Jobbagy EG, Jackson RB, et al. Shifts in soil organic carbon for plantation and pasture establishment in native forests and grasslands of South America. Global Change Biology. 2012;18:3237–3251. doi: 10.1111/j.1365-2486.2012.02761.x. [DOI] [PubMed] [Google Scholar]
- Ehn M, Thornton JA, Kleist E, et al. A large source of low-volatility secondary organic aerosol. Nature. 2014;506:476–479. doi: 10.1038/nature13032. [DOI] [PubMed] [Google Scholar]
- Enting IG, Mansbridge JV. Seasonal sources and sinks of atmospheric CO2: direct inversion of filtered data. Tellus B. 1989;41:111–126. [Google Scholar]
- Ernst C, Mayaux P, Verghegghen A, et al. National forest cover change in Congo Basin:deforestation, reforestation, degradation and regeneration for the years 1990, 2000 and 2005. Global Change Biology. 2013;19:1173–1187. doi: 10.1111/gcb.12092. [DOI] [PubMed] [Google Scholar]
- Eswaran H, van den Berg E, Reich P. Soil organic carbon in soils of the world. Journal of the Soil Science Society of America. 1993;57:192–194. [Google Scholar]
- Falkowski P, Scholes RJ, Boyle E, et al. The global carbon cycle: a test of our knowledge of earth as a system. Science. 2000;290:291–296. doi: 10.1126/science.290.5490.291. [DOI] [PubMed] [Google Scholar]
- FAO. Rome Food and Agriculture Organization of the UN. 2000. On definitions of forest and forest change FRA working paper 33.
- FAO. Rome Food and Agriculture Organization of the UN. Global Forest resources Assessment 2010, Main Report. FAO Forestry Paper 163.2010. [Google Scholar]
- FAO. State of the World's Forests 2011. Rome: Food and Agriculture Organization of the UN; 2011. [Google Scholar]
- Fearnside PM, Pueyo S. Greenhouse gas emissions from tropical dams. Nature Climate Change. 2012;2:382–384. [Google Scholar]
- Fearnside PM, Gráça LA, Rodrigues FJA. Burning of Amazonian rainforests: burning efficiency and charcoal formation in forest cleared for cattle pasture near Manaus, Brazil. Forest Ecology and Management. 2001;146:115–128. [Google Scholar]
- Fearnside PM, Barbosa RI, Alencastro Graça PML. Burning of secondary forest in Amazonia: biomass, burning efficiency and charcoal formation during land preparation for agriculture in Apia, Roraima, Brazil. Forest Ecology and Management. 2007;242:678–687. [Google Scholar]
- Fisher MJ, Rao IM, Ayarza MA, Lascano CE, Sanz JI, Thomas RJ, Vera RR. Carbon storage by introduced deep-rooted grasses in the South American savannas. Nature. 1994;371:236–238. [Google Scholar]
- Fisher MJ, Braz SP, Dos Santos RSM, Urquiaga S, Alves BJR, Boddey RM. Another dimension to grazing systems: soil carbon. Tropical Grasslands. 2007;41:65–83. [Google Scholar]
- Fisher JI, Hurtt GC, Thomas RQ, et al. Clustered distrubances lead to bias in large scale estimates based on forest sample plots. Ecology Letters. 2008;11:554–563. doi: 10.1111/j.1461-0248.2008.01169.x. [DOI] [PubMed] [Google Scholar]
- Flores BM, Piedade M-TF, Nelson BW. Fire disturbance in Amazonian blackwater floodplain forests. Plant Ecology and Diversity. 2014;7:319–327. [Google Scholar]
- Frankenberg CP, Bergamaschi A, Butz S, et al. Tropical methane emissions: a revised view from SCIAMACHYonboard ENVISAT. Geophysical Research Letters. 2008;35:L15811. [Google Scholar]
- Friedlingstein P, Houghton RA, Marland G, et al. Update on CO2 emissions. Nature Geoscience. 2010;3:811–812. [Google Scholar]
- Friend A, Arneth A, Kiang N, et al. FLUXNET and modelling the global carbon cycle. Global Change Biology. 2007;13:610–633. [Google Scholar]
- Galan de Mera AG, Perea EL, de la Cruz JC, et al. Plant communities linked with human environments in southern Peru. Phytocoenologia. 2012;41:265–305. [Google Scholar]
- Galbraith D, Malhi Y, Affum-Baffoe K, et al. Residence times of woody biomass in tropical forests. Plant Ecology and Diversity. 2013;6:139–157. [Google Scholar]
- Gatti LV, Miller JB, D'Amelio MTS, et al. Vertical profiles of CO2 above eastern Amazonia suggest a net carbon flux to the atmosphere and balanced biosphere between 2000 and 2009. Tellus Series B. 2010;62:581–594. [Google Scholar]
- Gatti LV, Gloor M, Miller JB, et al. Atmospheric CO2 measurements reveal strong drought sensitivity of Amazonian carbon balance. Nature. 2014;506:76–80. doi: 10.1038/nature12957. [DOI] [PubMed] [Google Scholar]
- Giardina CP, Ryan MG. Evidence that decomposition rates of organic carbon in mineral soil do not vary with temperature. Nature. 2000;404:858–861. doi: 10.1038/35009076. [DOI] [PubMed] [Google Scholar]
- Gibbs HK, Brown S, Niles JO, Foley JA. Monitoring and estimating tropical carbon stocks: making REDD a reality. Environmental Research Letters. 2007;2 doi: 10.1088/1748-9326/2/4/045023. [Google Scholar]
- Gibbs HK, Johnston M, Foley JA, et al. Carbon payback times for crop-based biofuel expansion in the tropics: the effects of changing yield and technology. Environmental Research Letters. 2008 doi: 10.1088/1748-9326/3/3/034001. [Google Scholar]
- Gloor M, Phillips OL, Lloyd J, et al. Does the disturbance hypothesis explain the biomass increase in basin-wide Amazon forest plot data? Global Change Biology. 2009;15:2418–2430. [Google Scholar]
- Gloor M, Gatti L, Brienen R, et al. The carbon balance of South America: a review of the status, decadal trends and main determinants. Biogeosciences. 2012;9:5407–5430. [Google Scholar]
- GOFC-GOLD. A sourcebook of methods and procedures for monitoring and reporting anthropogenic greenhouse gas emissions and removals caused by deforestation, gains and losses of carbon stocks in forests remaining forests, and forestation. 2010. GOFC-GOLD Report version COP16-1, (GOFC-GOLD Project Office, Natural Resources Canada, Alberta, Canada). Available at: http://www.gofc-gold.uni-jena.de/redd/sourcebook/Sourcebook_Version_Nov_2010_cop16-1.pdf (accessed 27 May 2014)
- Grace J, Malhi Y. Global change: carbon dioxide goes with the flow. Nature. 2002;594:594–595. doi: 10.1038/416594b. [DOI] [PubMed] [Google Scholar]
- Grace J, Rayment M. Respiration in the balance. Nature. 2000;404:819–820. doi: 10.1038/35009170. [DOI] [PubMed] [Google Scholar]
- Grace J, Lloyd J, McIntyre J, et al. Carbon dioxide uptake by an undisturbed tropical rain forest in South-West Amazonia 1992–1993. Science. 1995;270:778–780. [Google Scholar]
- Grace J, San Jose J, Meir P, et al. Productivity and carbon fluxes of tropical savannas. Journal of Biogeography. 2006;33:387–400. [Google Scholar]
- Grainger A. Difficulties in tracking the long-term global trend in tropical forest area. Proceedings of the National Academy of Sciences of the United States of America. 2008;105:818–823. doi: 10.1073/pnas.0703015105. [DOI] [PMC free article] [PubMed] [Google Scholar]
- Guo LB, Gifford RM. Soil carbon stocks and land use change. Global Change Biology. 2002;8:345–360. [Google Scholar]
- Gurney KR, Law RM, Denning AS, et al. Towards robust regional estimates of CO2 sources and sinks using atmospheric transport models. Nature. 2004;415:626–630. doi: 10.1038/415626a. [DOI] [PubMed] [Google Scholar]
- Hansen MC, Stehman SV, Potapov PV. Quantification of global gross forest cover. Proceedings of the National Academy of Sciences. 2010;107:8650–8655. doi: 10.1073/pnas.0912668107. [DOI] [PMC free article] [PubMed] [Google Scholar]
- Hansen MC, Potapov PV, Moore R, et al. High-resolution global maps of 21st-century forest cover change. Science. 2013;342:850–853. doi: 10.1126/science.1244693. [DOI] [PubMed] [Google Scholar]
- Heimann M, Reichstein M. Terrestrial ecosystem carbon dynamics and climate feedbacks. Nature. 2008;451:289–292. doi: 10.1038/nature06591. [DOI] [PubMed] [Google Scholar]
- Hooijer A, Page S, Canadell JG, Silvius M, Kwadijk J, Wösten H, Jauhiainen J. Current and future CO2 emissions from drained peatlands in Southeast Asia. Biogeosciences. 2010;7:1505–1514. [Google Scholar]
- Hooijer A, Page SE, Canadell JG, et al. Subsidence and carbon loss in drained tropical peatlands. Biogeosciences. 2012;9:1053–1071. [Google Scholar]
- Houghton R, Werf GVD, DeFries R, et al. Carbon emissions from land use and land-cover change. Biogeosciences. 2012;9:5125–5142. [Google Scholar]
- House JI, Prentice IC, Ramankutty N, et al. Reconciling apparent inconsistencies in estimates of terrestrial CO2 sources and sinks. Tellus Series B Chemical and Physical Meteorology. 2003;55:345–363. [Google Scholar]
- Huntingford C, Zelazowski P, Galbraith D, et al. Simulated resilience of tropical rainforests to CO2-induced climate change. Nature Geoscience. 2013;6:268–273. [Google Scholar]
- INPE. Monitoring of the Brazilian Amazonian forest by satellite—2002. 2003. p. 16.
- IPCC. IPCC Fourth Assessment Report: Climate Change 2007 (AR4) Cambridge: Cambridge University Press; 2007. [Google Scholar]
- Jacobson AR, Fletcher SEM, Gruber N, et al. A joint atmosphere-ocean inversion for surface fluxes of carbon dioxide: 2 Regional results. Global Biogeochemical Cycles. 2007;21 doi: 10.1029/2006GB002703. [Google Scholar]
- Juo ASR, Franzluebbers K, Dabiri A, Ikhile B. Changes in soil properties during long-term fallow and continuous cultivation after forest clearing in Nigeria. Agriculture Ecosystems and Environment. 1995;56:9–18. [Google Scholar]
- Kenzo T, Ichie T, Hattori D, et al. Development of allometric relationships for accurate estimation of above- and below-ground biomass in tropical secondary forests in Sarawak, Malaysia. Journal of Tropical Ecology. 2009;25:371–386. [Google Scholar]
- Kirschke S, Bousquet P, Ciais P, et al. Three decades of global methane sources and sinks. Nature Geoscience. 2013;6:813–823. [Google Scholar]
- Knorr W, Prentice IC, House JI, Holland EA. Long-term sensitivity of soil carbon turnover to warming. Nature. 2005;433:298–301. doi: 10.1038/nature03226. [DOI] [PubMed] [Google Scholar]
- Koh LP, Wilcove DS. Is oil palm agriculture really destroying tropical biodiversity? Conservation Letters. 2008;1:1–5. [Google Scholar]
- Kraenzel M, Castillo A, Moore T, et al. Carbon storage of harvest-age teak (Tectona grandis) plantations, Panama. Forest Ecology and Management. 2003;173:213–225. [Google Scholar]
- Kristensen E, Bouillon S, Dittmar T, et al. Organic carbon dynamics in mangrove ecosystems: a review. Aquatic Botany. 2008;89:201–219. [Google Scholar]
- Kruijt B, Elbers JA, von Randow C, et al. The robustness of eddy correlation fluxes for Amazon rain forest conditions. Ecological Applications. 2004;14:S101–S113. [Google Scholar]
- Kuhlbusch TAJ, Crutzen PJ. Black carbon, the global carbon cycle, and atmospheric carbon dioxide. In: Levine JS, editor. Biomass Burning and Global Change. Cambridge, MA, USA: MIT Press; 1996. pp. 160–169. [Google Scholar]
- Krner C, Arnone JA. Responses to elevated carbon-dioxide in artificial tropical ecosystems. Science. 1992;257:1672–1675. doi: 10.1126/science.257.5077.1672. [DOI] [PubMed] [Google Scholar]
- Laclau J-P, Bouillet J-P, Ranger J. Dynamics of biomass and nutrient accumulation in a clonal plantation of Eucalyptus in Congo. Forest Ecology and Management. 2000;128:181–196. [Google Scholar]
- Lambin EF, Geist HJ, Lepers E. Dynamics of Land-use and land-cover change in tropical regions. Annual Review of Environmental Resources. 2003;28:205–241. [Google Scholar]
- Langenfelds RL, Francey RJ, Pak BC, et al. Interannual growth rate variations of atmospheric CO2 and its δ13C, H2, CH4, and CO between 1992 and 1999 linked to biomass burning. Global Biogeochemical Cycles. 2002;16:1048. [Google Scholar]
- Laurance WF. Gaia's lungs: are the rainforests inhaling earth's excess carbon dioxide? Natural History. 1999;108:96. [Google Scholar]
- Le Toan T, Quegan S, Davidson MWJ, et al. The BIOMASS mission: mapping global forest biomass to better understand the terrestrial carbon cycle. Remote Sensing of the Environment. 2011;115:2850–2860. [Google Scholar]
- Lean J, Warringlow D. Climatic impact of Amazonian deforestation. Nature. 1989;342:311–413. [Google Scholar]
- Lewis SL, Lopez-Gonzalez G, Sonke B, et al. Increasing carbon storage in intact African tropical forests. Nature. 2009;457:1003–1006. doi: 10.1038/nature07771. [DOI] [PubMed] [Google Scholar]
- Li H, Aide TM, Ma Y, et al. Demand for rubber is causing the loss of high diversity rain forest in SW China. Biodiversity and Conservation. 2007;16:1731–1745. [Google Scholar]
- Li H, Ma Y, Aide TM, Liu WJ. Past, present and future land-use in Xishuangbanna, China and the implications for carbon dynamics. Forest Ecology and Management. 2008;255:16–24. [Google Scholar]
- Lieth H, Box EO. The gross primary productivity pattern of the land vegetation: a first attempt. Tropical Ecology. 1977;18:109–115. [Google Scholar]
- Lloyd J. The CO2 dependence of photosynthesis, plant growth responses to elevated CO2 concentrations and their interaction with soil nutrient status, II. Temperate and boreal forest productivity and the combined effects of increasing CO2 concentrations and increased nitrogen deposition at a global scale. Functional Ecology. 2002;13:439–459. [Google Scholar]
- Lloyd J, Farquhar GD. The CO2 dependence of photosynthesis, plant growth responses to elevated atmospheric CO2 concentrations and their interaction with soil nutrient status. 1. General principles and forest ecosystems. Functional Ecology. 1996;10:4–32. [Google Scholar]
- Lloyd J, Taylor JA. On the temperature dependence of soil respiration. Functional Ecology. 1994;13:315–323. [Google Scholar]
- Lloyd J, Kolle O, Fritsch H, et al. An airborne regional carbon balance for central Amazonia. Biogeosciences. 2007;4:759–768. [Google Scholar]
- Lloyd J, Bird MI, Vellen L, et al. Contributions of woody and herbaceous vegetation to tropical ecosystem productivity: a quasi-global estimate. Tree Physiology. 2008;28:451–468. doi: 10.1093/treephys/28.3.451. [DOI] [PubMed] [Google Scholar]
- Lloyd J, Gloor EU, Lewis SL. Are the dynamics of tropical forests dominated by large and rare disturbance events? Ecology Letters. 2009;12:19–21. doi: 10.1111/j.1461-0248.2009.01326.x. [DOI] [PubMed] [Google Scholar]
- Long SP, Moya EG, Imbamba SK, et al. Primary productivity of natural grass ecosystems in the tropics: a reappraisal. Plant and Soil. 1989;115:155–166. [Google Scholar]
- Lucas RM, Honzak M, Curran PJ, et al. Mapping the regional extent of tropical forest regeneration stages in the Brazilian Legal Amazon using NOAA AVHRR data. International Journal of Remote Sensing. 2000;21:2855–2881. [Google Scholar]
- Luyssaert S, Inglima I, Jung M, et al. CO2 balance of boreal, temperate, and tropical forests derived from a global database. Global Change Biology. 2007;13:2509–2537. [Google Scholar]
- Luyssaert S, Schulze ED, Börner A, et al. Old-growth forests as global carbon sinks. Nature. 2008;455:213–215. doi: 10.1038/nature07276. [DOI] [PubMed] [Google Scholar]
- Malhi Y. The productivity, metabolism and carbon cycle of tropical forest vegetation. Journal of Ecology. 2012;100:65–75. [Google Scholar]
- Malhi Y, Phillips OL, Lloyd J, et al. An international network to monitor the structure, composition and dynamics of Amazonian forests (RAINFOR) Journal of Vegetational Science. 2002;13:439–450. [Google Scholar]
- Marin-Spoitta E, Sharma S. Carbon storage in successional and plantation forest soils: a tropical analysis. Global Ecology and Biogeography. 2013;22:105–117. [Google Scholar]
- Martin PA, Newton AC, Bullock JM, James M. Carbon pools recover more quickly than plant biodiversity in tropical secondary forests. Proceedings of the Royal Society B. 2013;280 doi: 10.1098/rspb.2013.2236. doi: 10.1098/rspb.2013.2236. [DOI] [PMC free article] [PubMed] [Google Scholar]
- Mayaux P, Achard F, Malingreau J-P. Global tropical forest area measurements derived from coarse resolution satellite imagery: a comparison with other approaches. Environmental Conservation. 1998;25:37–52. [Google Scholar]
- Mayaux P, Pekel J-F, Desclée B, et al. State and evolution of the African rainforests between 1990 and 2010. Philosophical Transactions of the Royal Society B. 2013;368:20120300. doi: 10.1098/rstb.2012.0300. [DOI] [PMC free article] [PubMed] [Google Scholar]
- Medvigy D, Walko RL, Avissar R. Effects of deforestation on spatiotemporal distributions of precipitation in South America. Journal of Climate. 2011;24:2147–2163. [Google Scholar]
- Meir P, Woodward FI. Amazonian rain forests and drought: response and vulnerability. New Phytologist. 2010;187:553–557. doi: 10.1111/j.1469-8137.2010.03390.x. [DOI] [PubMed] [Google Scholar]
- Miranda AC, Miranda HS, Lloyd J, et al. Fluxes of carbon, water and energy over Brazilian cerrado: an analysis using eddy covariance and stable isotopes. Plant Cell and Environment. 1997;20:315–328. [Google Scholar]
- Mitchard ETA, Flintrop CM. Woody encroachment and forest degradation in sub-Saharan Africa's woodlands and savannas 1982–2006. Philosophical Transactions of the Royal Society B. 2013;368:1625. doi: 10.1098/rstb.2012.0406. [DOI] [PMC free article] [PubMed] [Google Scholar]
- Mitchard ETA, Saatchi SS, Woodhouse IH. Using satellite radar backscatter to predict above-ground woody biomass: a consistent relationship across four different African landscapes. Geophysical Research Letters. 2009;36 doi: 10.1029/2009GL040692. [Google Scholar]
- Mitchard ETA, Meir P, Ryan CM, et al. A novel application of satellite radar data: measuring carbon sequestration and detecting degradation in a community forestry project in Mozambique. Plant Ecology and Diversity. 2013a;6:159–170. [Google Scholar]
- Mitchard ETA, Saatchi SS, Baccini A, Asner GP, Goetz SJ, Harris NL, Brown S. Uncertainty in the spatial distribution of tropical forest biomass: a comparison of pan-tropical maps. Carbon Balance and Managment. 2013b;8:10. doi: 10.1186/1750-0680-8-10. [DOI] [PMC free article] [PubMed] [Google Scholar]
- Montoya E, Rull V. Gran Sabana fires (SE Venezuela): a paleoecological perspective. Quaternary Science Reviews. 2011;30:3430–3444. [Google Scholar]
- Moore S, Evans CD, Page SE, et al. Deep instability of deforested tropical peatlands revealed by fluvial organic carbon fluxes. Nature. 2013;493:660. doi: 10.1038/nature11818. [DOI] [PubMed] [Google Scholar]
- Nabuurs GJ, Masera O, Andras K, et al. Climate Change 2007, Working Group III to the 4th Assessment Report of the IPCC. Cambridge: Cambridge University Press; 2007. Forestry. [Google Scholar]
- Nambiar EKS. Site Management and Productivity in Tropical Plantation Forests. 2008. Proceedings of Workshops in Piracicaba (Brazil) 22-26 November 2004 and Bogor (Indonesia) 6-9 November 2006, Center for InternationalForestry Research (CIFOR), Bogor, Indonesia.
- Nepstad DC, Verissimo A, Alencar A, et al. Large-scale impoverishment of Amazonian forests by logging and fire. Nature. 1999;398:505–508. [Google Scholar]
- Nepstad DC, Tohver IM, Ray D, Moutinho P, Cardinot G. Mortality of large trees and lianas following experimental drought in an Amazon forest. Ecology. 2007;88:2259–2269. doi: 10.1890/06-1046.1. [DOI] [PubMed] [Google Scholar]
- Obidzinski K, Andriani R, Komarudin H, Andrianto A. Environmental and social impacts of oil palm plantations and their implications for biofuel production in Indonesia. Ecology and Society. 2012;17:25. [Google Scholar]
- Odum EP. The strategy of ecosystem development. Science. 1966;164:262–270. doi: 10.1126/science.164.3877.262. [DOI] [PubMed] [Google Scholar]
- Orihuela-Blemonte DE, de Jong BHJ, Mendoza-Vega J, et al. Carbon stocks and accumulation rates in tropical secondary forests at the scale of community, landscape and forest types. Agriculture, Ecosystems and Environment. 2013;171:72–84. [Google Scholar]
- Page SE, Siegert F, Rieley JO, Boehm HDV, Jaya A, Limin S. The amount of carbon released from peat and forest fires in Indonesia during 1997. Nature. 2002;420:61–65. doi: 10.1038/nature01131. [DOI] [PubMed] [Google Scholar]
- Page SE, Reiley JO, Banks CTJ. Global and regional importance of the tropical peatland carbon pool. Global Change Biology. 2011;17:798–818. [Google Scholar]
- Pan Y, Birdsey R, Fang J, et al. A large and persistent carbon sink in the world's forests. Science. 2011;333:988–993. doi: 10.1126/science.1201609. [DOI] [PubMed] [Google Scholar]
- Patra PK, Canadell JG, Houghton RA, et al. The carbon budget of South Asia. Biogeosciences. 2013;10:513–527. [Google Scholar]
- Penman J, Gytarsky M, Hiraishi T, et al. Good Practice Guidance for Land Use, Land-Use Change and Forestry. Cambridge: Cambridge University Press; 2003. IPCC National Greenhouse Gas Inventories Programme. [Google Scholar]
- Peylin P, Law RM, Gurney KR, et al. Global atmospheric carbon budget: results from an ensemble of atmospheric CO2 inversions. Biogeosciences Discussions. 2013;10:5301–5360. [Google Scholar]
- Phillips OL, Malhi Y, Higuchi N, et al. Changes in the carbon balance of tropical forests: evidence from long-term plots. Science. 1998;282:439–442. doi: 10.1126/science.282.5388.439. [DOI] [PubMed] [Google Scholar]
- Phillips O, Malhi Y, Vinceti B, et al. Changes in the growth of tropical forests: evaluating potential biases. Ecological Applications. 2002;12:576–587. [Google Scholar]
- Phillips OL, van der Heijden G, Lewis SL, et al. Drought–mortality relationships for tropical forests. New Phytologist. 2010;187:631–646. doi: 10.1111/j.1469-8137.2010.03359.x. [DOI] [PubMed] [Google Scholar]
- Quegan ST, Le Toan JJ, Yu F, Ribbes F, Floury N. Multitemporal ERS SAR analysis applied to forest monitoring. IEEE Transactions on Geoscience and Remote Sensing. 2000;38:741–753. [Google Scholar]
- Raich JW, Russell AE, Kitayama K, Parton WJ, Vitousek PM. Temperature influences carbon accumulation in moist tropical forests. Ecology. 2006;87:76–87. doi: 10.1890/05-0023. [DOI] [PubMed] [Google Scholar]
- Ramankutty N, Evan AT, Monfreda C, Foley JA. Farming the planet 1. Geographical distribution of global agricultural lands in the year 2000. Global Biogeochemical Cycles. 2008;22 doi: 10.1029/2007GB002952. [Google Scholar]
- Reay D, Smith P, van Amstel A. Methane and Climate Change. London: Earthscan; 2010. [Google Scholar]
- Reich J, Souza CM, Hoekman DH, et al. Feature level fusion of multi-temporal ALOS PALSAR and Landsat data for mapping and monitoring of tropical deforestation and forest degradation. IEEE Journal of Selected Topics in Applied Earth Observations and Remote Sensing. 2013;6:2159–2173. [Google Scholar]
- Ribeiro SC, Fehrmann L, Soares CPB. Above- and below-ground biomass in a Brazilian Cerrado. Forest Ecology and Management. 2011;262:491–499. [Google Scholar]
- Richey JE, Melack JM, Aufdenkampe AK, et al. Outgassing from Amazonian rivers and wetlands as a large tropical source of atmospheric CO2. Nature. 2002;416:617–620. doi: 10.1038/416617a. [DOI] [PubMed] [Google Scholar]
- Rosenthal Y. Variation of ecosystem gas exchange in the rain forest mesocosm at Biosphere 2 in response to elevated CO2. Global Change Biology. 1998;4:539–547. [Google Scholar]
- Roy J, Saugier B, Mooney HA. Terrestrial Global Productivity. San Diego: Academic Press; 2001. [Google Scholar]
- Ryan CM, Williams M, Grace J. Above- and belowground carbon stocks in a Miombo woodland landscape of Mozambique. Biotropica. 2011;43:423–432. [Google Scholar]
- Ryan CM, Hill T, Woollen E, et al. Quantifying small-scale deforestation and forest degradation in African woodlands using radar imagery. Global Change Biology. 2012;18:243–257. [Google Scholar]
- Saatchi SS, Harris NL, Brown S, et al. Benchmark map of forest carbon stocks in tropical regions across three continents. Proceedings of the National Academy of Sciences of the United States of America. 2011;108:9899–9904. doi: 10.1073/pnas.1019576108. [DOI] [PMC free article] [PubMed] [Google Scholar]
- Saiz G, Bird MI, Domingues T, et al. Variation in soil carbon stocks and their determinants across a precipitation gradient in West Africa. Global Change Biology. 2012;18:1670–1683. [Google Scholar]
- Saleska SR, Miller SD, Matross DM, et al. Carbon in amazon forests: unexpected seasonal fluxes and disturbance-induced losses. Science. 2003;302:1554–1557. doi: 10.1126/science.1091165. [DOI] [PubMed] [Google Scholar]
- Saleska S, Da Rocha H, Kruijt B, Nobre A. Ecosystem carbon fluxes and amazonian forest metabolism. In: Keller M, Bustamante M, Gash J, Dias PS, editors. Amazonia and Global Change. Washington, DC, USA: American Geophysical Union; 2009. pp. 389–407. Geophysical Monograph Series 186. [Google Scholar]
- Salinas N, Malhi Y, Meir P. The sensitivity of tropical leaf litter decomposition to temperature: results from a large-scale leaf translocation experiment along an elevation gradient in Peruvian forests. New Phytologist. 2011;189:967–977. doi: 10.1111/j.1469-8137.2010.03521.x. [DOI] [PubMed] [Google Scholar]
- San José JJ, Montes RA. Management effects on carbon stocks and fluxes across the Orinoco savannas. Forest Ecology and Management. 2001;150:293–311. [Google Scholar]
- San José JJ, Montes RA, Grace J, et al. Land-use changes alter CO2 flux patterns of a tall-grass Andropogon field and a savanna-woodland continuum in the Orinoco lowlands. Tree Physiology. 2003;28:437–450. doi: 10.1093/treephys/28.3.437. [DOI] [PubMed] [Google Scholar]
- Sankaran M, Hanan NP, Scholes RJ, et al. Determinants of woody cover in African savannas. Nature. 2005;438:846–849. doi: 10.1038/nature04070. [DOI] [PubMed] [Google Scholar]
- Santos AJB, Silva GTDA, Miranda HS, et al. Effects of fire on surface carbon, energy and water vapour fluxes over campo sujo savanna in central Brazil. Functional Ecology. 2003;17:711–719. [Google Scholar]
- Santos AJB, Quesada CA, Da Silva GT, et al. High rates of net ecosystem carbon assimilation by Brachiara pasture in the Brazilian Cerrado. Global Change Biology. 2004;10:877–885. [Google Scholar]
- Sarmiento JL, Gloor M, Gruber N, et al. Trends and regional distributions of land and ocean carbon sinks. Biogeosciences. 2010;7:2351–1367. [Google Scholar]
- Scholes RJ, Archibald S, von Maltitz G. Emissions from fire in sub-saharan Africa: the magnitude of sources, their variability and uncertainty. Global Environmental Research. 2011;15:53–63. [Google Scholar]
- Scurlock JMO, Olson RJ. Terrestrial net primary productivity - A brief history and a new worldwide database. Environmental Reviews. 2002;10:91–109. [Google Scholar]
- Seiler W, Crutzen PJ. Estimates of gross and net fluxes of carbon between the biosphere and the atmosphere from biomass burning. Climate Change. 1980;2:207–247. [Google Scholar]
- Shukla J, Nobre CA, Sellers P. Amazonia deforestation and climate change. Science. 1990;247:1322–1325. doi: 10.1126/science.247.4948.1322. [DOI] [PubMed] [Google Scholar]
- Sierra CA, del Valle J, Restrepo H. Total carbon accumulation in a tropical forest landscape. Carbon Balance and Management. 2012;7 doi: 10.1186/1750-0680-7-12. doi: 10.1186/1750-0680-7-12. [DOI] [PMC free article] [PubMed] [Google Scholar]
- Silva CAR, Lacerda LD, Silva LFF, Rezende CE. Forest structure and biomass distribution in a red mangrove stand in Sepetiba Bay, Rio de Janeiro. Revista Brasileira de Botânica. 1991;14:21–25. [Google Scholar]
- Silva JMN, Carreiras JMB, Rosa I, Pereira JMC. Greenhouse gas emissions from shifting cultivation in the tropics, including uncertainty and sensitivity analysis. Journal of Geophysical Research – Atmospheres. 2011;116 doi: 10.1029/2011JD016056. [Google Scholar]
- Sombroek WG, Nachtergaete FO, Hebel A. Amounts, dynamics and sequestering of carbon in tropical and subtropical soils. Ambio. 1993;22:417–426. doi: 10.1007/s13280-021-01508-y. [DOI] [PMC free article] [PubMed] [Google Scholar]
- Song Q-H, Tan Z-H, Zhang Y-P, et al. Do the rubber plantations in tropical China act as large carbon sinks? I-forest. 2013 doi: 10.3832/ifor0891-007. [Google Scholar]
- Sotta ED, Meir P, Malhi Y, Nobre AD, Hodnett M. Soil CO2 efflux in a tropical forest in the central Amazon. Global Change Biology. 2004;10:601–617. [Google Scholar]
- Stape JL, Binkley D, Ryan MG, et al. The Brazil Eucalyptus potential productivity project: influence of water, nutrients and stand uniformity on wood production. Forest Ecology and Management. 2010;259:1684–1694. [Google Scholar]
- Stephens BB, Gurney KR, Tans PP, et al. Weak northern and strong tropical land carbon uptake from vertical profiles of atmospheric CO2. Nature. 2007;316:1732–1743. doi: 10.1126/science.1137004. [DOI] [PubMed] [Google Scholar]
- Tamooh F, Huxham M, Karachi M, et al. Below-ground root yield and distribution in natural and replanted mangrove forests at Gazi bay, Kenya. Forest Ecology and Management. 2008;256:1290–1297. [Google Scholar]
- Tans PP, Conway TJ, Nakazawa T. Latitudinal distribution of the sources and sinks of atmospheric carbon dioxide from surface observations and an atmospheric transport model. Journal of Geophysical Research. 1989;94:5151–5172. [Google Scholar]
- Tollefson J. Experiment aims to steep rainforest in carbon dioxide. Nature. 2013;496:405–406. doi: 10.1038/496405a. [DOI] [PubMed] [Google Scholar]
- Vågen TG, Lal R, Singh BR. Soil carbon sequestration in sub-Saharan Africa: a review. Land Degradation and Development. 2005;16:53–71. [Google Scholar]
- Valentini R, Arneth A, Bombelli A, et al. The full greenhouse gases budget of Africa: synthesis, uncertainties and vulnerabilities. Biogeosciences Discussions. 2013;10:8343–8413. [Google Scholar]
- Van der Werf GR, Randerson JT, Collatz GJ, Giglio L. Carbon emissions from fires in tropical and subtropical ecosystems. Global Change Biology. 2003;9:547–562. [Google Scholar]
- Van der Werf GR, Morton DC, DeFries RS, et al. CO2 emissions from forest loss. Nature Geoscience. 2009;2:737–738. [Google Scholar]
- Vecchi GA, Soden BJ, Wittenberg AT, et al. Weakening of tropical Pacific atmospheric circulation due to anthropogenic forcing. Nature. 2006;441:73–76. doi: 10.1038/nature04744. [DOI] [PubMed] [Google Scholar]
- Veenendaal EM, Kolle O, Lloyd J. Seasonal variation in energy fluxes and carbon dioxide exchange for a broad-leaved semi-arid savanna (Mopane woodland) in Southern Africa. Global Change Biology. 2004;10:318–328. [Google Scholar]
- Vlam M, Baker PJ, Bunyavejchewin S, Zuidema PA. Temperature and rainfall strongly drive temporal growth variation in Asian tropical forest trees. Oecologia. 2014;2174:1449–1461. doi: 10.1007/s00442-013-2846-x. [DOI] [PubMed] [Google Scholar]
- Voldoire A, Royer JF. Tropical deforestation and climate variability. Climate Dynamics. 2004;22:857–874. [Google Scholar]
- Werth D, Avissar R. The local and global effects of Amazon deforestation. Journal of Geophysical Research- Atmospheres. 2002;107 doi: 10.1029/2001JD000717. [Google Scholar]
- Whitney BS, Dickau R, Mayle FE, et al. Pre-Columbian raised-field agriculture and land use in the Bolivian Amazon. Holocene. 2014;24:231–241. [Google Scholar]
- Williams CA, Hanan NP, Neff JC, et al. Africa and the global carbon cycle. Carbon Balance and Management. 2007;2 doi: 10.1186/1750-0680-2-3. doi: 10.1186/1750-0680-2-3. [DOI] [PMC free article] [PubMed] [Google Scholar]
- Wood TE, Cavaleri MA, Reed SC. Tropical forest carbon balance in a warmer world: a critical review spanning microbial- to ecosystem-scale processes. Biological Reviews. 2012;87:912–927. doi: 10.1111/j.1469-185X.2012.00232.x. [DOI] [PubMed] [Google Scholar]
- Woodhouse IH, Mitchard ETA, Brolly M, Maniatis D, Ryan CM. Radar backscatter is not a ‘direct measure’ of forest biomass. Nature Climate Change. 2012;2:556–557. [Google Scholar]
- Wright SJ. The carbon sink in intact tropical forests. Global Change Biology. 2013;19:337–339. doi: 10.1111/gcb.12052. [DOI] [PubMed] [Google Scholar]
- Yonekura Y, Ohta S, Kiyono Y, et al. Dynamics of soil carbon following destruction of tropical rainforest and the subsequent establishment of Imperata grassland in Indonesian Borneo using stable carbon isotopes. Global Change Biology. 2012;18:2606–2616. [Google Scholar]
- Zhai DL, Zhai D-L, Cannon CH, et al. Rubber and pulp plantations represent a double threat to Hainan's natural tropical forests. Journal of Environmental Management. 2012;96:64–73. doi: 10.1016/j.jenvman.2011.10.011. [DOI] [PubMed] [Google Scholar]
- Ziegler AD, Phelps J, Yuen JQ, et al. Carbon outcomes of major land-cover transitions in SE Asia: great uncertainties and REDD plus policy implications. Global Change Biology. 2012;18:3087–3099. doi: 10.1111/j.1365-2486.2012.02747.x. [DOI] [PubMed] [Google Scholar]
- Zimmerman BL, Kormos CF. Prospects for sustainable logging in tropical forests. BioScience. 2012;62:479–487. [Google Scholar]