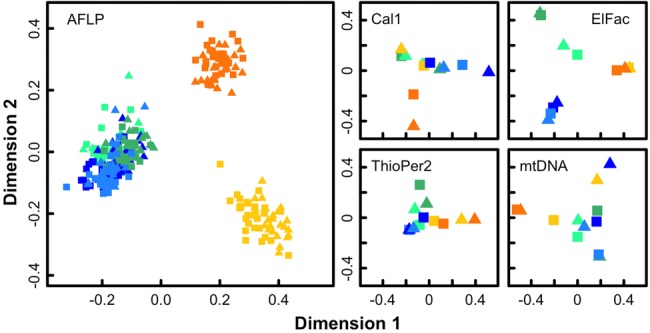
Figure 2.

Multidimensional scaling plots for the AFLP data (left, using individual relatedness) and each of the sequence datasets (right, using ΦST between samples). Symbols: wave ecotype—triangles, crab ecotype—squares; Spain—orange, Britain—green, Sweden—blue symbols; Northern site—light shade, Southern site—dark shade.
