

Abstract
Cognitive abilities vary among people. About 40–50% of this variability is due to general intelligence (g), which reflects the positive correlation among individuals' scores on diverse cognitive ability tests. g is positively correlated with many life outcomes, such as education, occupational status and health, motivating the investigation of its underlying biology. In psychometric research, a distinction is made between general fluid intelligence (gF) – the ability to reason in novel situations – and general crystallized intelligence (gC) – the ability to apply acquired knowledge. This distinction is supported by developmental and cognitive neuroscience studies. Classical epidemiological studies and recent genome-wide association studies (GWASs) have established that these cognitive traits have a large genetic component. However, no robust genetic associations have been published thus far due largely to the known polygenic nature of these traits and insufficient sample sizes. Here, using two GWAS datasets, in which the polygenicity of gF and gC traits was previously confirmed, a gene- and pathway-based approach was undertaken with the aim of characterizing and differentiating their genetic architecture. Pathway analysis, using genes selected on the basis of relaxed criteria, revealed notable differences between these two traits. gF appeared to be characterized by genes affecting the quantity and quality of neurons and therefore neuronal efficiency, whereas long-term depression (LTD) seemed to underlie gC. Thus, this study supports the gF–gC distinction at the genetic level and identifies functional annotations and pathways worthy of further investigation.
Keywords: Crystallized intelligence, fluid intelligence, gene-based analysis, GWAS, pathway analysis
A large proportion (40–50%) of interindividual variability in cognitive abilities is due to general intelligence (g), a quantitative trait that reflects the positive correlation among an individual's scores on diverse cognitive ability tests (Deary 2012; Spearman 1904). A high g score is associated with many favorable life outcomes (Deary & Batty 2011). Psychometric research distinguishes between general fluid intelligence (gF) – the ability to reason in novel situations – and general crystallized intelligence (gC) – the ability to apply acquired knowledge and learned skills (Carroll 1993; Cattell 1963). Although gF and gC are correlated at least 50% based on twin studies (Wainwright et al. 2005) and more so early and late in life (Li et al. 2004), developmental and cognitive neuroscience studies largely support the distinction between them. In normal aging, gF declines earlier and more rapidly than gC (Craik & Bialystok 2006; Salthouse 2004); in development, measures of verbal (gC) and non-verbal (gF) intelligence correlate differently with changes in brain structure (Ramsden et al. 2011). Furthermore, gF is closely associated with fronto-parietal and anterior cingulate brain networks, whereas gC is dependent on posterior frontal and temporal regions (Barbey et al. 2012; Glascher et al. 2009; Jung & Haier 2007; Woolgar et al. 2010). Finally, at the population level, large gains in performance have been observed for tests that are strongly associated with gF, but not with gC (Flynn 2007).
More than half of the variability in intelligence tests is attributable to additive genetic effects (Deary et al. 2009a; Lee et al. 2010; Plomin & Spinath 2004). In a recent genome-wide association study (GWAS), 40% and 51% of the phenotypic variability in gC and gF, respectively, could be accounted for by genetic variants in linkage disequilibrium (LD) with common single nucleotide polymorphisms (SNPs) (Davies et al. 2011), providing a lower-bound estimate of the narrow-sense heritability of these traits. Furthermore, using only SNP data, ∼1% of the variance in intelligence test scores in a sample could be predicted in an independent sample (Davies et al. 2011). However, at the single-marker level, no robust genetic association with intelligence has yet been published, consistent with the observation that the effect of individual SNPs may be too weak to be detected in complex polygenic traits using the classical genome-wide P ≤ 5 × 10⁻⁸ threshold (Wellcome Trust Case Control Consortium 2007) on the sample sizes currently available (International Schizophrenia Consortium et al. 2009). Therefore, relaxing the significance criteria and exploiting the polygenic signal by going beyond the traditional single-marker approach to gene- and pathway-based methods may offer more power (Neale & Sham 2004) and insight into the biological processes underlying these traits (Wang et al. 2010).
The polygenic architecture of gF and gC was previously confirmed using the Cognitive Aging Genetics in England and Scotland (CAGES) cohort as the discovery sample and the Norwegian Cognitive NeuroGenetics (NCNG) adult lifespan sample for replication (Davies et al. 2011). Here, using the same datasets, we combine single-marker, gene- and pathway-based approaches to characterize the genetic architecture of gF and gC with respect to known biological processes.
Materials and methods
GWASs: genotypes and phenotypes
The genotype and phenotype protocols and the samples have been described previously (Davies et al. 2011; Espeseth et al. 2012). All participants gave written consent before the study started. All procedures were conducted according to the tenets of the Declaration of Helsinki and approved by the relevant Research Ethics Committees. An overview of the genotype and phenotype protocols in the discovery and replication samples is provided below, with further details available in the original publications.
Discovery GWAS
The final NCNG GWAS consisted of 554 225 SNPs genotyped in a homogenous Norwegian sample of 670 individuals (457 females), ranging from 18 to 79 years of age (M = 47.6; SD = 18.3) (Espeseth et al. 2012). Participants completed a battery of psychometric tests, assessing general cognitive ability, memory, attention and speed of processing. The protocol was approved by the Regional Committee for Medical and Health Research Ethics, Southern Norway (project ID: S-03116). DNAs were genotyped on the Illumina Human610-Quad Beadchip. Quality control was performed with the ‘check.marker’ function of the R package GenABEL (Aulchenko et al. 2007). Individuals were excluded based on relatedness (‘ibs.threshold’ = 0.85), heterogeneity, unresolved sex discrepancies and call rate ≤ 0.97. Population structure was assessed by multidimensional scaling (MDS) analysis (using 100 000 random SNPs), removing outlying samples with possible recent non-Norwegian ancestry. No additional adjustment for population structure was performed because of the homogeneity of the sample (Espeseth et al. 2012). Single nucleotide polymorphisms with a call rate ≤ 0.95, minor allele frequency ≤ 0.01 and Hardy–Weinberg equilibrium (exact test) P-value ≤ 0.001 were excluded.
Replication GWAS
The CAGES sample consists of five cohorts, the Lothian Birth Cohorts of 1921 (Deary et al. 2004, 2009b) and 1936 (Deary et al. 2007) (LBC1921, LBC1936), the Aberdeen Birth Cohort of 1936 (ABC1936) (Deary et al. 2004, 2009b) and the Manchester and Newcastle Longitudinal Studies of Cognitive Aging Cohorts (Rabbitt et al. 2004). The final GWAS dataset consisted of 549 692 SNPs genotyped in 3511 healthy individuals (2115 females) with detailed cognitive ability measurements taken in middle to older adulthood (mean age ranged from 64.6 in the ABC1936 to 79.1 in LBC1921; overall age range: 44–93) (Davies et al. 2011). Ethical approval was obtained from the relevant Research Ethics Committees. Individuals were excluded based on unresolved gender discrepancy, coefficient of relatedness > 0.025 (based on 549 692 autosomal SNPs), call rate ≤ 0.95 and evidence of non-Caucasian descent as determined by MDS analysis (Davies et al. 2011). Single nucleotide polymorphisms were included if they met the following conditions: call rate ≥ 0.98, minor allele frequency ≥ 0.01 and Hardy–Weinberg equilibrium test with P ≥ 0.001. Population structure was assessed by MDS analysis, and four MDS components were fitted as covariates to correct for any population stratification that might be present.
Cognitive phenotypes
Different measures of gF and gC were employed for each of the five CAGES samples and the NCNG sample (Davies et al. 2011). In general, the different tests of gF aimed to assess each individual's capacity to reason logically and solve problems in novel situations, relatively independently of acquired knowledge. gF employs aspects of processing speed, attention, memory and executive function. The gC tests were vocabulary-based, assessing each individual's semantic knowledge. All measures were corrected for sex (with the exception of the CAGES Manchester and Newcastle gF, which was derived separately for males and females) and age. The standardized residuals were then extracted and used as the trait measures in all subsequent analyses. In the NCNG, of the 670 individuals, 629 and 643 had scores for gF and gC, respectively. In the CAGES, of the 3511 individuals, 3400 and 3482 had scores for gF and gC, respectively.
Analyses
Construction of gene lists
A ‘bottom-up’ approach (Liu et al. 2007) was undertaken. Both single-marker and gene-based association analyses were performed, testing SNPs and genes individually first in order to construct a list of genes that would then be subjected to pathway analysis, via Ingenuity Pathway Analysis (IPA), to identify over-represented functions and/or pathways. For each of gF and gC, genetic factors that showed evidence of association in the NCNG were identified and filtered further based on evidence of replication in the CAGES. Single-marker and gene-based statistical methods and thresholds were selected and applied, as appropriate, with the aim of controlling the Type II (false-negative) as well as the inversely related Type I (false-positive) error rates, incorporating instead prior biological knowledge to the interpretation of the findings and generating testable hypotheses for further investigation (Lieberman & Cunningham 2009; Williams & Haines 2011).
The LDsnpR tool (Christoforou et al. 2012a) was used to (1) annotate individual SNPs and (2) assign SNPs to genes for the gene-based analyses. Single nucleotide polymorphisms were assigned to genes (Ensembl 54 definitions) if they were located physically within the boundaries of the gene (±10 kb) or if they were in high LD [r2 ≥ 0.80 based on HapMap CEU (http://hapmap.ncbi.nlm.nih.gov/)] with another SNP located within the boundaries of the gene (±10 kb).
Single-marker analyses
In the NCNG sample, association between individual SNP alleles and cognitive phenotypes was tested using linear regression analysis (1 d.f. coefficient t-test), as implemented in PLINK (Purcell et al. 2007). The CAGES GWAS data comprised the inverse variance weighted model ‘meta P-values’ produced in the original CAGES five-sample meta-analysis (i.e. as reported by Davies et al. 2011). A meta-analysis of the CAGES and NCNG single-marker allele P-values was performed on the overlapping SNPs, using an inverse variance weighted model, as implemented in METAL (Willer et al. 2010).
All SNPs with an asymptotic nominal P-value of ≤0.05 in the NCNG were then mined for replication in the CAGES GWAS data. As advised in Konig (2011), positive single-marker replication was determined on the basis of P ≤ 0.05 and the same direction of effect in both the NCNG and CAGES samples, resulting in a meta-analysis P-value that is more significant than either of the original P-values. Using LDsnpR, all SNPs that replicated were annotated, where possible, with a gene name or Ensembl identifier and taken forward for pathway-based analysis by IPA.
Gene-based analyses
All 554 225 SNPs in the NCNG GWAS were assigned, where possible, to genes using LDsnpR. For each gene containing an SNP, association was assessed by applying PLINK's permutation-based set test on the LDsnpR-generated sets. Gene-based statistics generated by permutation-based methods automatically account for potential confounding factors, such as LD structure and gene length or SNP number, through the generation of an empirical null distribution (Liu et al. 2010). As the true underlying genetic architecture of these traits is unknown, three different models were tested to obtain a gene-based association score (Lehne et al. 2011):
The ‘minimum P-value’ (minP) model, which assigns to each gene the association statistic, or P-value, of the most significant SNP in the gene, assumes that a single SNP within the gene contributes to the phenotype.
The ‘all P-values’ model, which assigns to each gene the mean association statistic of all the SNPs in the gene, assumes that all or most SNPs within the gene contribute to the phenotype.
The ‘P ≤ 0.05 threshold’ model, which assigns to each gene the mean association statistic of all SNPs within the gene that have a P ≤ 0.05, assumes that only a few or a subset of SNP contribute to the phenotype.
The P-values were computed based on 10 000 permutations, and the lowest of the three permuted P-values was retained as the gene-based P-value for each gene. No additional correction was applied to the gene-based score to account for testing the three models because of high correlation between the tests. Genes with gene-based permuted P ≤ 0.05 were mined for replication in the CAGES.
In order to preserve the Type II error rate, the replication criteria in the CAGES were relaxed to include any gene that contained at least one SNP with a ‘meta-P’ ≤ 0.05, ensuring that significance under any genetic architecture was captured. In the NCNG, for example, all genes with a minimum gene-based permuted P ≤ 0.05 contained at least one SNP with a P ≤ 0.05 (data not shown). This replication criterion of at least one SNP with a ‘meta-P’ ≤ 0.05 is equivalent to the unadjusted minimum P-value approach. Thus, the CAGES SNPs were first assigned to genes using LDsnpR, as described above, and the genes were scored using the minimum P-value approach, assigning to the gene the P-value of the most significant SNP in that gene (without further adjustment). All genes that were selected from the NCNG and that also replicated in the CAGES (i.e. meta-P ≤ 0.05) were taken forward for analysis with IPA. Finally, after the relevant gene lists were pruned for LD on the basis of their association signals and position, the hypergeometric distribution, as implemented in www.geneprof.org/GeneProf/tools/hypergeometric.jsp, was used to assess whether the number of genes replicating in the CAGES was greater than expected by chance.
Construction of gene lists – stringent replication criteria
As the aforementioned single-marker and gene-based replication criteria in the CAGES are prone to inflating the Type I error rate due to gene-length bias, the robustness of the subsequent main IPA findings was assessed by re-running IPA on gene lists constructed using more stringent statistical thresholds and methods. First, for the single-marker analysis, only genes tagged by the SNPs that met the previously described replication criteria and resulted in a meta-analysis P ≤ 1 × 10⁻⁵, as supported by the National Human Genome Research Institute GWAS catalog (Welter et al. 2014), were taken forward for IPA analysis. For the gene-based analysis, replication in the CAGES was determined using two gene-scoring methods, which accounted for the number of SNPs per gene and, critically, for LD without requiring genotype-level data. The first method scored each gene with the most significant P-value (i.e. the minP approach), adjusting for the number of SNPs using a modified Sidak's correction (Saccone et al. 2007). This approach has been shown to perform as well as regression-based methods (Christoforou et al. 2012a; Segre et al. 2010). The second approach was comparable to the regression-based ‘all P-values’ model described above, combining all SNPs mapped to the gene using Brown's approximation method, as implemented in PLINK (Moskvina et al. 2011; Purcell et al. 2007). The NCNG genotype data was used to estimate the LD between SNPs. Thus, the genes with gene-based permuted P ≤ 0.05 in the NCNG, which met a P-value of ≤ 0.05 with either of these two methods in the CAGES, were subjected to IPA analysis.
Ingenuity Pathway Analysis
Genes that showed evidence of association in the NCNG and of replication in the CAGES based on either the single-marker and/or the gene-based analysis were selected for pathway analysis with IPA (Ingenuity® Systems, www.ingenuity.com) to identify the most relevant biological functions and pathways. Ingenuity Pathway Analysis gathers information from published data from ∼3600 peer-reviewed journals regarding relationships between genes and proteins. The information is updated weekly, manually curated and stored within the Ingenuity® Knowledge Base, which is then queried during an analysis to identify specific biological functions, or ‘function annotations’, and pathways enriched within the submitted gene list.
In this study, the Ensembl 54 gene identifiers were uploaded into IPA and mapped, if possible, to their corresponding object in the Ingenuity® Knowledge Base (Genes Only). A ‘Core Analysis’ was performed, including both direct and indirect relationships and using all available data sources in all species available. Molecules and/or relationships that were either experimentally observed or predicted with high confidence were considered. For the main analyses, which aimed to differentiate gF and gC as it relates, most relevantly, to the nervous system, tissues and primary cells were restricted to those of the nervous system, and cell lines were restricted to those of the central nervous system. Additional analyses were performed to evaluate the robustness and relevance of the main findings, including (1) re-running the IPA having excluded genes known to be extensively studied to assess the possibility of publication bias driving the main findings and (2) re-running the IPA having included all tissues and cell lines, except those specific to cancer, to assess the relevance of the main findings in the context of more global annotation.
In particular, we focused on the significant function annotations. The function annotations are organized based on Ingenuity® Ontology, which consists of a manually built and maintained hierarchical data structure of hundreds of thousands of unique classes. As part of the ‘Core Analysis’, IPA performs a Fisher's exact test (FET) to determine whether the submitted gene list consists of genes of a particular function annotation more than expected by chance, given the proportion of genes of that particular function annotation in the entire Ingenuity Knowledge Base. It also uses the Benjamini–Hochberg (BH) multiple-testing correction method to adjust for the number of ontologies tested, providing a false discovery rate for a particular function annotation. In this study, all functional annotations with an FET P ≤ 0.05 (and corresponding BH P ≤ 0.25) were considered significant.
Results
Construction of gene lists
Single-marker analyses
A total of 554 225 SNPs were tested for allelic association to gF (N = 629 individuals) and gC (N = 643 individuals) in the NCNG sample. As these GWAS data results were not presented in the previous study (Davies et al. 2011), the traditional SNP-level diagnostics and results are provided in the Supporting Information (Fig. S1 and Dataset S1). The genomic inflation factor was 1 for both gF and gC (Fig. S1), indicating that the data did not suffer from population stratification or other systematic bias. When mining the CAGES data, 816 SNPs in gF and 884 SNPs in gC met the replication criteria of P ≤ 0.05 and the same direction of effect (Dataset S1). Using the LD-based binning approach implemented in LDsnpR (Christoforou et al. 2012a), 481 (59%) of the gF SNPs and 549 (62%) of the gC SNPs were assigned to Ensembl 54 genes. 159 gF SNPs and 160 gC SNPs mapped to more than one gene on the basis of LD. As it is not possible to identify the true source of the association on the basis of the SNP P-value alone (Christoforou et al. 2012a,2012b), all genes were retained for pathway analysis. The significant function annotations or pathways were subsequently manually examined to ensure that they did not consist of clusters of genes representing the same genetic association signal. Thus, 503 and 530 Ensembl 54 genes for gF and gC, respectively (Dataset S1), were taken forward for IPA analysis. A total of 171 (34%) of the gF genes and 212 (40%) of the gC genes were implicated by more than one replicated SNP.
Gene-based analyses
A gene-based approach was also used to identify candidate genes for pathway analysis, allowing for locus heterogeneity and the aggregation of multiple weaker association signals. In the NCNG, of the 34 109 eligible Ensembl 54 gene entries, 2698 and 2615 met the nominal significance threshold of set-based permuted P ≤ 0.05 in gF and gC, respectively (Dataset S2). Of these, 841 gF genes and 920 gC genes had a minimum P-value gene-based score of ≤ 0.05 in the CAGES (Dataset S2). After the relevant gene lists were first pruned for LD based on position and association signal, resulting in 607 and 652 relatively independent association signals for gF and gC, respectively, the number of genes showing evidence of replication was more than expected by chance for gC (hypergeometric P = 4.5 × 10⁻⁴), but not for gF (hypergeometric P = 0.25). The 841 gF genes and 920 gC genes were added to the list of genes identified by single-marker analysis and taken forward for IPA.
Ingenuity Pathway Analysis
Figure 1 summarizes the number of SNPs and genes identified in each analysis and the relevant corresponding overlaps. A total of 1182 genes for gF and 1294 genes for gC were identified through both the single-marker and gene-based analyses and subjected to IPA analysis. Of these genes, 853 for gF and 893 for gC were identified by their Ensembl Gene identifier in the IPA database (i.e. ‘IPA Ready’ genes; Dataset S3) and were thus available for pathway analysis. A total of 117 genes were in common between the two traits.
Figure 1.
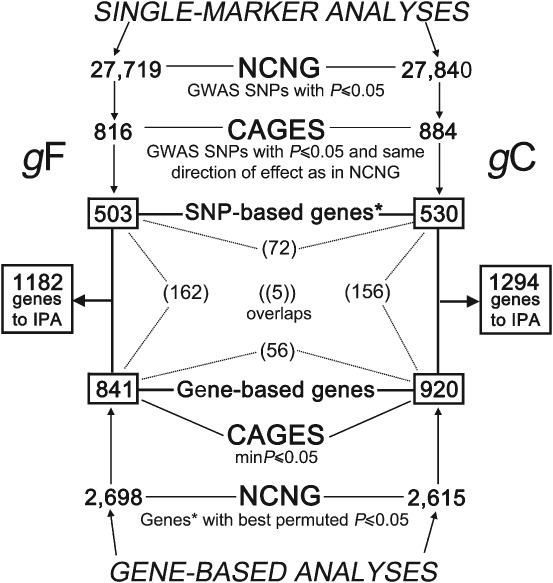
Summary of SNP- and gene-based analyses and corresponding numbers of genes identified for IPA for both gF (left) and gC (right). The boxed numbers in the centre represent the number of genes identified as a result of the SNP-based analyses (from top, down), the gene-based analyses (from bottom, up), the resulting total number of unique genes submitted to IPA and the number of relevant overlapping genes (in parentheses). * indicates that the GWAS SNPs were assigned to genes by LDsnpR.
IPA's ‘Core Analysis’ was run on the two lists of genes, restricting the analysis to tissues and cell lines related to the nervous system. Function annotations that were significantly enriched with an FET P ≤ 0.05 and a BH P ≤ 0.25, which account for all of the function annotations tested, were declared significant and evaluated. For both traits, function annotations involved in the biological function ‘Nervous System Development and Function’ were the most common, accounting for >25% of the function annotations. These were followed by annotations involved in ‘Cell-to-Cell signaling’ and ‘Cellular Assembly and Organization’ in both gF and gC (∼8%) (Dataset S3). However, it is important to note that some function annotations are categorized under multiple biological functions, resulting in redundancy in the data (e.g. ‘axonogenesis’ appears under ‘Nervous System Development and Function’, ‘Cell Morphology’, ‘Cellular Function and Maintenance’, ‘Cellular Assembly and Organization’ and ‘Tissue Development’). When considering only the non-redundant function annotations, specifically those identified on the basis of at least two genes from the inputted gene list, 85 and 54 function annotations were identified as significantly enriched in gF and gC, respectively (Dataset S3).
Only four function annotations were enriched in both gF and gC, including ‘microtubule dynamics’ and ‘chemotaxis of neurons’, which could be generally categorized as architectural features of neuronal development. The set of genes leading to the enrichment of these overlapping annotations in gF was different to that in gC (Table1), except for the ‘migration of GABAergic neurons’ annotation which was attributed to the same two genes in gF and gC.
Table 1.
Significant IPA function annotations (FAs) in both gF and gC
| Function | FA | gF | gC | ||||
|---|---|---|---|---|---|---|---|
| FET P-value | BH P-value | Genes | FET P-value | BH P-value | Genes | ||
| Chemotaxis | Chemotaxis of neurons | 0.025 | 0.18 | BDNF, GFRA1, RGS3 | 0.0037 | 0.17 | EPHB2, GFRA1, SEMA3A, SLIT2 |
| Formation | Formation of dendrites | 0.028 | 0.18 | ACHE, BCL11A, BDNF, CTNNA2, GRIN3A, NRG1, PRKG1, SGK1, SYNE1 | 0.035 | 0.22 | DAB1, DSCAM, KLF7, KNDC1, MAP2, NRG1, PPP1R9B, RAC2, SEMA3A |
| Organization | Microtubule dynamics | 0.030 | 0.18 | ACHE, ATXN10, BAX, BCL11A, BCL2, BDNF, BSN, CDH1, CNTN4, CNTNAP2, CTNNA2, CTNND2, CYP19A1, DISC1, EGFR, GDA, GRIN3A, GSN, IGF1R, KATNB1, MAPK8, NFIB, NRG1, PRKG1, PTPRM, RND1, SGK1, SLC18A3, SLIT1, SLIT3, SNCA, SYNE1, UHMK1 | 0.032 | 0.22 | ATXN2, BBS10, CDH4, CNTN4, DAB1, DCC, DSCAM, EPHB1, EPHB2, GPM6A, KLF7, KNDC1, LAMB1, LRRC7, MAP2, MBP, MTOR, NRG1, PCDH15, PLD1, POU3F1, PPP1R9B, PRICKLE2, PRKCA, PTPRM, RAC2, RIT2, RUFY3, SEMA3A, SLIT1, SLIT2, TNFRSF12A, TRPV4, VANG |
| Migration | Migration of GABAergic neurons | 0.012 | 0.18 | GFRA1, SLIT1 | 0.013 | 0.22 | GFRA1, SLIT1 |
For each general function, the specific FA is shown together with the corresponding FET P-value, the BH multiple-testing corrected P-value and the genes responsible for the enrichment signal in the FA. Individual genes that contribute to the enrichment of a particular FA in both gF and gC are in bold.
The most statistically significant functional annotations were identified in gC. ‘Synaptic depression’ ranked at the top (FET P = 2.9 × 10⁻⁶; BH P = 0.0015), with the related ‘long-term depression’ in general (LTD; FET P = 2.0 × 10⁻⁵; BH P = 0.0052) and LTD of specific cells (Table2), all of which are highly related as indicated by the composite genes. ‘Guidance of axons’ and ‘schizophrenia’ were also significantly enriched in gC (FET P = 4.8 × 10⁻⁴ and 0.042, respectively), with the former also ranking third (Table2 and Dataset S3).
Table 2.
Top 25 IPA FAs for gC
| Function | FA | FET P-value | BH P-value | No. of genes | Genes |
|---|---|---|---|---|---|
| Synaptic depression | Synaptic depression | 2.9 × 10⁻⁶ | 0.0015 | 13 | ADCY5, ADCY8, CNR1, DRD5, EPHB1, EPHB2, GRM7, LRRC7, MTOR, PRKCA, RYR3, ST8SIA4, SYNJ1, (ITSN1) |
| LTD | LTD | 2.0 × 10⁻⁵ | 0.0052 | 11 | ADCY5, ADCY8, CNR1, DRD5, EPHB2, GRM7, LRRC7, MTOR, PRKCA, RYR3, ST8SIA4 |
| Guidance | Guidance of axons | 4.8 × 10⁻⁴ | 0.061 | 16 | ALCAM, ANK3, CDH4, CNTN4, DCC, EPHB1, EPHB2, ERBB4, EXT1, GLI3, KLF7, NFASC, PLXNA2, SEMA3A, SLIT1, SLIT2 |
| LTD | LTD of cells | 4.8 × 10⁻⁴ | 0.061 | 6 | ADCY5, CNR1, DRD5, PRKCA, RYR3, ST8SIA4 |
| LTD | LTD of brain cells | 7.2 × 10⁻⁴ | 0.075 | 5 | ADCY5, CNR1, PRKCA, RYR3, ST8SIA4 |
| LTD | LTD of neurons | 0.0013 | 0.11 | 5 | ADCY5, CNR1, DRD5, RYR3, ST8SIA4 |
| Assembly | Assembly of olfactory cilia | 0.0020 | 0.13 | 3 | BBS10, PCDH15, VANGL2 |
| LTD | LTD of corticostriatal neurons | 0.0023 | 0.13 | 2 | ADCY5, CNR1 |
| Positioning | Positioning of cholinergic neurons | 0.0023 | 0.13 | 2 | SLIT1, SLIT2 |
| Contact repulsion | Contact repulsion | 0.0034 | 0.17 | 3 | DCC, SEMA3A, SLIT2 |
| Chemotaxis | Chemotaxis of neurons | 0.0037 | 0.17 | 4 | EPHB2, GFRA1, SEMA3A, SLIT2 |
| Development | Development of optic chiasm | 0.0068 | 0.22 | 2 | SLIT1, SLIT2 |
| Size | Size of lateral cerebral ventricle | 0.0068 | 0.22 | 2 | ANK2, NRG1 (includes EG:112400) |
| Apoptosis | Apoptosis of sensory neurons | 0.0076 | 0.22 | 3 | CDKN2D, HIPK2, KLF7 |
| Metabolism | Fatty acid metabolism | 0.010 | 0.22 | 5 | DAB1, ERBB4, NRG1, SEMA3A, ST8SIA1 |
| Abnormal morphology | Abnormal morphology of nervous system | 0.013 | 0.22 | 2 | CNR1, UHRF1 |
| Formation | Formation of oligodendrocytes | 0.013 | 0.22 | 2 | ERBB4, NRG1 |
| Guidance | Guidance of thalamocortical axons | 0.013 | 0.22 | 2 | SLIT1, SLIT2 |
| Migration | Migration of GABAergic neurons | 0.013 | 0.22 | 2 | GFRA1, SLIT1 |
| Pathfinding | Pathfinding of axons | 0.013 | 0.22 | 2 | DCC, EXT1 |
| Chemotaxis | Chemotaxis of cells | 0.014 | 0.22 | 5 | EPHB2, FPR2, GFRA1, SEMA3A, SLIT2 |
| Development | Development of diencephalon | 0.014 | 0.22 | 3 | SIM2, SLIT1, SLIT2 |
| LTD | LTD of synapse | 0.018 | 0.22 | 3 | CNR1, GRM7, MTOR |
| Synthesis | Synthesis of fatty acid | 0.020 | 0.22 | 4 | DAB1, ERBB4, NRG1, SEMA3A |
| Synthesis | Synthesis of lipid | 0.020 | 0.22 | 6 | CNR1, DAB1, ERBB4, NRG1, SEMA3A, ST8SIA1 |
For each general function, the specific FA is shown together with its corresponding FET P-value, the BH multiple-testing corrected P-value, the number of genes and the symbols of the genes responsible for the enrichment signal in the FA. The functions and FAs that remained significant in the IPA analysis of the genes that passed the more stringent criteria are underlined. The gene(s) in parentheses are those that emerged from the more conservative analysis.
The general functional enrichment profiles of gF and gC were different. No function emerged as notably significant in gF, a finding which was further emphasized by the ‘flat’ multiple-testing corrected BH P-value of 0.18 for all significant annotations. The most significantly enriched functional annotation identified was ‘synaptic fatigue of synapse’ (FET P = 0.0021), followed by ‘apoptosis of spinal cord cells’ (FET P = 0.0041) and ‘inhibition of neurons’ (FET P = 0.0053) (Table3). However, the predominance of function annotations relating to ‘quantity’, particularly of neurons and of other structures of the nervous system, was notable (Table3; Fig. S2; Dataset S3). Other functions were related to the quantity (e.g. formation, loss, survival and apoptosis), quality (e.g. synaptic fatigue, degradation, atrophy and myelination) or morphology of neurons or related structures. Long-term potentiation (LTP) was another repeated function for gF (Fig. S2). One gene, brain-derived neurotrophic factor (BDNF), which showed gene-based association with gF (Dataset S2), contributed to the enrichment of several significant function annotations for gF (Table3 and Dataset S3). As BDNF is one of the most extensively studied genes in the field (Green et al. 2008), it could bias the IPA results, which are based on peer-reviewed publications. However, when IPA was run without BDNF, most of the significant findings withstood its exclusion (Table3 and Dataset S3), and the general functional enrichment profile observed in gF was preserved. A manual examination of the chromosomal positions of the sets of genes leading to the enrichment of the significant annotations listed in Tables3 ensured that these significant enrichments are due to independent association signals and not due to the same association signal represented by clusters of genes in LD.
Table 3.
Top 25 IPA FAs for gF
| Function | FA | FET P-value | BH P-value | No. of genes | Genes |
|---|---|---|---|---|---|
| Synaptic fatigue | Synaptic fatigue of synapse | 0.0021 | 0.18 | 2 | BDNF, SYN3 |
| Apoptosis | Apoptosis of spinal cord cells | 0.0041 | 0.18 | 4 | BAX, BCL2, BDNF, FAM134B |
| Inhibition | Inhibition of neurons | 0.0053 | 0.18 | 4 | BDNF, NPPA, NPPB, NRG1 |
| Development | Development of sensory nervous system | 0.0062 | 0.18 | 2 | BDNF, KIF1A |
| Inhibition | Inhibition of pyramidal neurons | 0.0062 | 0.18 | 2 | BDNF, NRG1 |
| Concentration | Concentration of arachidonic acid | 0.0062 | 0.18 | 2 | DGKE, KNG1 |
| Endocytosis | Endocytosis of synaptic vesicles | 0.0067 | 0.18 | 4 | AMPH, CABIN1, ITSN1, SNCA |
| Damage | Damage of cortical neurons | 0.0067 | 0.18 | 3 | BAX, BDNF, GRIN3A |
| Quantity | Quantity of central nervous system cells | 0.0090 | 0.18 | 9 | ACHE, AVPR1B, CCND2, EGFR, GDA, IGFBP6, LEF1, LHX5, TSC1 |
| LTP | LTP | 0.0092 | 0.18 | 13 | B3GAT1, BDNF, CDH1, CHRNA7, CYP19A1, DGKE, LRP1, LRP8, NRG1, PLG, SNCA, VAV2, VAV3 |
| Apoptosis | Apoptosis of dorsal root ganglion cells | 0.0093 | 0.18 | 3 | BAX, BCL2, FAM134B |
| Mobilization | Mobilization of Ca2+ | 0.0093 | 0.18 | 3 | BDNF, PROK2, TRPV1 |
| Morphogenesis | Morphogenesis of neurites | 0.0097 | 0.18 | 22 | ACHE, ATXN10, BDNF, BSN, CNTN4, CNTNAP2, CTNNA2, CTNND2, CYP19A1, EGFR, GDA, IGF1R, MAPK8, NRG1, PRKG1, PTPRM, RND1, SGK1, SLC18A3, SLIT1, SYNE1, UHMK1, (TLR7) |
| Growth | Growth of dendrites | 0.0099 | 0.18 | 5 | BDNF, CTNND2, CYP19A1, NRG1, SLIT1 |
| Morphology | Morphology of dendrites | 0.0099 | 0.18 | 5 | BDNF, DISC1, GRIN2D, NPAS3, NRG1 |
| Quantity | Quantity of acetylcholine | 0.012 | 0.18 | 2 | ACHE, SLC18A3 |
| Survival | Survival of dorsal root ganglion | 0.012 | 0.18 | 2 | BAX, BDNF |
| Synaptogenesis | Synaptogenesis of brain cells | 0.012 | 0.18 | 2 | BDNF, CYP19A1 |
| LTP | LTP of granule cells | 0.012 | 0.18 | 2 | BDNF, DGKE |
| Sensitization | Sensitization of neurons | 0.012 | 0.18 | 2 | BDNF, KNG1 |
| Migration | Migration of GABAergic neurons | 0.012 | 0.18 | 2 | GFRA1, SLIT1 |
| Quantity | Quantity of astrocytes | 0.012 | 0.18 | 4 | ACHE, EGFR, IGFBP6, TSC1 |
| Cell viability | Cell viability of motor neurons | 0.015 | 0.18 | 5 | BAX, BCL2, BDNF, GFRA1, REG3G |
| Loss | Loss of motor neurons | 0.016 | 0.18 | 3 | BCL2, BDNF, GFRA1 |
| Quantity | Quantity of nerve ending | 0.016 | 0.18 | 3 | BDNF, SLC18A3, SNCA |
For each general function, the specific FA is shown together with the corresponding FET P-value, the BH multiple-testing corrected P-value, the number of genes and the symbols of the genes responsible for the enrichment signal in the FA. FAs that remained significant after excluding BDNF are in bold. The functions and FAs that remained significant in the IPA analysis of the genes that passed the more stringent criteria are underlined. The gene(s) in parentheses are those that emerged from the more conservative analysis.
In order to gauge the robustness of the above findings in the absence of the gene-length bias that may have been introduced with the relaxed replication criteria, the CNS-specific IPA analysis was also performed on gene lists constructed on the basis of more stringent replication criteria. For gF, the single-marker analysis identified two genes which contained replicated SNPs that met the meta-analysis P ≤ 1 × 10⁻⁵ threshold (Dataset S1). The gene-based analysis identified 178 genes with gene-based P ≤ 0.05 using either the modified Sidak approach or Brown's approximation method (Dataset S2). Together, this resulted in a total of 180 genes available for IPA analysis for gF. For gC, 5 and 224 genes were identified via the single-marker and gene-based analyses, respectively, resulting in 225 unique genes available for IPA analysis. Nine genes were common to both gF and gC.
The IPA results emerging from the abridged gene lists were not as impressive in terms of the number of significant unique function annotations (N = 26 and 8 for gF and gC, respectively) and in terms of their general enrichment profiles for gF and gC (Dataset 3). Also, for both traits, different function annotations emerged as most significant, namely ‘neuritogenesis’ for gF (FET P = 2.8 × 10⁻⁴) and ‘hypoplasia of cerebellar vermis’ (FET P = 0.0015) (Dataset 3). However, the main functions that were found to distinguish gF from gC in the original, less conservative analysis remained significant. ‘LTD’ and ‘synaptic depression’ remained unique to gC albeit at a reduced significance level (FET P = 0.018 and 0.047, respectively) (Table2 and Dataset 3). For gF, functions which related to quantity, quality or morphology of neurons and synapses still predominated. These included ‘quantity’, ‘morphogenesis’ and ‘development’ of neurons, synapses and other brain structures (Dataset 3). No function annotations were common to both traits in this analysis.
Finally, returning to the original gene lists based on the relaxed criteria, IPA was run again on both traits, using information from all cell lines, with the exception of cancer cell lines, in the Ingenuity® Knowledge Base. This helped to evaluate the primary CNS-restricted results relative to more global annotation, to identify annotations that may be related to cognitive ability and to enable the inclusion of published studies of brain-related traits that were executed in non-CNS cell lines, such as lymphoblastoid cell lines (Gladkevich et al. 2004). The significance of the original, CNS-restricted findings was largely unaffected. The most significant annotations for gF in this analysis fell under the disease and disorder category of ‘Cardiovascular Disease’ (e.g. ‘vascular disease’, FET P = 7.1 × 10⁻⁶; Dataset S3). In addition, the function annotations ‘development of brain’, ‘behavior’, ‘cognition disorders’, ‘cognitive impairment’ and ‘schizophrenia’ were also significantly enriched in gF (Dataset S3). For gC, ‘synaptic depression’ remained the most significant annotation. However, it was followed by the ‘Cardiovascular Disease’ function annotation ‘coronary artery disease’ (FET P = 1.8 × 10⁻⁶; Dataset S3). The significance of the enrichment of ‘schizophrenia’ also marginally improved (from FET P = 0.042 to FET P = 0.026, Dataset S3).
Discussion
Novel polygenic approaches to analyzing GWAS data have greatly improved our understanding of complex traits and have captured more of the ‘hidden heritability’ (Davies et al. 2011; Maher 2008; Manolio et al. 2009; Visscher et al. 2012) but have failed to identify the markers or genes implicated. Pathway-based techniques are complementary polygenic methods that support biological analysis of GWAS data. Gene-based methods, which are ideal for pathway-based approaches (Liu et al. 2010), permit the aggregation of SNPs of smaller effect and test the gene as a whole, potentially increasing power (Neale & Sham 2004). These analyses are also more permissive to locus heterogeneity, where multiple independent variants within a locus have independent effects on a trait (Christoforou et al. 2012a; Yang et al. 2012), and they use prior biological knowledge, facilitating a more meaningful interpretation of data (Wang et al. 2010). Therefore, if the genetic signals underlying gF and gC, two highly heritable and polygenic traits, cluster in known biological pathways, it should be possible to use pathway-based analyses to identify which biological processes are most strongly implicated in these subcomponents of g. We particularly wanted to determine whether gF and gC could be differentiated at the level of biological pathways or functions as they have been shown to be distinct in terms of development and brain structure. Taking a ‘bottom-up’ approach (Liu et al. 2007), we analyzed two GWAS datasets using both single-marker and gene-based analyses to construct gene lists for IPA analysis. Although some significantly enriched functions overlapped in the two traits, the overall picture suggested distinct functional enrichment profiles, supporting the gF–gC distinction at the genetic level.
The most statistically significant finding was the enrichment in gC of genes involved in synaptic depression and LTD. This finding, which was unique to gC, also survived the FDR multiple-testing correction at the more conservative 0.05 threshold and the application of more stringent replication criteria for the construction of gene lists. It was also the top finding when the pathway analysis included non-CNS-related tissue types and conditions. Long-term depression and LTP are the major forms of long-lasting synaptic change in the mammalian brain (Collingridge et al. 2010). Long-term depression is involved in synaptic pruning during development (Peineau et al. 2007) and is thus important in adult neuroplasticity. Synaptic LTD is mediated by the effect of l-glutamate and other neurotransmitters on several types of receptors. The resulting synaptic plasticity is necessary for hippocampus-dependent learning and memory, certain types of behavioral flexibility and novelty detection (Collingridge et al. 2010). Long-term depression deficits have been associated with reduced working memory and reversal of memory performance in rats. Studies focusing on medial temporal lobe regions have revealed a role of LTD in memory stabilization (in the amygdala) (Migues et al. 2010) and recognition memory (in the perirhinal cortex) (Winters & Bussey 2005), implicating LTD in the development and maintenance of knowledge representations.
For gF, the association signal was less striking in terms of statistical significance. gF was predominantly characterized by genes that control the quantity, morphology and integrity of neurons and synapses. These factors affect the quality and efficiency of neuronal signaling (Brown et al. 2008), which, in turn, affect cognition, as indicated by reduced activation in individuals with higher cognitive ability (Prat et al. 2007; Reichle et al. 2000). As gF declines in cognitive aging, the enrichment of these functions is consistent with the decline in synapse number, brain volume and white matter integrity in the aging brain (Fjell et al. 2009; Morrison & Hof 1997; Walhovd et al. 2011; Westlye et al. 2010).
Only four function annotations were common to both traits. These were related to development and structural aspects (e.g. microtubule dynamics and dendrite formation), which play central roles in synapse formation and are thus likely to be important for cognitive function (Bramham et al. 2010). The genes leading to enrichment of three of these functions were different for gF and gC, reflecting the gain of information that gene set or pathway-based approaches offer by enabling the identification of overlap between related traits or replication of the same trait.
The function annotation ‘schizophrenia’ was also significantly enriched in gF and gC, indicating that the identified genes have also been implicated in schizophrenia by other studies. A polygenic risk score for schizophrenia was recently shown to be associated with lower IQ at age 70 and greater decline in IQ level in one of the CAGES cohorts (Mcintosh et al. 2013), confirming previous observations at the single candidate level of a genetic relation between general cognition and schizophrenia (Toulopoulou et al. 2010). Furthermore, enrichment of the terms ‘behavior’, ‘cognition disorders’ and ‘cognitive impairment’ suggests that the genes identified here have been implicated in other studies of cognition. Finally, annotations relating to ‘Cardiovascular Disease’ ranked in the top two in both gF and gC. Cognitive dysfunction is well documented in patients with cardiovascular disease (Vogels et al. 2007).
The heritability for gF and gC are similar (Davies et al. 2011), but the strength of association, extent of replication and strength of enrichment were all greater for gC than for gF. There are several possible reasons for this. First, gF may be more heterogeneous at the phenotype level. While gC was defined as the standardized score of a single measure in each sample, gF estimation was based on a hierarchical principal component analysis from an array of specific measures. The idea that the psychometric structure of gF is more heterogeneous is consistent with another major model of intelligence (Johnson & Bouchard 2005; Vernon 1964), in which verbal abilities are retained as a single second stratum component, whereas fluid abilities are separated into perceptual and mental rotation skills, thus reflecting higher phenotypic complexity. Second, assessment of gF was not based on identical subsets of specific tests in NCNG and each of the CAGES subsamples. However, the different batteries of cognitive tests yield almost identical estimates of general intelligence (Johnson et al. 2004). Third, the age differences between the samples could have a differential effect, given that gF decreases with age while gC is relatively stable, even though the correlation between them increases with age (Li et al. 2004). Finally, the difference in enrichment profiles may be magnified by gene-length bias, given that a stronger association was identified for gF when IPA was re-run using the genes that passed the more stringent criteria.
The main complicating factor in this and other studies of brain-related traits is gene-length bias, as it presents an analytical ‘Catch-22’. While it is important to correct genes for their length, or equivalently, the number of SNPs tested, to control for false findings, doing so risks over-penalizing and thus eliminating the most relevant candidate genes and therefore pathways for intelligence. It is recognized that gene length is related to functional complexity (Xu et al. 2006), and it is known that brain-expressed genes involved in relevant neuronal processes and/or associated with autism and intellectual disability are substantially longer (King et al. 2013; Michaelson et al. 2012). Also, it has been suggested that longer genes are larger targets and therefore more prone to random mutation and are subject to different transcriptional mechanisms that may be functionally relevant to brain-related traits (King et al. 2013; Solier et al. 2013). Thus, in order to balance the competing Type I and II error rates, we focused our analysis on a well-accepted and recommended discovery-replication approach (Jia et al. 2011), running the replication in one of the largest samples of its kind (the CAGES). Strict replication criteria were used in the single-marker analyses (Konig 2011). For the gene-based analyses, a robust permutation-based approach, which accounts for LD structure and SNP number, was used to select genes for replication, the criteria for which were subsequently relaxed to avoid over-penalizing the larger, more relevant genes. In order to then assess the robustness of these findings, IPA was also run on genes that survived the more stringent approach that corrects for SNP number. As the power of the IPA analysis was greatly compromised by the ∼sixfold reduction in the number of genes available for the analysis, it was not surprising that the evidence for the genetic distinctiveness of the two traits was weaker. Nevertheless, the main distinguishing features between gF and gC were upheld. This suggests that the true genetic architecture of these two traits may lie in the middle, and is inaccessible using current approaches which either ignore or over-penalize for the length of the gene.
As larger consortia form and pathway analyses continue to improve, a better understanding of the genetic architecture of gF and gC will emerge (Khatri et al. 2012; Lencz et al 2014). Meanwhile, our study serves as a starting point, supporting the gF–gC distinction at the genetic level and critically converging with the findings of developmental and cognitive neuroscience studies. The specific function annotations, or pathways, identified are worthy of further replication and interrogation, using, for example, ‘top-down’ approaches such as gene set enrichment analysis (Fernandes et al. 2013) to test specific gene sets constructed on the basis of these findings.
Acknowledgments
We thank the cohort participants and team members who contributed to these studies. We also thank Dr Isabel Hanson for editing the manuscript. The Norwegian study was supported by the Bergen Research Foundation (BFS), the University of Bergen, the Research Council of Norway (RCN) (including FUGE grant nos. 151904 and 183327, Psykisk Helse grant no. 175345, RCN grants 154313/V50 to I.R. and 177458/V50 to T.E.), Helse Sørøst RHF to T.E. (grant 2012086), Helse Vest RHF (grants 911397 and 911687 to A.J.L.) and Dr Einar Martens Fund. We thank the Centre for Advanced Study (CAS) at the Norwegian Academy of Science and Letters in Oslo for hosting collaborative projects and workshops between Norway and Scotland in 2011–2012. Genotyping of the CAGES cohorts and the analyses conducted here were supported by the UK's Biotechnology and Biological Sciences Research Council (BBSRC). Phenotype collection in the Lothian Birth Cohort 1921 was supported by the BBSRC, The Royal Society and The Chief Scientist Office of the Scottish Government. Phenotype collection in the Lothian Birth Cohort 1936 was supported by Research Into Ageing (continues as part of Age UK's The Disconnected Mind project). Phenotype collection in the Aberdeen Birth Cohort 1936 was supported by BBSRC, the Wellcome Trust, and the Alzheimer's Research Trust. Phenotype collection in the Manchester and Newcastle Longitudinal Studies of Cognitive Ageing cohorts was supported by Social Science Research Council, Medical Research Council, Economic and Social Research Council, Research Into Ageing, Wellcome Trust and Unilever plc. The work was undertaken in The University of Edinburgh Centre for Cognitive Ageing and Cognitive Epidemiology, part of the cross-council Lifelong Health and Wellbeing Initiative (G0700704/84698). A.T. is funded by the Roslin Institute Strategic Programme Grant and the MRC-HGU Core Fund. Funding from the BBSRC, EPSRC, ESRC and MRC is gratefully acknowledged. The authors declare no competing interests.
Supporting Information
Additional supporting information may be found in the online version of this article at the publisher's web-site
Supporting Methods, Figures and descriptions of Datasets.
Manhattan (left) and quantile–quantile (QQ; right) plots of (a) fluid and (b) crystallized intelligence in the NCNG. The genomic inflation factor, based on the median χ2, as implemented in PLINK, is 1 for both fluid and crystallized intelligence. The blue line in the Manhattan plots indicates the suggestive P=1 × 10⁻⁵ threshold, whereas the red line indicates the traditional genome-wide 5 × 10⁻⁸ threshold.
Histogram of number of function annotations relating to each general function for gF (top) and gC (bottom). The predominant function for gF (‘quantity’) and gC (‘LTD’) are indicated.
Results of single-marker analyses.
Results of gene-based analyses.
Ingenuity Pathway Analysis results.
References
- Aulchenko YS, Ripke S, Isaacs A. van Duijn CM. GenABEL: an R library for genome-wide association analysis. Bioinformatics. 2007;23:1294–1296. doi: 10.1093/bioinformatics/btm108. [DOI] [PubMed] [Google Scholar]
- Barbey AK, Colom R, Solomon J, Krueger F, Forbes C. Grafman J. An integrative architecture for general intelligence and executive function revealed by lesion mapping. Brain. 2012;135:1154–1164. doi: 10.1093/brain/aws021. [DOI] [PMC free article] [PubMed] [Google Scholar]
- Bramham CR, Alme MN, Bittins M, Kuipers SD, Nair RR, Pai B, Panja D, Schubert M, Soule J, Tiron A. Wibrand K. The arc of synaptic memory. Exp Brain Res. 2010;200:125–140. doi: 10.1007/s00221-009-1959-2. [DOI] [PMC free article] [PubMed] [Google Scholar]
- Brown KM, Gillette TA. Ascoli GA. Quantifying neuronal size: summing up trees and splitting the branch difference. Semin Cell Dev Biol. 2008;19:485–493. doi: 10.1016/j.semcdb.2008.08.005. [DOI] [PMC free article] [PubMed] [Google Scholar]
- Carroll JB. Human Cognitive Abilities: A Survey of Factor Analytic Studies. Cambridge: Cambridge University Press; 1993. [Google Scholar]
- Cattell RB. The theory of fluid and crystallized intelligence: a critical experiment. J Educ Psychol. 1963;54:1–22. doi: 10.1037/h0024654. [DOI] [PubMed] [Google Scholar]
- Christoforou A, Dondrup M, Mattingsdal M, Mattheisen M, Giddaluru S, Nothen MM, Rietschel M, Cichon S, Djurovic S, Andreassen OA, Jonassen I, Steen VM, Puntervoll P. Le Hellard S. Linkage-disequilibrium-based binning affects the interpretation of GWASs. Am J Hum Genet. 2012a;90:727–733. doi: 10.1016/j.ajhg.2012.02.025. [DOI] [PMC free article] [PubMed] [Google Scholar]
- Christoforou A, Mattheisen M, Giddaluru S, Steen VM. Le Hellard S. Response to Zhu et al. Am J Hum Genet. 2012b;91:969–970. [Google Scholar]
- Collingridge GL, Peineau S, Howland JG. Wang YT. Long-term depression in the CNS. Nat Rev Neurosci. 2010;11:459–473. doi: 10.1038/nrn2867. [DOI] [PubMed] [Google Scholar]
- Craik FI. Bialystok E. Cognition through the lifespan: mechanisms of change. Trends Cogn Sci. 2006;10:131–138. doi: 10.1016/j.tics.2006.01.007. [DOI] [PubMed] [Google Scholar]
- Davies G, Tenesa A, Payton A, et al. Genome-wide association studies establish that human intelligence is highly heritable and polygenic. Mol Psychiatry. 2011;16:996–1005. doi: 10.1038/mp.2011.85. [DOI] [PMC free article] [PubMed] [Google Scholar]
- Deary IJ. Intelligence. Annu Rev Psychol. 2012;63:453–482. doi: 10.1146/annurev-psych-120710-100353. [DOI] [PubMed] [Google Scholar]
- Deary IJ. Batty GD. Intelligence as a predictor of health, illness and death. In: Kaufman SB, editor; Sternberg RJ, editor. The Cambridge Handbook of Intelligence. New York, NY: Cambridge University Press; 2011. pp. 683–710. [Google Scholar]
- Deary IJ, Whiteman MC, Starr JM, Whalley LJ. Fox HC. The impact of childhood intelligence on later life: following up the Scottish mental surveys of 1932 and 1947. J Pers Soc Psychol. 2004;86:130–147. doi: 10.1037/0022-3514.86.1.130. [DOI] [PubMed] [Google Scholar]
- Deary IJ, Gow AJ, Taylor MD, Corley J, Brett C, Wilson V, Campbell H, Whalley LJ, Visscher PM, Porteous DJ. Starr JM. The Lothian Birth Cohort 1936: a study to examine influences on cognitive ageing from age 11 to age 70 and beyond. BMC Geriatr. 2007;7:28. doi: 10.1186/1471-2318-7-28. [DOI] [PMC free article] [PubMed] [Google Scholar]
- Deary IJ, Johnson W. Houlihan LM. Genetic foundations of human intelligence. Hum Genet. 2009a;126:215–232. doi: 10.1007/s00439-009-0655-4. [DOI] [PubMed] [Google Scholar]
- Deary IJ, Whalley LJ. Starr JM. A Lifetime of Intelligence: Follow-up Studies of the Scottish Mental Surveys of 1932 and 1947. Washington, DC: American Psychological Association; 2009b. [Google Scholar]
- Espeseth T, Christoforou A, Lundervold A, Steen VM, Le Hellard S. Reinvang I. Imaging and cognitive genetics: the Norwegian Cognitive NeuroGenetics sample. Twin Res Hum Genet. 2012;15:442–452. doi: 10.1017/thg.2012.8. [DOI] [PubMed] [Google Scholar]
- Fernandes CP, Christoforou A, Giddaluru S, Ersland KM, Djurovic S, Mattheisen M, Lundervold AJ, Reinvang I, Nöthen MM, Rietschel M, Ophoff RA, Genetic Risk and Outcome of Psychosis (GROUP), Hofman A, Uitterlinden AG, Werge T, Cichon S, Espeseth T, Andreassen OA, Steen VM. Le Hellard S. A genetic deconstruction of neurocognitive traits in schizophrenia and bipolar disorder. PLoS One. 2013;8:e81052. doi: 10.1371/journal.pone.0081052. [DOI] [PMC free article] [PubMed] [Google Scholar]
- Fjell AM, Westlye LT, Amlien I, Espeseth T, Reinvang I, Raz N, Agartz I, Salat DH, Greve DN, Fischl B, Dale AM. Walhovd KB. High consistency of regional cortical thinning in aging across multiple samples. Cereb Cortex. 2009;19:2001–2012. doi: 10.1093/cercor/bhn232. [DOI] [PMC free article] [PubMed] [Google Scholar]
- Flynn J. What Is Intelligence? Cambridge: Cambridge University Press; 2007. [Google Scholar]
- Gladkevich A, Kauffman HF. Korf J. Lymphocytes as a neural probe: potential for studying psychiatric disorders. Prog Neuropsychopharmacol Biol Psychiatry. 2004;28:559–576. doi: 10.1016/j.pnpbp.2004.01.009. [DOI] [PubMed] [Google Scholar]
- Glascher J, Tranel D, Paul LK, Rudrauf D, Rorden C, Hornaday A, Grabowski T, Damasio H. Adolphs R. Lesion mapping of cognitive abilities linked to intelligence. Neuron. 2009;61:681–691. doi: 10.1016/j.neuron.2009.01.026. [DOI] [PMC free article] [PubMed] [Google Scholar]
- Green AE, Munafo MR, DeYoung CG, Fossella JA, Fan J. Gray JR. Using genetic data in cognitive neuroscience: from growing pains to genuine insights. Nat Rev Neurosci. 2008;9:710–720. doi: 10.1038/nrn2461. [DOI] [PubMed] [Google Scholar]
- International Schizophrenia Consortium, Purcell SM, Wray NR, Stone JL, Visscher PM, O'Donovan MC, Sullivan PF. Sklar P. Common polygenic variation contributes to risk of schizophrenia and bipolar disorder. Nature. 2009;460:748–752. doi: 10.1038/nature08185. [DOI] [PMC free article] [PubMed] [Google Scholar]
- Jia P, Wang L, Meltzer HY. Zhao Z. Pathway-based analysis of GWAS datasets: effective but caution required. Int J Neuropsychopharmacol. 2011;14:567–572. doi: 10.1017/S1461145710001446. [DOI] [PubMed] [Google Scholar]
- Johnson W. Bouchard TJ. The structure of human intelligence: it is verbal, perceptual, and image rotation (VPR), not fluid and crystallized. Intelligence. 2005;33:393–416. [Google Scholar]
- Johnson W, Bouchard TJ, Krueger RF, McGue M. Gottesman II. Just one g: consistent results from three test batteries. Intelligence. 2004;32:95–107. [Google Scholar]
- Jung RE. Haier RJ. The Parieto-Frontal Integration Theory (P-FIT) of intelligence: converging neuroimaging evidence. Behav Brain Sci. 2007;30:135–154. doi: 10.1017/S0140525X07001185. discussion 154–187. [DOI] [PubMed] [Google Scholar]
- Khatri P, Sirota M. Butte AJ. Ten years of pathway analysis: current approaches and outstanding challenges. PLoS Comput Biol. 2012;8:e1002375. doi: 10.1371/journal.pcbi.1002375. [DOI] [PMC free article] [PubMed] [Google Scholar]
- King IF, Yandava CN, Mabb AM, Hsiao JS, Huang HS, Pearson BL, Calabrese JM, Starmer J, Parker JS, Magnuson T, Chamberlain SJ, Philpot BD. Zylka MJ. Topoisomerases facilitate transcription of long genes linked to autism. Nature. 2013;501:58–62. doi: 10.1038/nature12504. [DOI] [PMC free article] [PubMed] [Google Scholar]
- Konig IR. Validation in genetic association studies. Brief Bioinform. 2011;12:253–258. doi: 10.1093/bib/bbq074. [DOI] [PubMed] [Google Scholar]
- Lee T, Henry JD, Trollor JN. Sachdev PS. Genetic influences on cognitive functions in the elderly: a selective review of twin studies. Brain Res Rev. 2010;64:1–13. doi: 10.1016/j.brainresrev.2010.02.001. [DOI] [PubMed] [Google Scholar]
- Lehne B, Lewis CM. Schlitt T. From SNPs to genes: disease association at the gene level. PLoS One. 2011;6:e20133. doi: 10.1371/journal.pone.0020133. [DOI] [PMC free article] [PubMed] [Google Scholar]
- Lencz T, Knowles E, Davies G, et al. Molecular genetic evidence for overlap between general cognitive ability and risk for schizophrenia: a report from the Cognitive Genomics consorTium (COGENT) Mol Psychiatry. 2014;19:168–174. doi: 10.1038/mp.2013.166. [DOI] [PMC free article] [PubMed] [Google Scholar]
- Li SC, Lindenberger U, Hommel B, Aschersleben G, Prinz W. Baltes PB. Transformations in the couplings among intellectual abilities and constituent cognitive processes across the life span. Psychol Sci. 2004;15:155–163. doi: 10.1111/j.0956-7976.2004.01503003.x. [DOI] [PubMed] [Google Scholar]
- Lieberman MD. Cunningham WA. Type I and type II error concerns in fMRI research: re-balancing the scale. Soc Cogn Affect Neurosci. 2009;4:423–428. doi: 10.1093/scan/nsp052. [DOI] [PMC free article] [PubMed] [Google Scholar]
- Liu J, Hughes-Oliver JM. Menius JA., Jr Domain-enhanced analysis of microarray data using GO annotations. Bioinformatics. 2007;23:1225–1234. doi: 10.1093/bioinformatics/btm092. [DOI] [PubMed] [Google Scholar]
- Liu JZ, McRae AF, Nyholt DR, Medland SE, Wray NR, Brown KM, Investigators AMFS, Hayward NK, Montgomery GW, Visscher PM, Martin NG. Macgregor S. A versatile gene-based test for genome-wide association studies. Am J Hum Genet. 2010;87:139–145. doi: 10.1016/j.ajhg.2010.06.009. [DOI] [PMC free article] [PubMed] [Google Scholar]
- Maher B. Personal genomes: the case of the missing heritability. Nature. 2008;456:18–21. doi: 10.1038/456018a. [DOI] [PubMed] [Google Scholar]
- Manolio TA, Collins FS, Cox NJ, et al. Finding the missing heritability of complex diseases. Nature. 2009;461:747–753. doi: 10.1038/nature08494. [DOI] [PMC free article] [PubMed] [Google Scholar]
- McIntosh AM, Gow A, Luciano M, Davies G, Liewald DC, Harris SE, Corley J, Hall J, Starr JM, Porteous DJ, Tenesa A, Visscher PM. Deary IJ. Polygenic risk for schizophrenia is associated with cognitive change between childhood and old age. Biol Psychiatry. 2013;73:938–943. doi: 10.1016/j.biopsych.2013.01.011. [DOI] [PubMed] [Google Scholar]
- Michaelson JJ, Shi Y, Gujral M, et al. Whole-genome sequencing in autism identifies hot spots for de novo germline mutation. Cell. 2012;151:1431–1442. doi: 10.1016/j.cell.2012.11.019. [DOI] [PMC free article] [PubMed] [Google Scholar]
- Migues PV, Hardt O, Wu DC, Gamache K, Sacktor TC, Wang YT. Nader K. PKMzeta maintains memories by regulating GluR2-dependent AMPA receptor trafficking. Nat Neurosci. 2010;13:630–634. doi: 10.1038/nn.2531. [DOI] [PubMed] [Google Scholar]
- Morrison JH. Hof PR. Life and death of neurons in the aging brain. Science. 1997;278:412–419. doi: 10.1126/science.278.5337.412. [DOI] [PubMed] [Google Scholar]
- Moskvina V, O'Dushlaine C, Purcell S, Craddock N, Holmans P. O'Donovan MC. Evaluation of an approximation method for assessment of overall significance of multiple-dependent tests in a genome wide association study. Genet Epidemiol. 2011;35:861–866. doi: 10.1002/gepi.20636. [DOI] [PMC free article] [PubMed] [Google Scholar]
- Neale BM. Sham PC. The future of association studies: gene-based analysis and replication. Am J Hum Genet. 2004;75:353–362. doi: 10.1086/423901. [DOI] [PMC free article] [PubMed] [Google Scholar]
- Peineau S, Taghibiglou C, Bradley C, Wong TP, Liu L, Lu J, Lo E, Wu D, Saule E, Bouschet T, Matthews P, Isaac JT, Bortolotto ZA, Wang YT. Collingridge GL. LTP inhibits LTD in the hippocampus via regulation of GSK3beta. Neuron. 2007;53:703–717. doi: 10.1016/j.neuron.2007.01.029. [DOI] [PubMed] [Google Scholar]
- Plomin R. Spinath FM. Intelligence: genetics, genes, and genomics. J Pers Soc Psychol. 2004;86:112–129. doi: 10.1037/0022-3514.86.1.112. [DOI] [PubMed] [Google Scholar]
- Prat CS, Keller TA. Just MA. Individual differences in sentence comprehension: a functional magnetic resonance imaging investigation of syntactic and lexical processing demands. J Cogn Neurosci. 2007;19:1950–1963. doi: 10.1162/jocn.2007.19.12.1950. [DOI] [PMC free article] [PubMed] [Google Scholar]
- Purcell S, Neale B, Todd-Brown K, Thomas L, Ferreira MA, Bender D, Maller J, Sklar P, de Bakker PI, Daly MJ. Sham PC. PLINK: a tool set for whole-genome association and population-based linkage analyses. Am J Hum Genet. 2007;81:559–575. doi: 10.1086/519795. [DOI] [PMC free article] [PubMed] [Google Scholar]
- Rabbitt PMA, McInnes L, Diggle P, Holland F, Bent N, Abson V, Pendleton N. Horan M. The University of Manchester longitudinal study of cognition in normal healthy old age, 1983 through 2003. Neuropsychol Dev Cogn B Aging Neuropsychol Cogn. 2004;11:245–279. [Google Scholar]
- Ramsden S, Richardson FM, Josse G, Thomas MS, Ellis C, Shakeshaft C, Seghier ML. Price CJ. Verbal and non-verbal intelligence changes in the teenage brain. Nature. 2011;479:113–116. doi: 10.1038/nature10514. [DOI] [PMC free article] [PubMed] [Google Scholar]
- Reichle ED, Carpenter PA. Just MA. The neural bases of strategy and skill in sentence-picture verification. Cogn Psychol. 2000;40:261–295. doi: 10.1006/cogp.2000.0733. [DOI] [PubMed] [Google Scholar]
- Saccone SF, Hinrichs AL, Saccone NL, et al. Cholinergic nicotinic receptor genes implicated in a nicotine dependence association study targeting 348 candidate genes with 3713 SNPs. Hum Mol Genet. 2007;16:36–49. doi: 10.1093/hmg/ddl438. [DOI] [PMC free article] [PubMed] [Google Scholar]
- Salthouse TA. Localizing age-related individual differences in a hierarchical structure. Intelligence. 2004;32:541–561. doi: 10.1016/j.intell.2004.07.003. [DOI] [PMC free article] [PubMed] [Google Scholar]
- Segre AV, DIAGRAM Consortium, MAGIC Investigators, Groop L, Mootha VK, Daly MJ. Altshuler D. Common inherited variation in mitochondrial genes is not enriched for associations with type 2 diabetes or related glycemic traits. PLoS Genet. 2010;6:e1001058. doi: 10.1371/journal.pgen.1001058. [DOI] [PMC free article] [PubMed] [Google Scholar]
- Solier S, Ryan MC, Martin SE, Varma S, Kohn KW, Liu H, Zeeberg BR. Pommier Y. Transcription poisoning by Topoisomerase I is controlled by gene length, splice sites, and miR-142-3p. Cancer Res. 2013;73:4830–4839. doi: 10.1158/0008-5472.CAN-12-3504. [DOI] [PMC free article] [PubMed] [Google Scholar]
- Spearman C. “General intelligence” objectively determined and measured. Am J Psychol. 1904;15:201–293. [Google Scholar]
- Toulopoulou T, Goldberg TE, Mesa IR, Picchioni M, Rijsdijk F, Stahl D, Cherny SS, Sham P, Faraone SV, Tsuang M, Weinberger DR, Seidman LJ. Murray RM. Impaired intellect and memory: a missing link between genetic risk and schizophrenia? Arch Gen Psychiatry. 2010;67:905–913. doi: 10.1001/archgenpsychiatry.2010.99. [DOI] [PubMed] [Google Scholar]
- Vernon PE. The Structure of Human Abilities. London: Methuen; 1964. [Google Scholar]
- Visscher PM, Goddard ME, Derks EM. Wray NR. Evidence-based psychiatric genetics, AKA the false dichotomy between common and rare variant hypotheses. Mol Psychiatry. 2012;17:474–485. doi: 10.1038/mp.2011.65. [DOI] [PubMed] [Google Scholar]
- Vogels RL, Scheltens P, Schroeder-Tanka JM. Weinstein HC. Cognitive impairment in heart failure: a systematic review of the literature. Eur J Heart Fail. 2007;9:440–449. doi: 10.1016/j.ejheart.2006.11.001. [DOI] [PubMed] [Google Scholar]
- Wainwright MA, Wright MJ, Geffen GM, Luciano M. Martin NG. The genetic basis of academic achievement on the Queensland Core Skills Test and its shared genetic variance with IQ. Behav Genet. 2005;35:133–145. doi: 10.1007/s10519-004-1014-9. [DOI] [PubMed] [Google Scholar]
- Walhovd KB, Westlye LT, Amlien I, Espeseth T, Reinvang I, Raz N, Agartz I, Salat DH, Greve DN, Fischl B, Dale AM. Fjell AM. Consistent neuroanatomical age-related volume differences across multiple samples. Neurobiol Aging. 2011;32:916–932. doi: 10.1016/j.neurobiolaging.2009.05.013. [DOI] [PMC free article] [PubMed] [Google Scholar]
- Wang K, Li M. Hakonarson H. Analysing biological pathways in genome-wide association studies. Nat Rev Genet. 2010;11:843–854. doi: 10.1038/nrg2884. [DOI] [PubMed] [Google Scholar]
- Wellcome Trust Case Control Consortium. Genome-wide association study of 14,000 cases of seven common diseases and 3,000 shared controls. Nature. 2007;447:661–678. doi: 10.1038/nature05911. [DOI] [PMC free article] [PubMed] [Google Scholar]
- Welter D, MacArthur J, Morales J, Burdett T, Hall P, Junkins H, Klemm A, Flicek P, Maniolo T, Hindorff L. Parkinson H. The NHGRI GWAS Catalog, a curated resource of SNP-trait associations. Nucleic Acids Res. 2014;42:D1001–D1006. doi: 10.1093/nar/gkt1229. [DOI] [PMC free article] [PubMed] [Google Scholar]
- Westlye LT, Walhovd KB, Dale AM, Bjornerud A, Due-Tonnessen P, Engvig A, Grydeland H, Tamnes CK, Ostby Y. Fjell AM. Life-span changes of the human brain white matter: diffusion tensor imaging (DTI) and volumetry. Cereb Cortex. 2010;20:2055–2068. doi: 10.1093/cercor/bhp280. [DOI] [PubMed] [Google Scholar]
- Willer CJ, Li Y. Abecasis GR. METAL: fast and efficient meta-analysis of genomewide association scans. Bioinformatics. 2010;26:2190–2191. doi: 10.1093/bioinformatics/btq340. [DOI] [PMC free article] [PubMed] [Google Scholar]
- Williams SM. Haines JL. Correcting away the hidden heritability. Ann Hum Genet. 2011;75:348–350. doi: 10.1111/j.1469-1809.2011.00640.x. [DOI] [PubMed] [Google Scholar]
- Winters BD. Bussey TJ. Transient inactivation of perirhinal cortex disrupts encoding, retrieval, and consolidation of object recognition memory. J Neurosci. 2005;25:52–61. doi: 10.1523/JNEUROSCI.3827-04.2005. [DOI] [PMC free article] [PubMed] [Google Scholar]
- Woolgar A, Parr A, Cusack R, Thompson R, Nimmo-Smith I, Torralva T, Roca M, Antoun N, Manes F. Duncan J. Fluid intelligence loss linked to restricted regions of damage within frontal and parietal cortex. Proc Natl Acad Sci USA. 2010;107:14899–14902. doi: 10.1073/pnas.1007928107. [DOI] [PMC free article] [PubMed] [Google Scholar]
- Xu L, Chen H, Hu X, Zhang R, Zhang Z. Luo ZW. Average gene length is highly conserved in prokaryotes and eukaryotes and diverges only between the two kingdoms. Mol Biol Evol. 2006;23:1107–1108. doi: 10.1093/molbev/msk019. [DOI] [PubMed] [Google Scholar]
- Yang J, Ferreira T, Morris AP, Medland SE, Madden PA, Heath AC, Martin NG, Montgomery GW, Weedon MN, Loos RJ, Frayling TM, McCarthy MI, Hirschhorn JN, Goddard ME. Visscher PM. Conditional and joint multiple-SNP analysis of GWAS summary statistics identifies additional variants influencing complex traits. Nat Genet. 2012;44:S361–S363. doi: 10.1038/ng.2213. [DOI] [PMC free article] [PubMed] [Google Scholar]
Associated Data
This section collects any data citations, data availability statements, or supplementary materials included in this article.
Supplementary Materials
Supporting Methods, Figures and descriptions of Datasets.
Manhattan (left) and quantile–quantile (QQ; right) plots of (a) fluid and (b) crystallized intelligence in the NCNG. The genomic inflation factor, based on the median χ2, as implemented in PLINK, is 1 for both fluid and crystallized intelligence. The blue line in the Manhattan plots indicates the suggestive P=1 × 10⁻⁵ threshold, whereas the red line indicates the traditional genome-wide 5 × 10⁻⁸ threshold.
Histogram of number of function annotations relating to each general function for gF (top) and gC (bottom). The predominant function for gF (‘quantity’) and gC (‘LTD’) are indicated.
Results of single-marker analyses.
Results of gene-based analyses.
Ingenuity Pathway Analysis results.