

Abstract
Background and Purpose
CGP 12177 not only inhibits agonist effects mediated through the catecholamine site of the β1-adrenoceptor with high affinity, but also exhibits agonist effects of its own at higher concentrations through a secondary, low-affinity β1-adrenoceptor site or conformation. β-blocker affinities for this ‘CGP 12177’ site of the human β1-adrenoceptor have thus far only been characterized in functional studies. Here, we used the fluorescent CGP 12177 analogue BODIPY-TMR-CGP to directly investigate receptor–ligand interactions at the secondary binding site of the β1-adrenoceptor.
Experimental Approach
The human β1-adrenoceptor was stably expressed in CHO cells containing a cAMP response element (CRE)-secreted placental alkaline phosphatase (SPAP) reporter gene construct. Functional responses of BODIPY-TMR-CGP were determined in the CRE-SPAP reporter gene assay, and manual and automated confocal microscopy platforms used to investigate the binding properties of BODIPY-TMR-CGP.
Key Results
BODIPY-TMR-CGP displayed a pharmacological profile similar to that of CGP 12177, retaining agonist activity at the secondary β1-adrenoceptor site. In confocal microscopy studies, specific BODIPY-TMR-CGP binding allowed clear visualization of β1-adrenoceptors in live cells. Using a wider concentration range of labelled ligand in a high-content fluorescence-based binding assay than is possible in radioligand binding assays, two-site inhibition binding curves of β-adrenoceptor antagonists were revealed in CHO cells expressing the human β1-adrenoceptor, but not the β2-adrenoceptor.
Conclusions and Implications
The fluorescent CGP 12177 analogue allowed the detection of the β1-adrenoceptor secondary site in both functional and binding studies. This suggests that BODIPY-TMR-CGP presents an important and novel fluorescent tool to investigate the nature of the secondary β1-adrenoceptor site.
Table of Links
| TARGETS | LIGANDS |
|---|---|
| β1-adrenoceptor | CGP 12177 |
| β2-adrenoceptor | CGP 20712A |
| Propranolol |
This Table lists key protein targets and ligands in this document, which are hyperlinked to corresponding entries in http://www.guidetopharmacology.org, the common portal for data from the IUPHAR/BPS Guide to PHARMACOLOGY (Pawson et al., 2014) and are permanently archived in the Concise Guide to PHARMACOLOGY 2013/14 (Alexander et al., 2013).
Introduction
CGP 12177 not only antagonizes β-adrenoceptor agonist responses at the high affinity catecholamine site (site 1) of the β1-adrenoceptor (Alexander et al., 2013), but has also been shown to exert agonist actions through a secondary, low-affinity ‘CGP 12177’ site (site 2) of the β1-adrenoceptor. This complex pharmacology has been observed in both recombinant cells (Pak and Fishman, 1996; Konkar et al., 2000b; Baker et al., 2003a; Joseph et al., 2004), and human (Kaumann and Molenaar, 2008) and animal tissue preparations (Lowe et al., 2002; Sillence et al., 2005). Other β-adrenoceptor ligands, such as pindolol, have also been shown to cause agonist effects through the secondary β1-adrenoceptor site (Baker et al., 2003a; Joseph et al., 2003), but despite recent advances due to mutagenesis studies (Baker et al., 2008; 2014,), the molecular nature of this binding site is not yet fully understood.
CGP 12177 has been labelled with radioisotopes (Staehelin et al., 1983; Dubois et al., 1996) and used extensively to determine affinity values of unlabelled antagonists at the high affinity catecholamine site (Joseph et al., 2004; Baker, 2005). Due to the limitations of using radioligands at high concentrations and a lack of other labelled probes, the secondary β1-adrenoceptor site has thus far been only detected in functional studies. Whilst cell-based ligand binding studies are traditionally carried out using radiolabelled ligands (Hulme and Trevethick, 2010), fluorescently labelled ligands have become available in recent years (Middleton and Kellam, 2005; Daly et al., 2010; Vernall et al., 2012) that allow visualization of the receptor of interest in its native environment (Becker et al., 2001; Schneider et al., 2007). In addition, fluorescent ligands can be used in functional and ligand binding studies in single cell and cell population assays with both primary and recombinant cells (Baker et al., 2003b; Hara et al., 2009; May et al., 2010; Stoddart et al., 2012).
A large variety of fluorophores are commercially available, and BODIPY derivatives in particular have been widely used in biology to achieve the labelling of protein targets (Hara et al., 2009; Rayo et al., 2011; Ying and Branchaud, 2011). Fluorescent ligands are generated by chemically coupling a fluorophore to the ligand of interest via a linker (Middleton and Kellam, 2005). However, the fluorophore itself is comparable in size with a small molecular weight ligand and thus can markedly influence the pharmacology of that ligand (Baker et al., 2010; Vernall et al., 2012), making it imperative to fully characterize the fluorescent ligand at the receptor of interest. Bordifluoropyrromethane-tetramethylrhodamine-(±)CGP 12177 (BODIPY-TMR-CGP) is a TMR derivative of the β-adrenoceptor ligand CGP 12177 and its binding and functional properties have been characterized at the human β2-adrenoceptors in CHO cells (Baker et al., 2003b). It has also been used for visualization of adrenoceptors in mouse vascular tissue (Daly et al., 2010). To date, no fluorescent ligand has been fully evaluated at the human β1-adrenoceptor, but the high affinity of CGP 12177, with which it antagonizes β-adrenoceptor agonist responses at the endogenous catecholamine site of the β1-adrenoceptor, suggests a potential use of a fluorescent CGP 12177 derivative to visualize the human β1-adrenoceptor. Furthermore, a fluorescent ligand that displays a similar pharmacology to CGP 12177 at the β1-adrenoceptor would allow a detailed investigation of the secondary ‘CGP 12177’ site 2 of the receptor.
In this study, we characterized BODIPY-TMR-CGP as a novel fluorescent ligand for the β1-adrenoceptor and show that BODIPY-TMR-CGP is an ideal tool for labelling both the high-affinity catecholamine and low-affinity ‘CGP 12177’ site of the human β1-adrenoceptor in living cells.
Methods
Cell culture
A CHO cell line stably expressing the reporter gene secreted placental alkaline phosphatase (SPAP), under the transcriptional control of a six-cAMP response element (CRE) promoter (CHO-CS cells) was used as a control, as appropriate. CHO-CS cell lines either expressing human β1-adrenoceptors (CHO-β1 cells), SNAP-tagged human β1-adrenoceptor (CHO-ssβ1 cells) or human β2-adrenoceptors (CHO-β2 cells) were used. CHO-CS, CHO-β1 and CHO-β2 cells were grown at 37°C in DMEM/nutrient mixture F12 (DMEM-F12) containing 10% (v v−1) fetal calf serum and 2 mM L-glutamine in a humidified 5% CO2/95% air atmosphere. CHO-ssβ1 cells were grown in the same media, but supplemented with 0.5 mg·mL−1 geneticin to maintain selection.
Measuring CRE-mediated SPAP transcription
CRE-dependent transcription of SPAP was determined as previously described (Baker et al., 2002). Briefly, cells were incubated with antagonists for 1 h at 37°C in a 5% CO2/95% air atmosphere followed by 5 h of incubation with agonist. SPAP activity was quantified by following the colour change caused by the hydrolysis of SPAP substrate p-nitrophenol phosphate. Levels of p-nitrophenol were quantified by measuring absorbance at 405 nm using an MRX plate reader (Dynatech Labs, Chantilly, VA, USA).
Confocal microscopy
Confocal microscopy was performed using a Zeiss LSM710 laser scanning microscope with a 40 × 1.3 NA oil immersion lens. Cells were grown to confluence in 8-well Labtek borosilicate chambered-cover glasses (Nalgene Nunc International, Fisher Scientific). On the day of experimentation, cells were washed in prewarmed HEPES-buffered saline solution (HBS) (Briddon et al., 2004) containing 4.5 mM D-glucose. For saturation binding studies, increasing concentrations of fluorescent ligand were added to cells for 10 min at room temperature (RT) in the dark, after which the cells were imaged immediately (1024 × 1024 pixels, averaging at four frames). For displacement binding studies, competing ligand was added for 30 min (37°C) followed by addition of fluorescent ligand (10 min, RT, in dark) before imaging. For SNAP-tag labelling, 1 μM BG-488 in fresh cell culture media was added to CHO-ssβ1 cells and incubated for 30 min (RT, in the dark). The cells were then washed twice in HBS and then treated as described earlier. The 543 nm HeNe and 488 nm argon lasers were used to excite BODIPY-TMR-CGP and BG-488 respectively. A variable spectral detection system was used to capture emission at 545–580 and 480–530 respectively. Confocal settings for laser power, offset and gain were kept constant throughout each experiment set. Quantitative analysis was performed using Zen software (Carl Zeiss, Jena, Germany) by measuring the average pixel intensity for each image.
Automated live cell imaging using the ImageXpress ultra confocal plate reader
This assay was based on that described by Stoddart et al. (2012). CHO-β1 and CHO-β2 cells were grown to confluence in 96-well black clear-bottom plates (Greiner Bio-One Ltd, Stonehouse, UK). On the day of experimentation, the cells were washed with prewarmed HEPES-HBS (Briddon et al., 2004) containing 4.5 mM D-glucose. The cells were then incubated with HBS containing increasing concentrations of antagonist (60 min, 37°C, unless otherwise stated). BODIPY-TMR-CGP was then added to the required wells of the assay plate and incubated for 1 h at RT (circa 21°C) in the dark, unless otherwise stated. Following this, the cells were washed in HBS removing all ligands. Fresh HBS was added to each well and the assay plate (four central sites per well) was immediately imaged on the IX ultra confocal plate reader (Molecular Devices, Sunnyvale, CA, USA) using a Plan Fluor 40× NA0.6 extra-long working distance objective. A 561 nm laser line was used to excite BODIPY-TMR-CGP and emission was captured through a 565–605 nm band pass filter. The focus and laser gain settings used were adjusted and optimized for each assay plate. A multi-wavelength cell scoring algorithm within the MetaXpress software (MetaXpress 2.0, Molecular Devices) was used to obtain total image intensities. Total (absence of antagonist) and non-specific (presence of 100 μM of an unrelated antagonist) binding levels of BODIPY-TMR-CGP in CHO-β1 and CHO-β2 cells were determined on each assay plate to allow for data normalization.
Data analysis
GraphPad Prism 5.0 (GraphPad Software, San Diego, CA, USA) was used to fit all data presented in this study. Sigmoidal agonist concentration-response curves were fitted to a four-parameter logistic equation to obtain agonist pEC50 values as described previously (Hopkinson et al., 2000). The affinity (KD) of partial agonists was determined from their concentration-response curves using a full agonist concentration-response curve as a reference and the operational model of partial agonism (Leff et al., 1993; Baker et al., 2003a). Antagonist pA2 values were obtained from the simultaneous global analysis of agonist concentration-response curves in the absence and presence of fixed concentrations of antagonist, using a modified Schild equation (Lew and Angus, 1995). If the competing ligand in these experiments was a partial agonist, its dissociation constants were estimated according to the Stephenson method (Stephenson, 1956).
In fluorescent binding studies, total BODIPY-TMR-CGP binding was quantified to give BODIPY-TMR-CGP KD values by fitting average pixel intensity values determined for increasing BODIPY-TMR-CGP concentrations to the following equation:
where BMAX is the maximal average pixel intensity, L is the BODIPY-TMR-CGP concentration, M is the slope of the linear non-specific binding component and C is the background image intensity. IC50 values of unlabelled antagonists were determined from competition binding studies using the following one-site inhibition equation:
where Totals is the level of total BODIPY-TMR-CGP binding, NSB is the level of non-specific BODIPY-TMR-CGP binding, [D] is the concentration of the unlabelled inhibitor ligand and IC50 is the concentration of this inhibitor ligand to achieve a 50% inhibition of total BODIPY-TMR-CGP. If the inhibition of BODIPY-TMR-CGP binding followed two phases, a two-site inhibition equation was used:
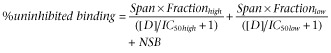 |
where [D] and NSB are as defined earlier, Span is the difference between the level of total and non-specific binding of the fluorescent ligand and Fractionhigh and Fractionlow represent the proportion of fluorescent ligand binding that is inhibited by lower inhibitor concentrations (yielding IC50high) and higher inhibitor concentrations (yielding IC50low). From the IC50 values, the affinity values (KI) were calculated using the Cheng-Prusoff equation:
where [L] is the BODIPY-TMR-CGP concentration, KD is its affinity value determined in the CRE-SPAP assay and the IC50 is calculated using the above inhibition binding equations.
All data in the text of the Results section and the tables are presented as mean ± SEM from n separate experiments. In some of the figures, data are presented as mean ± SEM from triplicate determinations in representative experiments. Statistical analysis was performed on the summary data from n separate experiments where appropriate and as detailed in the text and tables, with P < 0.05 reflecting statistical significance.
Materials
Cell culture plastics were purchased from Fisher Scientific (Loughborough, UK) and cell culture reagents were from Sigma Aldrich (Gillingham, UK) except for fetal calf serum, which was obtained from PAA Laboratories (Pasching, Austria). SNAP-Surface™ Alexa Fluor ®488 was obtained from New England Biolabs (Ipswich, MA, USA). BODIPY-TMR-CGP was from Molecular Probes (Leiden, the Netherlands) and unlabelled CGP 12177, propranolol and CGP 20712A were from Tocris Cookson (Avonmouth, Bristol, UK). All other reagents were from Sigma Chemicals (Poole, UK).
Results
Two-site CGP 12177-like functional responses of BODIPY-TMR-CGP at the human β1-adrenoceptor
In CHO-β1 cells (BMAX = 1146.7 fmol·mg−1 protein; Baker et al., 2003a), CGP 12177 stimulated SPAP transcription to yield a pEC50 of 7.73 ± 0.12 (n = 13) with an EMAX of 46.7 ± 3.7% (n = 13) of the maximum cimaterol response (Figure 1A, Table 2013). This is similar to previously published data (Pak & Fishman, 1996; Konkar et al., 2000a; Baker et al., 2003a). BODIPY-TMR-CGP caused a concentration-dependent CRE-mediated secretion of SPAP that was 25.6 ± 3.2% (n = 8) of the maximum cimaterol response with a pEC50 of 7.12 ± 0.13 (n = 8, Figure 1A, Table 2013), and thus, like its parent compound CGP 12177, appeared to be a partial agonist in this system. Using cimaterol as a full agonist to determine the system maximum response, estimated affinity values of CGP 12177 and BODIPY-TMR-CGP were extracted from their concentration-response curves using the operational model of partial agonism (Leff et al., 1993), and were determined to be 7.58 ± 0.13 (n = 13) and 7.06 ± 0.13 (n = 8) respectively. However, the agonist effect of CGP 12177 has been reported to be mediated through a secondary, low-affinity site of the β1-adrenoceptor (site 2) in in vitro (Pak and Fishman, 1996; Konkar et al., 2000b; Baker et al., 2003a) and ex vivo studies (Kompa and Summers, 1999; Kaumann et al., 2001). To confirm the low affinity of BODIPY-TMR-CGP for the secondary β1-adrenoceptor site, CGP 12177 concentration-response curves were obtained in the absence and presence of two fixed concentrations of BODIPY-TMR-CGP, giving a pKD value of 7.28 ± 0.22 (n = 3, Figure 1B). This was in good agreement with the affinity value derived from its partial agonist response curve (P > 0.05, unpaired t-test) and suggests that the BODIPY-TMR-CGP and CGP 12177 agonist responses are mediated through the same secondary β1-adrenoceptor site.
Figure 1.
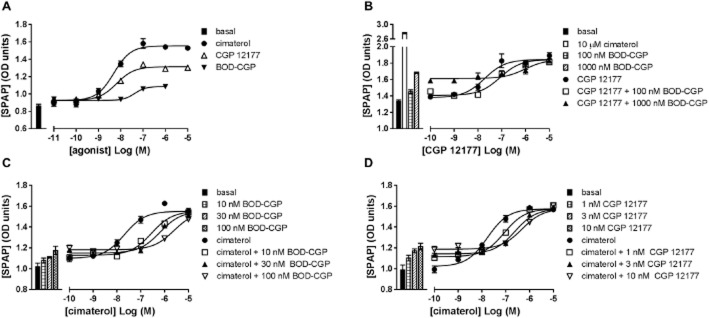
(A) CRE-mediated SPAP secretion in response to cimaterol, CGP 12177 and BODIPY-TMR-CGP (BOD-CGP) in CHO-β1 cells. (B) SPAP secretion in response to CGP 12177 in the absence and presence of increasing BODIPY-TMR-CGP concentrations. (C) SPAP production of cimaterol in the presence and absence of increasing concentrations of CGP 12177 and (D) BODIPY-TMR-CGP. The bars represent SPAP secretion from unstimulated cells (basal; all panels), SPAP production in response to fixed BODIPY-TMR-CGP (panels B and D) and CGP 12177 (panel C) concentrations used and SPAP secretion in response to 10 μM cimaterol (panel D). Data points are mean ± SEM of triplicate determinations from a single experiment and are representative of three to 14 separate experiments. Summary data from the repeat experiments and statistical analysis are provided in Table 2013 and the text.
Table 1.
Potency and affinity parameters of BODIPY-TMR-CGP compared with its parent compound CGP 12177 in CHO-β1 cells
| CGP 12177 | n | BODIPY-TMR-CGP | n | |
|---|---|---|---|---|
| pEC50 | 7.73 ± 0.12 | 13 | 7.12 ± 0.13 | 8 |
| EMAX (% cimaterol) | 46.7 ± 3.7* | 13 | 25.6 ± 3.2* | 8 |
| pKA (partial agonism) | 7.58 ± 0.13 | 13 | 7.06 ± 0.13 | 8 |
| pKD (against cimaterol) | 9.61 ± 0.06 | 10 | 9.23 ± 0.06 | 10 |
| pKD (against CGP 12177) | NA | 7.28 ± 0.22 | 3 | |
| pKD propranolol | 6.04 ± 0.18 | 5 | 6.46 ± 0.26 | 3 |
Data are mean ± SEM of (n) numbers of separate experiments. Examples of individual experiments from which these combined data have been obtained are provided in Figures 3. NA, not applicable.
Significantly different from zero P < 0.0001 (one-sample t-test).
Next, the affinity value of BODIPY-TMR-CGP at the primary high-affinity site of the β1-adrenoceptor (site 1) was examined. Fixed concentrations of BODIPY-TMR-CGP (Figure 1C) caused parallel rightward shifts of the cimaterol concentration-response curves consistent with competitive antagonism. However, the baselines of the cimaterol concentration-response curves were raised in the presence of the fluorescently labelled CGP 12177 in a manner consistent with its agonist effects. Using the method of Stephenson (1956), a pKD value of 9.23 ± 0.06 (n = 10) was derived from these curves for BODIPY-TMR-CGP. Similar data were obtained for CGP 12177 (Figure 1D), for which a pKD of 9.61 ± 0.06 (n = 10) was determined. The affinity values of BODIPY-TMR-CGP and CGP 12177 determined against cimaterol were two orders of magnitude different to the affinity values derived from their respective partial agonist response curves, which is consistent with the two-site binding hypothesis described for the β1-adrenoceptor (Pak and Fishman, 1996; Konkar et al., 2000b; Baker et al., 2003a). This difference in affinities for the high- (site 1) and low-affinity (site 2) β1-adrenoceptor sites has also been reported for a range of β-adrenoceptor antagonists (Konkar et al., 2000b; Baker et al., 2003a; Joseph et al., 2004). Indeed, cimaterol concentration-response curves were antagonized by the selective β1-adrenoceptor antagonist CGP 20712A and the classical β-adrenoceptor antagonist propranolol yielding pKD values of 8.84 ± 0.11 (n = 5) and 8.65 ± 0.07 (n = 23; Figure 2A,B), respectively, whereas CGP 12177 concentration-response curves were antagonized to yield pKD values of 6.87 ± 0.20 (n = 6) and 6.04 ± 0.18, respectively (n = 5; Figure 2C,D), which is in line with previous reports (Baker et al., 2014).
Figure 2.
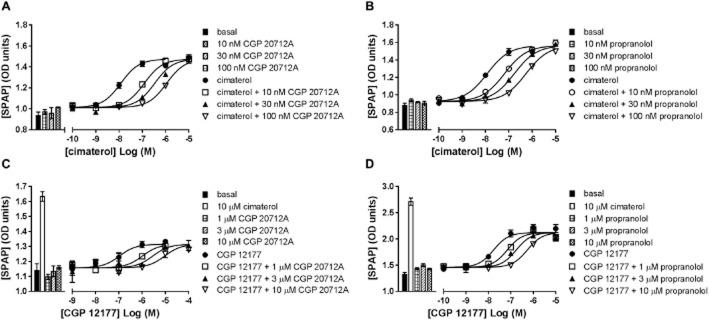
SPAP secretion induced by cimaterol in the absence and presence of 10, 30 and 100 nM (A) CGP 20712A and (B) propranolol. CRE-mediated SPAP secretion in response to CGP 12177 in the absence and presence of 1, 3 and 10 μM (C) CGP 20712A and (D) propranolol. Bars represent basal SPAP secretion from unstimulated cells (all panels), SPAP secretion in response to 10 μM cimaterol (panels C and D) and SPAP production in response to the fixed concentrations of antagonists used in the respective experiments of panels A–D. Data points are mean ± SEM of triplicate determinations of a single experiment which is representative of five to 23 separate experiments. Summary data from the repeat experiments and statistical analysis are provided in Table 2013 and the text.
To demonstrate that the BODIPY-TMR-CGP agonist response, like the CGP 12177 agonist response, requires much higher β-blocker concentrations to be inhibited compared with the cimaterol agonist response, BODIPY-TMR-CGP-stimulated SPAP secretion was measured in the absence and presence of 1 μM propranolol, giving an apparent pKD value for propranolol of 6.46 ± 0.26 (n = 3, Figure 3). The similar affinity values of propranolol obtained against CGP 12177 and BODIPY-TMR-CGP (P > 0.05, unpaired t-test) further suggest that both the unlabelled and labelled ligand exert their agonist actions through the same secondary, low-affinity site of the β1-adrenoceptor.
Figure 3.
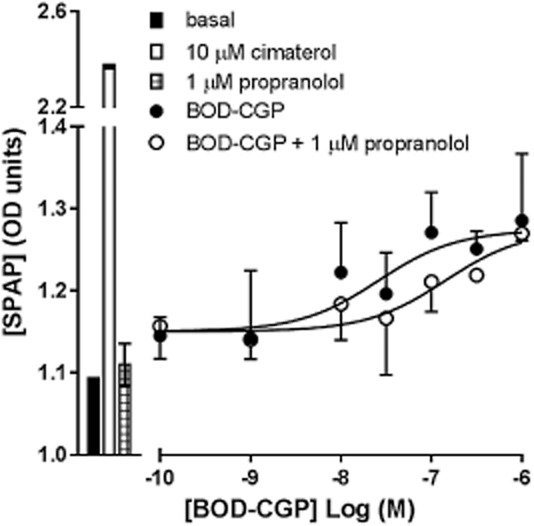
SPAP secretion induced by BODIPY-TMR-CGP (BOD-CGP) in the absence and presence of 1 μM propranolol. Bars represent basal SPAP secretion from unstimulated cells, SPAP secretion in response to 10 μM cimaterol and 1 μM propranolol alone. Data points are mean ± SEM of triplicate determinations of a single experiment, which is representative of three separate experiments. Summary data from the repeat experiments and statistical analysis are provided in Table 2013 and the text.
BODIPY-TMR-CGP binding to the human β1-adrenoceptor
In order to determine whether BODIPY-TMR-CGP was able to specifically label the β1-adrenoceptor, its binding to a SNAP-tagged β1-adrenoceptor in CHO-ssβ1 cells was assessed. The cell impermeable SNAP-tag substrate SNAP-Surface® 488 (BG-488; New England Biolabs) was used to label cell surface SNAP-tagged β1-adrenoceptors. Clear membrane labelling could be seen in CHO-ssβ1 cells when imaged using the 488 nm (green) channel (Figure 4). 2 nM BODIPY-TMR-CGP (circa 3× KD concentration at β1-adrenoceptor site 1) was able to bind to CHO-ssβ1 cells and clear membrane labelling was observed in the 543 nm (red) channel (Figure 4). When superimposed, the binding of the fluorescent ligand was clearly seen to localize well with the cell membrane SNAP-tagged β1-adrenoceptor fluorescence (yellow pixels; Figure 4). Furthermore, BODIPY-TMR-CGP binding levels were reduced in the presence of the selective β1-adrenoceptor antagonist CGP 20712A (100 nM; 60 × KD concentration at β1-adrenoceptor site 1) whilst good SNAP-tagged β1-adrenoceptor labelling with BG-488 was retained. This highlights the specificity of BODIPY-TMR-CGP binding to SNAP-tagged β1-adrenoreceptors.
Figure 4.
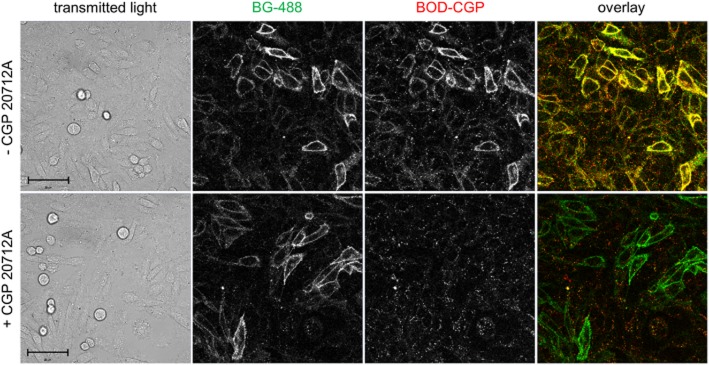
Binding of 2 nM BODIPY-TMR-CGP (BOD-CGP) to CHO-ssβ1 cells in the absence (upper panels) and presence of 100 nM CGP 20712A (lower panels). The panels from left to right show the phase contrast image of the field of view imaged (transmitted light), the fluorescence monitored in the green (488 nm) channel (BG-488 labelled SNAP-tagged β1-adrenoceptors), the fluorescence monitored in the red (561 nm) channel (2 nM BOD-CGP), and an overlay of the images collected in the 488 nm (Ch1) and 561 nm (Ch2) channel with colocalization of red and green fluorescence shown by the yellow pixels. Prior to imaging, the CHO-ssβ1 cells were incubated with 1 μM BG-488 (30 min, 37°C) to label SNAP-tagged β1-adrenoceptors. The cells were then washed and pre-incubated with 100 nM CGP 20712A (30 min, 37°C) before the cells were exposed to 2 nM BOD-CGP (10 min, 21°C). Both CGP 20712A and BOD-CGP were not washed out before imaging. Scale bars = 50 μm.
Following this, the binding of a wider range of concentrations (3–100 nM) of BODIPY-TMR-CGP to the native (unlabelled) human β1-adrenoceptor was assessed. Clear concentration-dependent membrane labelling was seen up to 50 nM in CHO-β1 cells (Figure 5). At BODIPY-TMR-CGP concentrations higher than 50 nM, intracellular BODIPY-TMR-CGP could be seen in addition to membrane labelling. A similar observation was reported for this ligand in CHO cells expressing the β2-adrenoceptor (Baker et al., 2003b). The level of total BODIPY-TMR-CGP binding was quantified by determining the average pixel intensities for each image, which was then plotted against the BODIPY-TMR-CGP concentrations used, to obtain a saturation binding plot. This was analysed using a total binding fit that incorporates a linear component to account for non-specific binding (and any β1-adrenoceptor site 2 binding that will be linear within this concentration range). This yielded a pKD value for BODIPY-TMR-CGP at site 1 of 7.65 ± 0.07 (n = 3).
Figure 5.
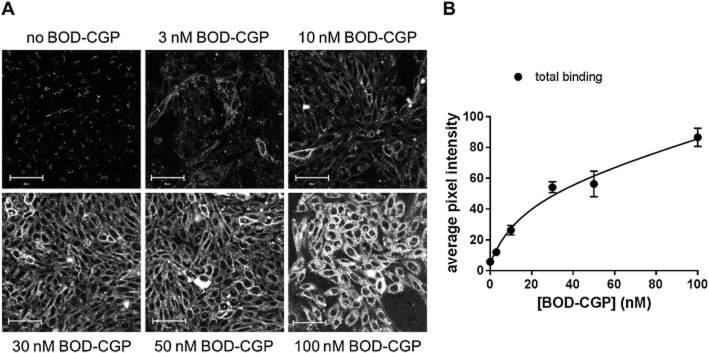
(A) Confocal images of CHO-β1 cells exposed to 3–100 nM BODIPY-TMR-CGP (BOD-CGP; 10 min, 21°C). Scale bar = 50 μm. (B) Quantitative data obtained from images shown in (A). Total image intensity analysis was used to determine total BODIPY-TMR-CGP binding levels and data were fitted using a total binding saturation equation that includes a linear component to account for non-specific binding. Images are from one experiment and are representative of at least two additional images taken on the same day and of two additional experiments. The pKD obtained from the saturation fits obtained in three different experiments was 7.65 ± 0.07.
To further investigate the specificity of BODIPY-TMR-CGP binding to the β1-adrenoceptor, competition binding experiments were carried out. Pre-incubation with increasing concentrations of the selective β1-adrenoceptor antagonist CGP 20712A inhibited the binding of 20 nM BODIPY-TMR-CGP in CHO-β1 cells (Figure 6). The pIC50 value obtained for the inhibition of 20 nM BODIPY-TMR-CGP binding by CGP 20712A was 8.76 ± 0.18 (n = 3). Non-specific binding of 20 nM BODIPY-TMR-CGP was determined in CHO-CS cells and the fluorescence background levels were similar to the levels obtained when imaging 20 nM BODIPY-TMR-CGP in the presence of high concentrations of antagonist. Interestingly, the Hill slope of the CGP 20712A inhibition binding curve was −0.72 ± 0.06 (n = 3), which was significantly shallower than a slope of unity (P < 0.05, one-sample t-test). The affinity values determined from the functional responses indicate that 20 nM BODIPY-TMR-CGP binds circa 17% of the low-affinity, secondary site. It is likely that the shallower slope is a result of a component of the binding of BODIPY-TMR-CGP to this secondary site where it is less readily displaced by CGP 20712A. With this in mind, we hypothesized that using a BODIPY-TMR-CGP concentration that predominantly binds to the high affinity β1-adrenoceptor site will produce an inhibition curve with a slope closer to unity. Indeed, when 2 nM BODIPY-TMR-CGP (binds 2% of secondary site) was used for competition experiments, a slope of −1.06 ± 0.14 (n = 4; P > 0.05, one-sample t-test comparison to slope of unity) was determined. Normalization of the inhibition-specific binding curves obtained with 2 and 20 nM BODIPY-TMR-CGP allowed them to be compared directly (Figure 7).
Figure 6.

Confocal images of 20 nM BODIPY-TMR-CGP binding to CHO-β1 cells in the absence and presence of increasing concentrations of CGP 20712A. The non-specific binding levels of 20 nM BODIPY-TMR-CGP were determined in CHO-CS cells. The images shown are representative of two additional images taken of different field of views within the same well and are representatives of images taken on a total of three separate experimental days. Scale bar = 50 μm. Total image fluorescence intensity values were derived from these images to quantify BODIPY-TMR-CGP binding, which is shown in Figure 7.
Figure 7.
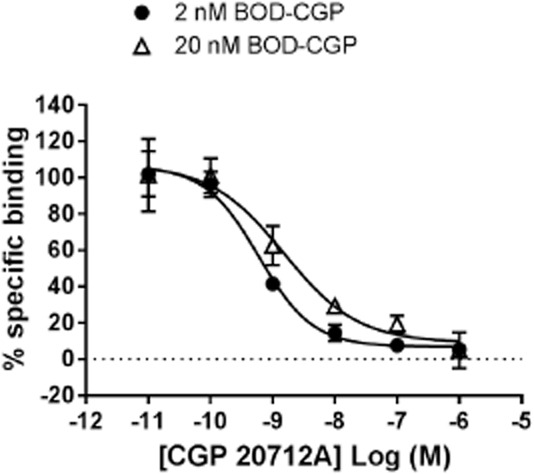
CGP 20712A inhibition of 2 and 20 nM BODIPY-TMR-CGP (BOD-CGP) binding to CHO-β1 cells. Total and non-specific binding of BODIPY-TMR-CGP was determined in CHO-β1 and CHO-CS cells, respectively, and were used to determine normalized specific binding data for both inhibition binding curves (total binding 100%, non-specific binding 0%). Data shown are pooled data from three to four separate experiments. Summary data and statistical analysis are presented in the text.
Determining two-site BODIPY-TMR-CGP inhibition binding curves using the high-content IX ultra confocal plate reader
To further investigate the BODIPY-TMR-CGP competition-binding curves, we used the IX ultra confocal plate reader in an automated live cell fluorescent ligand binding approach (Stoddart et al., 2012). This allowed a better definition of concentration-displacement curves and provided an unbiased measure of ligand binding. First, we repeated the binding data obtained manually in 8-well plates using the Zeiss710 LSM confocal microscope in the high-content screen automated format using 96-well plates and the IX ultra confocal plate reader. The same incubation times and temperatures for both antagonist and fluorescent ligand incubations were used; however, all ligands were washed out before imaging on the confocal plate reader to reduce fluorescence background levels. The IX ultra confocal plate reader captured four different sites per well and read an entire assay plate in vertical serpentine fashion. The montage image gave a good indication of the level of 20 nM BODIPY-TMR-CGP binding in the presence of increasing CGP 20712A concentrations across the plate (Figure 8A,B). The data were quantified using the MetaXpress software and integrated fluorescence intensity (average fluorescence intensity per pixel) of the whole image was plotted against the CGP 20712A concentrations used (Figure 8C). The inhibition curve obtained using the automated imaging platform compared well with the inhibition curve obtained using a manual imaging approach; however, a clear secondary shoulder could be seen at higher CGP 20712A concentrations in the better-defined 12-point inhibition-binding curve (Figure 8C). This was analysed separately using a two-site equation to yield pIC50 values for site 1 and site 2 of 8.49 ± 0.04 and 4.89 ± 0.24 (n = 3), respectively, with the high-affinity binding site representing 89.4 ± 3.0% of the total specific binding (n = 3; Figure 8C).
Figure 8.
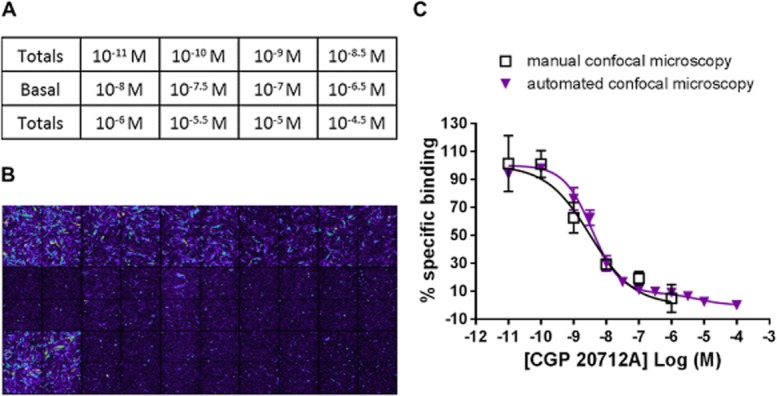
Inhibition of 20 nM BODIPY-TMR-CGP (BOD-CGP) binding to the human β1-adrenoceptor. (A) Plate map of 15 wells highlighting the designated wells for total and non-specific (basal) binding levels of 20 nM BODIPY-TMR-CGP and chosen concentrations of CGP 20712A. (B) montage image of 20 nM BODIPY-TMR-CGP binding levels in all 15 wells (four images per well) used in this experiment. (C) Comparison of CGP 20712A inhibition binding curves determined manually using the Zeiss LSM710 confocal microscope with CGP 20712A inhibition curves determined using the IX Ultra automated confocal plate reader. The manual confocal microscopy data are the same as shown in Figure 7. The automated confocal microscopy data shown are from a single experiment with the error bars indicating range of error for duplicate determinations for all CGP 20712A concentrations. This experiment is representative of three separate experiments. The mean data from these three separate experiments were analysed using a two-site equation to yield pIC50 values for site 1 and site 2 of 8.49 ± 0.04 and 4.89 ± 0.24 (n = 3), respectively, with the high affinity binding site representing 89.4 ± 3.0% of the total specific binding.
Initial experiments were designed to match previous experimental conditions used on the Zeiss710 LSM. However, to get nearer to equilibrium conditions, the antagonist and BODIPY-TMR-CGP pre-incubation times were increased to 1 h. Using the IX ultra confocal plate reader, it was not possible to use a concentration as low as 2 nM BODIPY-TMR-CGP due to a low signal : noise ratio. Instead, we used higher concentrations of BODIPY-TMR-CGP with the expectation that increasing concentrations of the fluorescent CGP 12177 analogue would increase the occupancy of the second low-affinity β1-adrenoceptor site. Displacement experiments were conducted with 10, 20 and 100 nM BODIPY-TMR-CGP in the presence of increasing concentrations of CGP 20712A (Figure 9A), propranolol (Figure 9B) or CGP 12177 (Figure 9C) in CHO-β1 cells. As expected, the second phase of the two-phase binding curve appeared to become more pronounced for all unlabelled ligands with increasing BODIPY-TMR-CGP concentrations. This was reflected in a significant increase in the fraction of BODIPY-TMR-CGP bound to the secondary, low-affinity site with increasing concentration of BODIPY-TMR-CGP from 10 nM (12.9 ± 1.1%, n = 3) to 100 nM (42.8 ± 0.9%, n = 3) respectively (P < 0.05, two-way anova followed by Bonferroni's post hoc test; Table 2005). Rightward shifts of the antagonist inhibition curves with increasing BODIPY-TMR-CGP concentrations were also observed for all antagonists used, at both the high-affinity and the low-affinity β1-adrenoceptor sites. As such, the IC50 values of CGP 20712A, propranolol and CGP 12177 were significantly higher when inhibiting 100 nM BODIPY-TMR-CGP compared with 10 nM BODIPY-TMR-CGP at both site 1 and site 2 (P < 0.05, two-way anova followed by Bonferroni's post hoc test; Table 2002). Assuming simple mass action equilibria, the affinity values of antagonists that are competing for the same binding site as the labelled ligand can be determined from the IC50 values using the Cheng-Prusoff equation. Taking into account the BODIPY-TMR-CGP concentrations used and the affinity of BODIPY-TMR-CGP for site 1 and site 2 of the β1-adrenoceptor (as determined in the CRE-mediated SPAP transcription assay), antagonist affinity values were calculated for each BODIPY-TMR-CGP concentration and are summarized in Table 2002.
Figure 9.
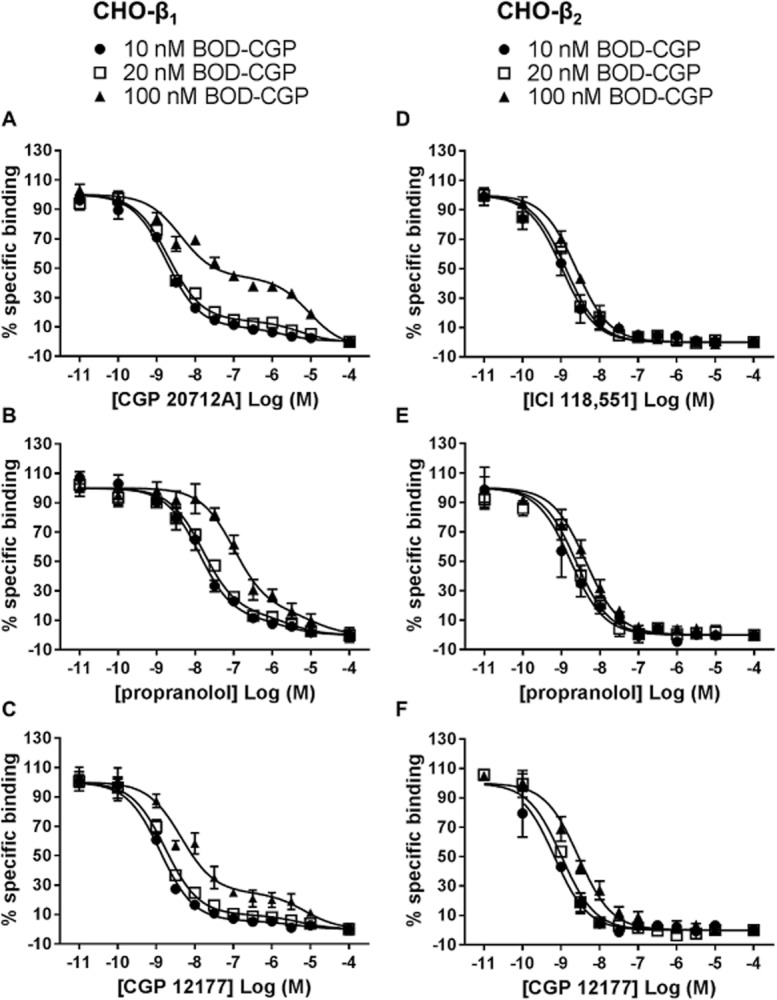
Displacement of 10, 20, 100 nM BODIPY-TMR-CGP (BOD-CGP) binding to CHO-β1 cells by (A) CGP 20712A, (B) propranolol and (C) CGP 12177, and displacement of 10, 20, 100 nM BODIPY-TMR-CGP binding to CHO-β2 cells by (D) ICI 118,551 and (E) propranolol and (F) CGP 12177. The data were normalized to total binding (BOD-CGP binding to CHO-β1 or CHO-β2 cells; 100%) and non-specific binding (BOD-CGP binding to CHO-β1 or CHO-β2 cells in the presence of 100 μM antagonist; 0%) for each BODIPY-TMR-CGP concentration used. The normalized data are the mean ± SEM of three separate experiments pooled together. The binding parameters obtained from these data and statistical analyses are presented in Tables ,,.
Table 2.
Summary of fraction of 10, 20 and 100 nM BODIPY-TMR-CGP (BOD-CGP) bound to the secondary, low-affinity β1-adrenoceptor site in the presence of CGP 20712A, propranolol or CGP 12177
| Fraction of BOD-CGP bound to the low-affinity binding site (%)a | ||||||
|---|---|---|---|---|---|---|
| CGP 20712A | n | Propranolol | n | CGP 12177 | n | |
| 10 nM BOD-CGP | 11.9 ± 1.1 | 3 | 10.7 ± 0.4 | 3 | 7.4 ± 1.3 | 3 |
| 20 nM BOD-CGP | 14.0 ± 1.4 | 3 | 13.0 ± 0.6 | 3 | 11.2 ± 0.6 | 3 |
| 100 nM BOD-CGP | 42.8 ± 0.9*b,c,d | 3 | 27.9 ± 3.7*b,c | 3 | 27.8 ± 2.1*b,c | 3 |
Data are mean ± SEM of (n) numbers of separate experiments.
In all cases the values obtained for the fraction of low-affinity binding are significantly different from zero (P < 0.01 apart from CGP 12177 with 10 nM BOD-CGP which was P < 0.05; one-sample t-test).
Denotes statistical significance (P < 0.05) from the fraction of high-affinity site binding determined for b10 nM and c20 nM BODIPY-TMR-CGP for each antagonist tested, and ddenotes statistical significance (P < 0.05) of the low-affinity site binding fraction of 100 nM BODIPY-TMR-CGP determined for CGP 20712A compared to the low-affinity binding site fractions of 100 nM BODIPY-TMR-CGP determined for propranolol and CGP 12177, as determined by two-way anova followed by Bonferroni's multiple comparison test. Data were obtained from Figure 9A–C.
Table 3.
Summary of pIC50 and pKI values of CGP 20712A, propranolol and CGP 12177 against 10, 20 and 100 nM BODIPY-TMR-CGP (BOD-CGP) binding to CHO-β1 cells
| CGP 20712A | Propranolol | CGP 12177 | |||||||
|---|---|---|---|---|---|---|---|---|---|
| Site 1a | Site 2 | n | Site 1a | Site 2 | n | Site 1a | Site 2 | n | |
| pIC50 | |||||||||
| 10 nM BOD-CGP | 8.77 ± 0.05 | 5.55 ± 0.04 | 3 | 7.94 ± 0.18 | 5.33 ± 0.12 | 3 | 8.93 ± 0.04 | 5.57 ± 0.20 | 3 |
| 20 nM BOD-CGP | 8.68 ± 0.03 | 5.27 ± 0.07 | 3 | 7.76 ± 0.13 | 5.19 ± 0.09 | 3 | 8.77 ± 0.07 | 5.36 ± 0.15 | 3 |
| 100 nM BOD-CGP | 8.10 ± 0.17*b,c | 5.11 ± 0.09*b | 3 | 7.12 ± 0.02*b,c | 5.01 ± 0.06 | 3 | 8.19 ± 0.13*b | 5.27 ± 0.16 | 3 |
| pKI | |||||||||
| 10 nM BOD-CGP | 10.01 ± 0.05 | 5.60 ± 0.05 | 3 | 9.19 ± 0.18 | 5.37 ± 0.12 | 3 | 10.18 ± 0.04 | 5.62 ± 0.20 | 3 |
| 20 nM BOD-CGP | 10.21 ± 0.04 | 5.36 ± 0.07 | 3 | 9.29 ± 0.13 | 5.33 ± 0.08 | 3 | 10.31 ± 0.07 | 5.45 ± 0.15 | 3 |
| 100 nM BOD-CGP | 10.32 ± 0.17 | 5.44 ± 0.09 | 3 | 9.34 ± 0.02 | 5.34 ± 0.06 | 3 | 10.42 ± 0.13 | 5.60 ± 0.16 | 3 |
The pKI values were determined using the Cheng-Prusoff equation and BODIPY-TMR-CGP affinity values for the β1-adrenoceptor site 1 and site 2 determined in the CRE-mediated SPAP transcription assay. Data are mean ± SEM of (n) numbers of separate experiments. Fitted parameters were obtained for each individual experiment and the data in the table represent the summary data.
In all cases, pIC50 and pKI values determined at site 1 were significantly different (P < 0.05; two-way anova followed by Bonferroni's multiple test comparison) from those determined for site 2.
Denotes statistical significance (P < 0.05) from the pIC50 value determined for b10 nM BODIPY-TMR-CGP and c20 nM BODIPY-TMR-CGP as determined by two-way anova followed by Bonferroni's multiple comparison test. The same analysis was performed for KI values of each antagonist (after correction for the presence of the fluorescent ligand as described in the Methods section), and as expected, no statistical difference (P > 0.05) was observed.
In order to confirm that the second site displacement binding curves seen at the β1-adrenoceptor were not an artefact of the experiment conditions used, we examined the binding of BODIPY-TMR-CGP to the human β2-adrenoceptor in CHO-β2 cells using the IX ultra confocal plate reader. BODIPY-TMR-CGP has previously been characterized at the β2-adrenoceptor in functional and fluorescence imaging binding studies, and unlike the β1-adrenoceptor, only one binding site has been described at the β2-adrenoceptor (Baker et al., 2003b). 10, 20 and 100 nM BODIPY-TMR-CGP binding was inhibited by β2-selective antagonist ICI 118,551 (Figure 9D) and non-selective β-adrenoceptor antagonists propranolol (Figure 9E) and CGP 12177 (Figure 9F), and the antagonist displacement binding curves were right-shifted in the presence of increasing BODIPY-TMR-CGP concentrations. As a result, increasing IC50 values were determined with increasing BODIPY-TMR-CGP concentrations for ICI 118,551, propranolol and CGP 12177 ( Table 2003a). From these IC50 values and the BODIPY-TMR-CGP affinity value reported in the literature for the β2-adrenoceptor (25 nM; Baker et al., 2003b), the antagonist affinity values were determined using the Cheng-Prusoff equation (Table 2003a). Importantly, all inhibition curves obtained in CHO-β2 cells preferred a one-phase binding fit, suggesting that the two-phase binding fit is specific of the ligand interactions with the β1-adrenoceptor.
Table 4.
Summary of IC50 and pKI values of ICI 118,551, propranolol and CGP 12177 against 10, 20 and 100 nM BODIPY-TMR-CGP (BOD-CGP) binding to CHO-β2 cells
| ICI 118,551 | n | Propranolol | n | CGP 12177 | n | |
|---|---|---|---|---|---|---|
| pIC50 | ||||||
| 10 nM BOD-CGP | 9.00 ± 0.25 | 3 | 8.91 ± 0.24 | 3 | 9.23 ± 0.09 | 3 |
| 20 nM BOD-CGP | 8.95 ± 0.12 | 3 | 8.65 ± 0.18 | 3 | 9.01 ± 0.19 | 3 |
| 100 nM BOD-CGP | 8.61 ± 0.02 | 3 | 8.43 ± 0.17 | 3 | 8.51 ± 0.13*a | 3 |
| pKI | ||||||
| 10 nM BOD-CGP | 9.14 ± 0.25 | 3 | 9.06 ± 0.24 | 3 | 9.37 ± 0.09 | 3 |
| 20 nM BOD-CGP | 9.20 ± 0.12 | 3 | 8.91 ± 0.18 | 3 | 9.27 ± 0.19 | 3 |
| 100 nM BOD-CGP | 9.31 ± 0.02 | 3 | 9.13 ± 0.17 | 3 | 9.20 ± 0.13 | 3 |
The pKI values were determined using the Cheng-Prusoff equation and the BODIPY-TMR-CGP affinity value for the β2-adrenoceptor reported by Baker et al. (2003b). Data are mean ± SEM of (n) numbers of separate experiments. Fitted parameters were obtained for each individual experiment and the data in the table represent the summary data.
Denotes statistical significance (P < 0.05) from the pIC50 value determined for a10 nM BODIPY-TMR-CGP as determined by one-way anova followed by Bonferroni's multiple comparison test. The same analysis was performed for KI values of each antagonist (after correction for the presence of the fluorescent ligand as described in the Methods section), and as expected, no statistical difference (P > 0.05) was observed.
Discussion and conclusions
CGP 12177 potently antagonizes agonist effects mediated via the catecholamine β1-adrenoceptor site, but has also been shown to exert agonist effects of its own through a secondary, low-affinity site or conformation of the β1-adrenoceptor (Pak and Fishman, 1996; Konkar et al., 2000b; Baker et al., 2003a; Joseph et al., 2004). Here, we have investigated the potential use of a fluorescently labelled analogue of CGP 12177, BODIPY-TMR-CGP (Baker et al., 2003b), to label the secondary, low-affinity site of the β1-adrenoceptor in living cells.
Like CGP 12177, BODIPY-TMR-CGP antagonized the effects of the full agonist cimaterol with high affinity (pKD = 9.23) through the catecholamine β1-adrenoceptor site, and also exerted partial agonist effects at higher concentrations (pEC50 = 7.12) in the CRE-mediated SPAP transcription assay. The affinity value of BODIPY-TMR-CGP derived from its partial agonist response curve (pKA = 7.06) was similar to that determined from CGP 12177 concentration-response curves that were shifted rightward in the presence of increasing concentrations of BODIPY-TMR-CGP (pKD = 7.28). According to classical receptor theory, the affinity values of a ligand for a given receptor (or receptor site) would be expected to be similar even though two different methods were used to derive the affinity value (Kenakin and Beek, 1984). This suggests that the agonist effects of BODIPY-TMR-CGP are, in fact, mediated through the same low-affinity β1-adrenoceptor site that causes the agonist effects of CGP 12177. However, the KD value determined for antagonism by BODIPY-TMR-CGP of cimaterol-stimulated CRE-SPAP production was two orders of magnitude lower (i.e. higher affinity) than the affinity value derived from its partial agonist response (or against CGP 12177). This is consistent with the two-site hypothesis of the β1-adrenoceptor (Molenaar et al., 2007; Kaumann and Molenaar, 2008). Furthermore, in order to shift the BODIPY-TMR-CGP concentration-response curve to a similar extent as the cimaterol concentration-response curve, a 100-fold higher concentration of propranolol needed to be used. A similar observation was made for CGP 1277 in this study and the previous studies (Pak and Fishman, 1996; Baker et al., 2003a; Kaumann and Molenaar, 2008). Interestingly, the affinity value of propranolol derived from the resulting shift of the BODIPY-TMR-CGP concentration-response curve (pKD = 6.46) was of a similar order to that obtained when inhibiting CGP 12177-mediated responses (pKD = 6.04). Similarly, higher affinities of at least 1.5 order of magnitude have been reported for propranolol and other β-adrenoceptor antagonists at the catecholamine site 1 of the β1-adrenoceptor when using cimaterol, isoprenaline, adrenaline or noradrenaline as the stimulating agonist (this study and Baker, 2005). This provides strong evidence that the differences in antagonist affinities seen for BODIPY-TMR-CGP when using cimaterol and CGP 12177 as agonists are due to the two ligands eliciting their agonist response through two different β1-adrenoceptor receptor sites or conformations.
The binding specificity of BODIPY-TMR-CGP was clearly demonstrated at both the SNAP-tagged and the native β1-adrenoceptor expressed in CHO cells in the absence and presence of the β1-adrenoceptor selective antagonist CGP 20712A. Furthermore, in CHO-β1 cells, the membrane labelling of BODIPY-TMR-CGP was clearly concentration-dependent. However, at concentrations of 50 nM and above, low levels of diffuse intracellular fluorescence were observed. CGP 12177 and its fluorescent counterpart have been described as hydrophilic ligands (Staehelin et al., 1983; Baker et al., 2003b), thus intracellular fluorescence may be due to internalization of the fluorescent ligand via the receptor (Baker et al., 2003b; Daly et al., 2010; Rose et al., 2012). However, no marked internalization of SNAP-tagged β1-adrenoceptors was observed and no distinguishable level or localization of BODIPY-TMR-CGP fluorescence was observed in untransfected (CHO-CS) cells compared with CHO-β1 cells pretreated with CGP 20712A. This suggests that there is a β1-adrenoceptor independent route for the low level uptake of fluorescent ligand into the intracellular compartment of these cells.
The affinity value for BODIPY-TMR-CGP derived from total binding saturation analysis (pKD = 7.65) was similar to the affinity values determined for the low-affinity β1-adrenoceptor site in the CRE-mediated SPAP transcription assay (pKD against CGP 12177 = 7.28; pKA partial agonism = 7.06). With increasing BODIPY-TMR-CGP concentrations, more secondary site binding should be observed. However, a distinct secondary site component was not delineated from the total binding fit. This is due to the low affinity of BODIPY-TMR-CGP for the secondary site, which will be linear over the BODIPY-TMR-CGP concentration range used in this saturation binding analysis. Thus, the linear component of the total binding fit is likely to represent a combination of non-specific binding and binding to the secondary site of the β1-adrenoceptor.
When examining the inhibition of specific BODIPY-TMR-CGP binding, the IC50 value determined for CGP 20712A was greater when inhibiting 20 nM (30 × KD at β1-adrenoceptor site 1) than 2 nM (3 × KD at β1-adrenoceptor site 1) BODIPY-TMR-CGP, as would be expected for two ligands competing for the same binding site. However, the slope of the inhibition curve for CGP 20712A was noticeably shallower when inhibiting the binding of 20 nM BODIPY-TMR-CGP. This may be due to the increasing proportion of the second low-affinity β1-adrenoceptor site labelled at higher concentrations of BODIPY-TMR-CGP. 20 nM BODIPY-TMR-CGP (which represents 0.3 × KD at β1-adrenoceptor site 2) should label approximately 17% of site 2 while 2 nM of BODIPY-TMR-CGP (0.03 × KD at β1-adrenoceptor site 2) will only label 2% of site 2. Using an automated higher throughput imaging platform, a greater range of CGP 20712A concentrations was tested and revealed a clear, well-defined two-phase inhibition binding curve against 20 nM BODIPY-TMR-CGP that yielded two distinct affinity values for high- and low-affinity β1-adrenoceptor binding sites or conformations. As a consequence we examined the competition binding curves of CGP 20712A, propranolol and CGP 12177 using BODIPY-TMR-CGP concentrations up to 100 nM. The fraction of BODIPY-TMR-CGP bound to the low-affinity site increased with increasing concentrations of the fluorescent ligand, in line with its affinity value for the secondary site. Thus, the fluorescent-based binding assay used here provided the first direct measure of the binding affinity of CGP 12177 for the secondary β1-adrenoceptor site or conformation. The IC50 values of CGP 20712A, propranolol and CGP 12177 for both site 1 and site 2 increased with increasing BODIPY-TMR-CGP concentrations which is indicative of competitive antagonism at both sites. In addition, it was notable that the secondary binding component of antagonist inhibition curves was specific to the β1-adrenoceptor and was not observed at the β2-adrenoceptor (this study and Baker et al., 2003b).
In conclusion, a fluorescent analogue of CGP 12177 displayed similar pharmacology to its parent compound and could be used not only in functional studies, but also in binding studies using live cells to probe the secondary, low-affinity ‘CGP 12177’ site of the β1-adrenoceptor. This fluorescent probe allows clear visualization of β1-adrenoceptors and is a novel tool for the quantification of the dynamics of ligand interactions in live cells, and thus to further our understanding of the nature of the secondary β1-adrenoceptor site.
Acknowledgments
We thank the Medical Research Council for financial support (G0800006), Jill Baker for kindly providing us with the CHO-CS, CHO-β1 and CHO-β2 cell lines, Tim Self for his microscopy expertise and Leigh Stoddart for helpful discussion of the data.
Glossary
- BODIPY-TMR-CGP (or BOD-CGP)
bordifluoropyrromethane-tetramethylrhodamine-(±)CGP 12177
- CRE
cAMP response element
- CS
CRE-SPAP reporter gene construct
- SPAP
secreted placental alkaline phosphatase
Author contributions
K. G., S. J. B. and S. J. H. participated in the research design. K. G. conducted the experiments. K. G., S. J. B. and S. J. H. performed the data analysis. K. G., S. J. B. and S. J. H. wrote or contributed to the writing of the manuscript.
Conflict of interest
The authors declare no conflicts of interest.
References
- Alexander SP, Benson HE, Faccenda E, Pawson AJ, Sharman JL, Spedding M, et al. The concise guide to pharmacology 2013/14: G protein-coupled receptors. Br J Pharmacol. 2013;170:1459–1581. doi: 10.1111/bph.12445. [DOI] [PMC free article] [PubMed] [Google Scholar]
- Baker JG. Site of action of beta-ligands at the human β1-adrenoceptor. J Pharmacol Exp Ther. 2005;313:1163–1171. doi: 10.1124/jpet.104.082875. [DOI] [PubMed] [Google Scholar]
- Baker JG, Hall IP, Hill SJ. Pharmacological characterization of CGP 12177 at the human β2-adrenoceptor. Br J Pharmacol. 2002;137:400–408. doi: 10.1038/sj.bjp.0704855. [DOI] [PMC free article] [PubMed] [Google Scholar]
- Baker JG, Hall IP, Hill SJ. Agonist actions of ‘beta-blockers’ provide evidence for two agonist activation sites or conformations of the human β1-adrenoceptor. Mol Pharmacol. 2003a;63:1312–1321. doi: 10.1124/mol.63.6.1312. [DOI] [PubMed] [Google Scholar]
- Baker JG, Hall IP, Hill SJ. Pharmacology and direct visualisation of BODIPY-TMR-CGP: a long-acting fluorescent β2-adrenoceptor agonist. Br J Pharmacol. 2003b;139:232–242. doi: 10.1038/sj.bjp.0705287. [DOI] [PMC free article] [PubMed] [Google Scholar]
- Baker JG, Proudman RG, Hawley NC, Fischer PM, Hill SJ. Role of key transmembrane residues in agonist and antagonist actions at the two conformations of the human β1-adrenoceptor. Mol Pharmacol. 2008;74:1246–1260. doi: 10.1124/mol.108.048371. [DOI] [PubMed] [Google Scholar]
- Baker JG, Middleton R, Adams L, May LT, Briddon SJ, Kellam B, et al. Influence of fluorophore and linker composition on the pharmacology of fluorescent adenosine A1 receptor ligands. Br J Pharmacol. 2010;159:772–786. doi: 10.1111/j.1476-5381.2009.00488.x. [DOI] [PMC free article] [PubMed] [Google Scholar]
- Baker JG, Proudman RG, Hill SJ. Identification of key residues in transmembrane 4 responsible for the secondary, low-affinity conformation of the human β1-adrenoceptor. Mol Pharmacol. 2014;85:811–829. doi: 10.1124/mol.114.091587. [DOI] [PMC free article] [PubMed] [Google Scholar]
- Becker A, Hessenius C, Licha K, Ebert B, Sukowski U, Semmler W, et al. Receptor-targeted optical imaging of tumors with near-infrared fluorescent ligands. Nat Biotechnol. 2001;19:327–331. doi: 10.1038/86707. [DOI] [PubMed] [Google Scholar]
- Briddon SJ, Middleton RJ, Cordeaux Y, Flavin FM, Weinstein JA, George MW, et al. Quantitative analysis of the formation and diffusion of A1-adenosine receptor-antagonist complexes in single living cells. Proc Natl Acad Sci U S A. 2004;101:4673–4678. doi: 10.1073/pnas.0400420101. [DOI] [PMC free article] [PubMed] [Google Scholar]
- Daly CJ, Ross RA, Whyte J, Henstridge CM, Irving AJ, McGrath JC. Fluorescent ligand binding reveals heterogeneous distribution of adrenoceptors and ‘cannabinoid-like’ receptors in small arteries. Br J Pharmacol. 2010;159:787–796. doi: 10.1111/j.1476-5381.2009.00608.x. [DOI] [PMC free article] [PubMed] [Google Scholar]
- Dubois EA, Somsen GA, van den Bos JC, Janssen AG, Boer GJ, Batink HD, et al. Pharmacologic characterization in vitro and in vivo of iodine 123-labeled derivatives of the beta-adrenoceptor antagonist CGP12177, designed for the imaging of cardiac beta-receptors. J Nucl Cardiol. 1996;3:242–252. doi: 10.1016/s1071-3581(96)90038-0. [DOI] [PubMed] [Google Scholar]
- Hara T, Hirasawa A, Sun Q, Koshimizu TA, Itsubo C, Sadakane K, et al. Flow cytometry-based binding assay for GPR40 (FFAR1; free fatty acid receptor 1) Mol Pharmacol. 2009;75:85–91. doi: 10.1124/mol.108.052225. [DOI] [PubMed] [Google Scholar]
- Hopkinson HE, Latif ML, Hill SJ. Non-competitive antagonism of β2-agonist-mediated cyclic AMP accumulation by ICI 118551 in BC3H1 cells endogenously expressing constitutively active β2-adrenoceptors. Br J Pharmacol. 2000;131:124–130. doi: 10.1038/sj.bjp.0703535. [DOI] [PMC free article] [PubMed] [Google Scholar]
- Hulme EC, Trevethick MA. Ligand binding assays at equilibrium: validation and interpretation. Br J Pharmacol. 2010;161:1219–1237. doi: 10.1111/j.1476-5381.2009.00604.x. [DOI] [PMC free article] [PubMed] [Google Scholar]
- Joseph SS, Lynham JA, Molenaar P, Grace AA, Colledge WH, Kaumann AJ. Intrinsic sympathomimetic activity of (-)-pindolol mediated through a (-)-propranolol-resistant site of the β1-adrenoceptor in human atrium and recombinant receptors. Naunyn Schmiedebergs Arch Pharmacol. 2003;368:496–503. doi: 10.1007/s00210-003-0835-z. [DOI] [PubMed] [Google Scholar]
- Joseph SS, Lynham JA, Colledge WH, Kaumann AJ. Binding of (-)-[3H]-CGP12177 at two sites in recombinant human β1-adrenoceptors and interaction with beta-blockers. Naunyn Schmiedebergs Arch Pharmacol. 2004;369:525–532. doi: 10.1007/s00210-004-0884-y. [DOI] [PubMed] [Google Scholar]
- Kaumann AJ, Molenaar P. The low-affinity site of the β1-adrenoceptor and its relevance to cardiovascular pharmacology. Pharmacol Ther. 2008;118:303–336. doi: 10.1016/j.pharmthera.2008.03.009. [DOI] [PubMed] [Google Scholar]
- Kaumann AJ, Engelhardt S, Hein L, Molenaar P, Lohse M. Abolition of (-)-CGP 12177-evoked cardiostimulation in double β1/β2-adrenoceptor knockout mice. Obligatory role of β1-adrenoceptors for putative β4-adrenoceptor pharmacology. Naunyn Schmiedebergs Arch Pharmacol. 2001;363:87–93. doi: 10.1007/s002100000336. [DOI] [PubMed] [Google Scholar]
- Kenakin TP, Beek D. The measurement of the relative efficacy of agonists by selective potentiation of tissue responses: studies with isoprenaline and prenalterol in cardiac tissue. J Auton Pharmacol. 1984;4:153–159. doi: 10.1111/j.1474-8673.1984.tb00092.x. [DOI] [PubMed] [Google Scholar]
- Kompa AR, Summers RJ. Desensitization and resensitization of β1- and putative β4-adrenoceptor mediated responses occur in parallel in a rat model of cardiac failure. Br J Pharmacol. 1999;128:1399–1406. doi: 10.1038/sj.bjp.0702920. [DOI] [PMC free article] [PubMed] [Google Scholar]
- Konkar AA, Zhai Y, Granneman JG. β1-adrenergic receptors mediateβ3-adrenergic-independent effects of CGP 12177 in brown adipose tissue. Mol Pharmacol. 2000a;57:252–258. [PubMed] [Google Scholar]
- Konkar AA, Zhu Z, Granneman JG. Aryloxypropanolamine and catecholamine ligand interactions with the β1-adrenergic receptor: evidence for interaction with distinct conformations of β1-adrenergic receptors. J Pharmacol Exp Ther. 2000b;294:923–932. [PubMed] [Google Scholar]
- Leff P, Dougall IG, Harper D. Estimation of partial agonist affinity by interaction with a full agonist: a direct operational model-fitting approach. Br J Pharmacol. 1993;110:239–244. doi: 10.1111/j.1476-5381.1993.tb13799.x. [DOI] [PMC free article] [PubMed] [Google Scholar]
- Lew MJ, Angus JA. Analysis of competitive agonist-antagonist interactions by nonlinear regression. Trends Pharmacol Sci. 1995;16:328–337. doi: 10.1016/s0165-6147(00)89066-5. [DOI] [PubMed] [Google Scholar]
- Lowe MD, Lynham JA, Grace AA, Kaumann AJ. Comparison of the affinity of beta-blockers for two states of the β1-adrenoceptor in ferret ventricular myocardium. Br J Pharmacol. 2002;135:451–461. doi: 10.1038/sj.bjp.0704450. [DOI] [PMC free article] [PubMed] [Google Scholar]
- May LT, Self TJ, Briddon SJ, Hill SJ. The effect of allosteric modulators on the kinetics of agonist-G protein-coupled receptor interactions in single living cells. Mol Pharmacol. 2010;78:511–523. doi: 10.1124/mol.110.064493. [DOI] [PMC free article] [PubMed] [Google Scholar]
- Middleton RJ, Kellam B. Fluorophore-tagged GPCR ligands. Curr Opin Chem Biol. 2005;9:517–525. doi: 10.1016/j.cbpa.2005.08.016. [DOI] [PubMed] [Google Scholar]
- Molenaar P, Chen L, Semmler AB, Parsonage WA, Kaumann AJ. Human heart β-adrenoceptors: β1-adrenoceptor diversification through ‘affinity states’ and polymorphism. Clin Exp Pharmacol Physiol. 2007;34:1020–1028. doi: 10.1111/j.1440-1681.2007.04730.x. [DOI] [PubMed] [Google Scholar]
- Pak MD, Fishman PH. Anomalous behavior of CGP 12177A on β1-adrenergic receptors. J Recept Signal Transduct Res. 1996;16:1–23. doi: 10.3109/10799899609039938. [DOI] [PubMed] [Google Scholar]
- Pawson AJ, Sharman JL, Benson HE, Faccenda E, Alexander SP, Buneman OP, et al. NC-IUPHAR. The IUPHAR/BPS Guide to PHARMACOLOGY: an expert-driven knowledgebase of drug targets and their ligands. Nucl. Acids Res. 2014;42:D1098–1106. doi: 10.1093/nar/gkt1143. (Database Issue): [DOI] [PMC free article] [PubMed] [Google Scholar]
- Rayo J, Amara N, Krief P, Meijler MM. Live cell labeling of native intracellular bacterial receptors using aniline-catalyzed oxime ligation. J Am Chem Soc. 2011;133:7469–7475. doi: 10.1021/ja200455d. [DOI] [PubMed] [Google Scholar]
- Rose RH, Briddon SJ, Hill SJ. A novel fluorescent histamine H1 receptor antagonist demonstrates the advantage of using fluorescence correlation spectroscopy to study the binding of lipophilic ligands. Br J Pharmacol. 2012;165:1789–1800. doi: 10.1111/j.1476-5381.2011.01640.x. [DOI] [PMC free article] [PubMed] [Google Scholar]
- Schneider E, Keller M, Brennauer A, Hoefelschweiger BK, Gross D, Wolfbeis OS, et al. Synthesis and characterization of the first fluorescent nonpeptide NPY Y1 receptor antagonist. Chembiochem. 2007;8:1981–1988. doi: 10.1002/cbic.200700302. [DOI] [PubMed] [Google Scholar]
- Sillence MN, Hooper J, Zhou GH, Liu Q, Munn KJ. Characterization of porcine β1- and β2-adrenergic receptors in heart, skeletal muscle, and adipose tissue, and the identification of an atypical beta-adrenergic binding site. J Anim Sci. 2005;83:2339–2348. doi: 10.2527/2005.83102339x. [DOI] [PubMed] [Google Scholar]
- Staehelin M, Simons P, Jaeggi K, Wigger N. CGP-12177. A hydrophilic beta-adrenergic receptor radioligand reveals high affinity binding of agonists to intact cells. J Biol Chem. 1983;258:3496–3502. [PubMed] [Google Scholar]
- Stephenson RP. A modification of receptor theory. Br J Pharmacol Chemother. 1956;11:379–393. doi: 10.1111/j.1476-5381.1956.tb00006.x. [DOI] [PMC free article] [PubMed] [Google Scholar]
- Stoddart LA, Vernall AJ, Denman JL, Briddon SJ, Kellam B, Hill SJ. Fragment screening at adenosine-A3 receptors in living cells using a fluorescence-based binding assay. Chem Biol. 2012;19:1105–1115. doi: 10.1016/j.chembiol.2012.07.014. [DOI] [PMC free article] [PubMed] [Google Scholar]
- Vernall AJ, Stoddart LA, Briddon SJ, Hill SJ, Kellam B. Highly potent and selective fluorescent antagonists of the human adenosine A3 receptor based on the 1,2,4-triazolo[4,3-a]quinoxalin-1-one scaffold. J Med Chem. 2012;55:1771–1782. doi: 10.1021/jm201722y. [DOI] [PubMed] [Google Scholar]
- Ying LQ, Branchaud BP. Selective labeling and monitoring pH changes of lysosomes in living cells with fluorogenic pH sensors. Bioorg Med Chem Lett. 2011;21:3546–3549. doi: 10.1016/j.bmcl.2011.04.137. [DOI] [PubMed] [Google Scholar]