

Abstract
Microbial metabolism is the engine that drives global biogeochemical cycles, yet many key transformations are carried out by microbial consortia over short spatiotemporal scales that elude detection by traditional analytical approaches. We investigate syntrophic sulfur cycling in the ‘pink berry’ consortia of the Sippewissett Salt Marsh through an integrative study at the microbial scale. The pink berries are macroscopic, photosynthetic microbial aggregates composed primarily of two closely associated species: sulfide-oxidizing purple sulfur bacteria (PB-PSB1) and sulfate-reducing bacteria (PB-SRB1). Using metagenomic sequencing and 34S-enriched sulfate stable isotope probing coupled with nanoSIMS, we demonstrate interspecies transfer of reduced sulfur metabolites from PB-SRB1 to PB-PSB1. The pink berries catalyse net sulfide oxidation and maintain internal sulfide concentrations of 0–500 μm. Sulfide within the berries, captured on silver wires and analysed using secondary ion mass spectrometer, increased in abundance towards the berry interior, while δ34S-sulfide decreased from 6‰ to −31‰ from the exterior to interior of the berry. These values correspond to sulfate–sulfide isotopic fractionations (15–53‰) consistent with either sulfate reduction or a mixture of reductive and oxidative metabolisms. Together this combined metagenomic and high-resolution isotopic analysis demonstrates active sulfur cycling at the microscale within well-structured macroscopic consortia consisting of sulfide-oxidizing anoxygenic phototrophs and sulfate-reducing bacteria.
Introduction
Microbial redox metabolism drives biogeochemical cycles and exerts a profound influence over the flux of energy throughout global ecosystems (Schlesinger, 1997; Falkowski et al., 2008). Recent work in diverse environments, from the deep sea to the human gut, has demonstrated that many of these essential ecosystem processes are mediated not by a single species but by the metabolic interactions of syntrophic microbial consortia (Boetius et al., 2000; Orphan et al., 2002; Overmann and Schubert, 2002; Schink, 2002; Hansen et al., 2011). Syntrophy, a mutualistic interaction based on the exchange of metabolites, allows microbes to exploit metabolic niches that are otherwise inaccessible to a single species (Overmann and van Gemerden, 2000; Schink, 2002; Orphan, 2009).
In closely associated microbial consortia, electron donors and acceptors are transferred over minute distances from cell to cell and drive micrometer-scale biogeochemical cycling. This tightly coupled metabolic activity occurs on spatiotemporal scales that often elude detection by traditional analytical approaches. However, these ‘cryptic’ transformations have major implications for the dynamics of biogeochemical cycling in the macroscale ecosystem (Canfield et al., 2010; Holmkvist et al., 2011; Stewart et al., 2012). Understanding the structure and function of this intricate microbial metabolic network is essential for accurate modelling of biogeochemical cycles (Treseder et al., 2011), prediction of the ecosystem dynamics following perturbations (Allison and Martiny, 2008), and interpretation of net contribution of microbial interactions to bulk measurements of the geochemical environment (Brüchert, 2004; Fike et al., 2009).
Photosynthetic microbial mats and aggregates provide an excellent system to investigate the influence of microbial metabolic interactions over biogeochemical processes at the micrometer scale (Canfield and Des Marais, 1993; Decker et al., 2005; Baumgartner et al., 2006; 2009,; Fike and Grotzinger, 2008; Fike et al., 2008; Petroff et al., 2011). The ‘pink berries’ (Fig. 1) are visually striking photosynthetic aggregates of uncultured microbes found in the Little and Great Sippewissett salt marshes (Falmouth, MA). Reaching up to a centimetre in diameter, these aggregates are found at the sediment–water interface of intertidal pools surrounded by tall-form smooth cordgrass (Spartina alterniflora). The berries have been studied for over three decades as a part of the Microbial Diversity summer course at the Marine Biological Laboratory in Woods Hole, MA (Gibson et al., 1984). Initial characterizations revealed that the primary biomass of the aggregates is composed of anoxygenic phototrophs, purple sulfur bacteria of the family Chromatiaceae (Seitz et al., 1993). Respiratory activity and the dense exopolymer matrix create anoxic conditions immediately below the aggregate surface, though net sulfide production had not been detected (Seitz et al., 1993).
Fig 1.

A. Intertidal pools in Little Sippewissett Salt Marsh form dense stands of pink berry aggregates at the sediment–water interface.
B. Large aggregates can reach nearly a centimeter in size.
C. Pink berries in sediment (0–5 cm) collected from an intertidal pool in Little Sippewissett.
D. Berries can be easily washed free of marsh sediment and manipulated in the lab.
E. Cross-section of a berry reveals pink tubules encased in a clear exopolymer matrix, scale bar is 0.5 mm.
F. Higher magnification view of pink berry tubules, scale bar is 200 μm.
We show that the pink berries are formed by a consortium of purple sulfur bacteria (PSB) and sulfate-reducing bacteria (SRB) that form a specific interspecies association involving direct transfer of sulfur species. The present study of the pink berries utilizes a holistic approach to track sulfur metabolic interactions at the microbial scale, from draft genomes to ecophysiology. Investigation of community diversity and metabolic function using 16S rRNA gene surveys, microscopy and shotgun metagenomics generated hypotheses about the cycling of sulfur and exchange of nutrients within the aggregates. A suite of geomicrobiological tools from microvoltammetry to radio- and stable isotope approaches were employed to interrogate these predictions, illustrating the microbial dynamics and geochemical signatures of this cryptic microscale sulfur cycle.
Results
Phylogenetic diversity in the pink berry consortium: 16S rRNA gene surveys
Analysis of 16S rRNA genes found in pink berry aggregates demonstrate a consistent, simple community where two phylotypes (defined at 97% sequence identity clustering) account for more than 65% of the sequenced clones (total of 273 sequences from three samples, Fig. 2A). PB-PSB1, the most abundant phylotype (35–53% of sequences), is an uncultured species of purple sulfur bacteria (PSB) belonging to the Halochromatium–Thiohalocapsa lineage of the Chromatiaceae (Supporting Information, Fig. S1).
Fig 2.

A. 16S rRNA gene sequences isolated from pink berries which were collected from Penzance Point marsh in 2011 (89 clones), and Little Sippewissett marsh in 2010 (94 clones) and 2007 (90 clones). Two operational taxonomic units (OTUs), a purple sulfur bacteria (PB-PSB1) and sulfate-reducing bacteria (PB-SRB1), account for more than 60% of the sequences observed.
B. Maximum-likelihood phylogeny of the full-length PB-SRB1 OTU and related Desulfobulbaceae. Environmental sequences from uncultured organisms are shown in gray. Bootstrap support (500 replicates) greater than 50% are displayed at the nodes. Branch lengths (and scale bar) correspond to the mean number of nucleotide substitutions per site on the respective branch.
The second most abundant phylotype, PB-SRB1 (15–35% of sequences), is most closely related to Desulfofustis glycolicus, a glycolate-oxidizing sulfate-reducer in the family Desulfobulbaceae (Fig. 2B). Uncultured organisms closely related to PB-SRB1 were often found in association with organisms that participate in sulfide-oxidizing symbioses or in environments dominated by sulfide oxidation (either chemotrophic or phototrophic, Fig. 2B). In addition to the dissimilatory reduction of sulfate, isolates from the genera Desulfofustis and Desulfocapsa have been shown to grow by the disproportionation of elemental sulfur and thiosulfate in the presence of an exogenous sulfide scavenger (Finster et al., 1998; Finster, 2008).
The remaining 16S rRNA gene sequences are predominantly chloroplasts from marine diatoms and diverse phylotypes from the phylum Bacteroidetes. Dominant phylotypes of Bacteroidetes belong largely to clades of environmental sequences from areas of known or suspected active sulfur cycling, with few cultured representatives (Supporting Information, Fig. S2). Analysis of 18S rRNA gene sequences amplified from pink berries revealed several different phylotypes related to pennate diatoms and dinoflagellates (Supporting Information, Fig. S3). For the purposes of this work, we have focused further analysis on the dominant berry phylotypes, PB-PSB1 and PB-SRB1.
In-situ identification and spatial arrangement
Pink berries are composed of irregularly shaped pink tubules in a transparent exopolymer matrix (Fig. 1F). Confocal microscopy of pink berry thin sections revealed that these tubules are dominated by purple sulfur bacteria, identified as autofluorescent cocci (2–4 μm in diameter) containing refractile elemental sulfur inclusions (Fig. 3). These refractile inclusions were labile in solvents (methanol, ethanol) and detergents (SDS, Triton X100), corroborating their identification as intracellular elemental sulfur globules. These cells were also fluorescently labelled by catalysed reporter deposition–fluorescence in situ hybridization (CARD-FISH) using the GAM42a group-specific probe which hybridizes to 16S rRNA from Gammaproteobacteria (Manz et al., 1992; Supporting Information, Fig. S4).
Fig 3.

Epireflective confocal microscopy of sectioned pink berry tissue. Autofluorescence (excitation 543 nm, emission 550–570 nm) of the purple sulfur bacteria is shown in pink, and reflective signal from the refractile elemental sulfur inclusions is shown in white.
PB-SRB1 species was localized via CARD-FISH with a phylotype-specific probe (SRB-PiBe213; this study) designed from the 16S rRNA gene libraries. The SRB-PiBe213 probe hybridized to 3-μm-long rods that were abundant and interspersed throughout the dense islands of PB-PSB1 cells (Fig. 4). A similar hybridization pattern was observed with a group-specific probe targeting the Deltaproteobacteria [DELTA495a-c; Lücker and colleagues (2007)]. Free cells hybridizing to the SRB-PiBe213 probe were rare (< 1% total cells) but could be detected in the overlying water of the intertidal pool (data not shown). Overlying pool water and the patches of pink sand in the nearby tidal channel were also found to contain microscopic aggregates of coccoid PSB cells in association with rod-shaped cells hybridizing to the SRB-PiBe213 probe. The smallest aggregations contained only 5–6 total cells, while larger microaggregates were 20–50 μm in diameter (data not shown).
Fig 4.

Identification of the berry-associated PB-SRB1 species by catalysed reporter deposition–fluorescence in situ hybridization (CARD-FISH) using a phylotype-specific probe. Scanning confocal micrograph shows a cross section of pink berry biomass from near the periphery of the aggregate. This image is an overlay of three fluorescent signals: autofluorescent purple sulfur bacteria (shown in pink, excitation 543 nm, emission 550–570 nm), CARD-FISH signal from the SRB-PiBe213 probe (shown in green, Alexa 488 tyramide) and DAPI nucleic acid stain (shown in blue).
Metagenomic analysis of phylogenetic diversity
The diversity of the microbes in the pink berries was also investigated using unassembled Illumina shotgun metagenomic data, which avoids the bias inherent in polymerase chain reaction (PCR) amplification. The abundance and diversity of different taxa in the metagenomic data were assessed using both ribosomal RNA gene sequences (Meyer et al., 2008) and conserved phylogenetic marker genes (Darling et al., 2014). The diversity observed in the shotgun metagenomic sequences recapitulated that of the PCR-based surveys (Fig. 5). A notable exception was the presence of significant numbers of Alphaproteobacteria in the shotgun data, driven by representatives of the Rhodobacterales (Oceanicola and Oceanicaulis species) and the Rhodospirillales. This discrepancy is likely due to bias introduced by the ‘universal’ 8F bacterial primer which poorly covers the organisms from these orders, according to in-silico specificity searches against the SILVA and Ribosomal Database Project (RDP) databases (data not shown).
Fig 5.
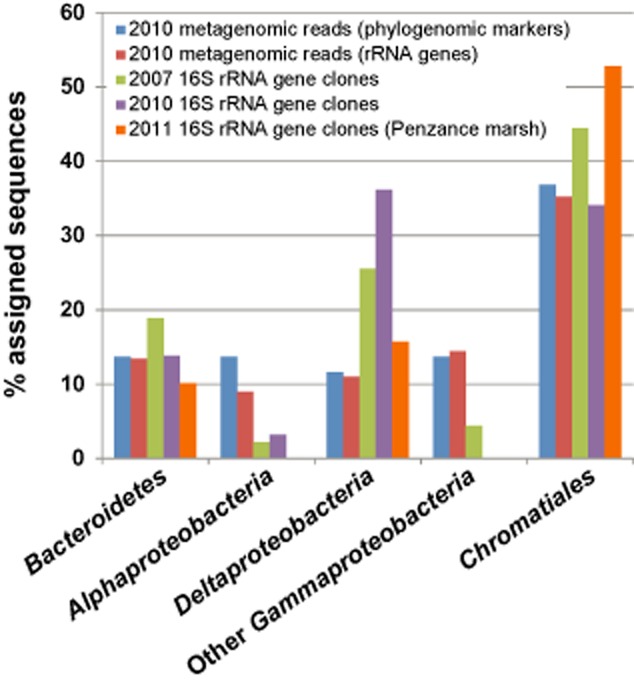
Comparison of bacterial diversity estimates from16S rDNA PCR-amplified clone libraries with unassembled 250 bp paired-end Illumina metagenomic reads. Metagenomic data were analysed using two different methods: maximum-likelihood read placement onto phylogenies conserved protein-coding marker genes (‘phylogenomic markers’) via Phylosift or the read's sequence similarity to ribosomal RNA genes via MG-RAST's M5RNA pipeline. A total of 42 351 metagenomic reads were classified as bacterial ribosomal RNA sequences, and 44 980 reads were assigned to bacterial phylogenetic marker genes.
Further metagenomic analysis of microbial diversity was conducted with co-assembled Roche 454 Titanium and Illumina HiSeq sequence data. Strategies optimized for community genomics (Peng et al., 2012) were used to assemble 7400 scaffolds greater than 1 kilobase (kb; N50 1.6 kb, max contig 64 kb). Clustering of metagenomic scaffolds (see Experimental procedures) revealed two well-defined bins belonging to PB-PSB1 (20–25× coverage) and PB-SRB1 (15–20× coverage). The depth of coverage from these genomic bins corresponded to the abundance ratio of PB-SRB1 to PB-PSB1 observed in the 16S rRNA gene PCR data (1 PB-SRB1 RB per 1.1–1.7 PB-PSB1 cells). These genomic bins represent near complete genomes for both PB-SRB1 and PB-PSB1, as assessed by assembled sequence length, number of coding features and an analysis of 45 single copy phylogenetic marker genes (see Supporting Information, Table S1). In the present study, we have focused further analysis of these genomes on the pathways related to sulfur-based metabolism of these organisms.
Metagenomic evidence for sulfur cycling
To assess the diversity of sulfur-cycling organisms in the berries, we mapped unassembled metagenomic sequence reads to the phylogeny of dissimilatory sulfite reductase genes (dsrAB, see Experimental procedures), which are widely used phylogenetic markers for both oxidative and reductive dissimilatory sulfur metabolisms (Loy et al., 2013). Approximately 33% of reads aligning to the dsrAB sequence could not be taxonomically classified by this approach, likely because they originated from phylogenetically uninformative regions of the dsrAB genes. Most classified reads were placed in either the Chromatiaceae (44%) or Desulfobulbaceae (13%, Supporting Information, Fig. S5). Within these families, the bulk of the reads were assigned to Halochromatium salexigens (Chromatiaceae) and Desulfofustis glycolicus (Desulfobulbaceae), in congruence with the phylogenetic affiliation of the dominant 16S rRNA gene sequences. The remaining classified reads (10% of total aligned reads) were distributed amongst Desulfobacteraceae and Desulfotomaculum.
To further characterize the potential for sulfur redox cycling with the pink berries, we identified pathways for both sulfate reduction and sulfide oxidation from the complete assembled metagenomic dataset. While many of the same genes are used in both reductive and oxidative pathways, the homologues can be clearly distinguished both by divergent sequence and genomic context. All identified sulfur oxidative genes were found on scaffolds binned to PB-PSB1 by the independent sequence composition-based analysis, while sulfur reductive genes were located on scaffolds in the PB-SRB1 bin. Detailed discussion of the oxidative and reductive metabolic pathways in the PB-PSB1 and PB-SRB1 genomes is presented in the Supporting Information S1, Supporting Information S2, Table S2 and Figs S7–12
Soluble sulfur geochemistry: speciation, abundance and isotopic composition
Illuminated microcosms of berries in anoxic filter-sterilized marsh water did not produce sulfide detectable by the Cline assay (Cline, 1969), but instead rapidly consumed 1 mM of added sulfide over the course of two days (Fig. 6A). To investigate the sulfur speciation and redox environment within the aggregates, we conducted cyclic voltammetry using a gold amalgam microelectrode inserted into a large berry (∼ 0.5 cm diameter). Voltammograms measured from the aggregate interior revealed a peak at a potential of 0.85 V (vs. Ag/AgCl), which changed as the electrode penetrated into and back out of the berry. This measurement corresponds to concentrations of sulfide between 13 and 41 μM at different points inside the berry (Fig. 6B; see also Supporting Information, Fig. S6). Independent analyses inside other large berries using a Clark-type sulfide microelectrode (Unisense, Aarhus, Denmark) indicated the presence of 5–20 μM of H2S (135–540 μM of total sulfide). No other electroactive species detectable by cyclic voltammetry (e.g. O2, Fe3+, Fe2+, Mn2+ and As3+, tetrathionate, dissolved/nanoparticulate elemental sulfur) were observed within the berries.
Fig 6.

A. Sulfide concentrations measured by the Cline assay in microcosm incubations with 50 small berries in 50 ml of filter-sterilized marsh water. Incubations were kept on a 14 h light, 10 h dark cycle. Sulfide added to concentration of 1 mM was consumed over the course of the incubation in the presence of the berries (solid line), while the abiotic control showed no change (dashed line). Microcosms without added sulfide had no detectable change from an initial sulfide concentration near 0 mM. Error bars show the standard deviation of three biological replicate incubations.
B. Voltammetric scans from a gold amalgam electrode inside a ∼ 0.5 cm diameter pink berry show a distinct peak relating to dissolved sulfide at ∼− 0.8 V (vs. Ag/AgCl) as the electrode tip penetrates the berry. As little control on the exact position of the electrode in the berry was possible, the data do not quantify a gradient of sulfide but rather outline a change in position and relative values across the aggregate. The solid line with no apparent peak was collected when the electrode was in the surrounding water and not penetrating the aggregate.
To investigate the isotopic composition of sulfide evolved within the berries, large aggregates (∼ 0.5 cm diameter) were threaded onto 24 gauge silver wires and incubated overnight in situ (Fig. 7A). Soluble sulfide was precipitated onto the wire as silver sulfide, leaving a dark tarnish with metallic sheen underneath each aggregate (Fig. 7B). Visible sulfide accumulation began just beneath the surface of the aggregate, with the darkest sulfide deposition towards the centre of the aggregate, confirming reports of sulfide from both microvoltammetry and sulfide microsensors. The abundance and isotopic composition of this precipitated silver sulfide was subsequently analysed using an IMS 7f-GEO magnetic sector secondary ion mass spectrometer (SIMS; CAMECA, Gennevilliers, France), following methods described by Fike and colleagues (2009). A transect along the wire that passed through two berries showed increasing 32S counts (sulfide abundance) and decreasing δ34S towards the centre of the aggregate (Fig. 7C). Where no visible sulfide deposition occurred (i.e. at berry edges or in between the berries), the 32S counts were also very low (Fig. 7C).
Fig 7.

A. Large pink berries were threaded onto 24 gauge silver wire and incubated in situ overnight.
B. Sulfide produced within the berry precipitated onto the wire surface, forming a thin film of AgS visible as the black metallic sheen where the berry had been. SIMS7f ion microprobe analyses were conducted in a transect (25 μm spot sizes) along the wire across the AgS films from two different berries marked by red numbers 1 and 2, shown in panels C and D respectively.
C–D. Co-plotted on the y-axes are the sulfur abundance (32S counts, red) and δ34S (blue) for each point along the transect (x-axis). Vertical error bars represent the standard error (n = 20 cycles) for each measurement. The area between berries 1 and 2 where 32S counts approach 0 corresponds to the region on the wire where no dark sulfide film was visible. SIMS data for Fig. 7 have also been provided in the Supporting Information S2.
The δ34S of deposited sulfide ranged from ∼ 6‰ at the edge of the aggregates to −31‰ in the centre of one the aggregates. Sulfide deposited at the centre of the second berry in the transect showed lower 32S counts and less isotopic depletion (δ34S of −20‰) relative to the first berry (Fig. 7C). The water in the intertidal pond had a sulfate δ34S of +22‰; hence, these ‘intra-berry’ isotopic values indicate isotopic fractionations from ∼ 15‰ to 53‰. In contrast, silver wires that were incubated at the sediment surface nearby but not penetrating the berries (e.g. the loop at far left in Fig. 7A) had δ34S of −16 ± 2‰ (average ± SD, n = 15) uniformly distributed along the wire.
Investigating sulfur cycling with stable isotope probing using 34SO4 and nanoSIMS
To track the activity of the sulfur metabolism and cycling between members of the consortia, freshly collected pink berries were incubated anaerobically with 34S-enriched sulfate and 13C-enriched bicarbonate under both light and dark conditions. Enrichment of 34S in the morphologically distinctive PB-PSB1 cells was evident after 4 days of incubation (Fig. 8A and B). The 34S/32S ratio in these cells was approximately twice that observed in unlabelled control conditions. This signal was found to be labile in methanol (Fig. 8C), a solvent used for the quantitative extraction of elemental sulfur (Ferdelman et al., 1997). Enrichment in 34S was documented in both light and dark incubations (Fig. 8C).
Fig 8.

NanoSIMS analysis of pink berries isotopically labelled with 34S-enriched sulfate and 13C-enriched bicarbonate.
A. Hue–saturation–intensity image mapping the 34S : 32S ratio. The color scale ranges from blue, set to the baseline ratio observed in unlabelled control conditions (0.044), to red, where the ratio is enriched ∼ 2 fold relative to baseline (0.08). Image shown is the composite eight consecutive 30 μm frames at 512 × 512 pixel resolution from a cross section of pink berry biomass from near the periphery of the aggregate.
B. RGB composite image from overlaid primary ion signals showing the cellular arrangement of morphologically distinctive purple sulfur bacterial cells. Primary ion images overlaid are 12C ion (blue), 12C14N (green) and 32S (red). Underlying ion images for each mass available in Supporting Information S2.
C. NanoSIMS-calculated mean incorporation of stable isotopically labelled 13C-bicarbonate (x-axis) and 34S-sulfate (y-axis) incubated in the dark (blue) or 12 h light/dark cycle (red) for 4 days under conditions of active sulfate-respiration (triangles) or SRB-inhibition with sodium molybdate (X), compared with unlabelled control incubations (dots). An isotope-labelled, dark-incubated berry was post-treated with methanol (green triangle). Values plotted are the averages of either 15 × 15 μm (light) or 30 × 30 μm (dark) rasters from different regions in total of seven aggregates (one per condition).
D. 14C bicarbonate incorporation into acid-stable products in five berries incubated for either 1 h or 4 h with 1 mM sulfide. Incubations were conducted on heat-killed aggregates, dark equilibrated aggregates, and aggregates in the light with and without 10 mM molybdate additions.
Accumulation of the 34S isotope label appears to be dependent upon the activity of the sulfate-reducing organisms in the aggregate; addition of sodium molybdate (NaMoO4), an inhibitor of sulfate reduction (Oremland and Capone, 1988), blocked the incorporation of the 34S-enriched label (Fig. 8C). Pronounced 34S-enrichment (1100 ± 200‰ for three replicate incubations) was observed in bulk berry biomass from incubations with 34S-enriched sulfate, as determined by elemental analyser–isotope ratio mass spectrometry (Supporting Information, Fig. S13). Unlabelled controls and molybdate-treated bulk biomass had isotopic composition comparable with that of native berries sampled directly from the marsh (δ34S values ranging from −15‰ to −24‰).
Carbon fixation was light-dependent, as assessed by both nanoSIMS measurements of 13C-incorporation (Fig. 8C) and radiolabelled (14C) bicarbonate incubation assays (Fig. 8D), indicating that PB-PSB1 acts as the primary producer in the aggregates. Molybdate incubations did not affect the light-dependent fixation of carbon in short-term incubations (1–4 h), indicating that PB-PSB1 is not directly inhibited by molybdate (Fig. 8D). In the 4-day incubations, molybdate was found to decrease the aggregates' carbon fixation in the light, suggesting that longer-duration molybdate treatment imposes sulfide limitation, thereby decreasing the primary productivity of PB-PSB1 (Fig. 8C).
Discussion
Tightly coupled microbial consortia modulate biogeochemical cycles over spatiotemporal scales that often elude detection by traditional analytical approaches. The pink berries provide an accessible model system to investigate aggregate-associated ‘cryptic’ sulfur cycling, a process which likely plays a significant role in global biogeochemical transformations. In ocean systems, for example, abundant sulfide-oxidizing lineages (SUP05, SAR324, Agg47) have been reported in regions without detectable sulfide, from oxygen-minimum zones (Walsh et al., 2009; Canfield et al., 2010; Fuchsman et al., 2011) to the oxygenated deep ocean (Swan et al., 2011). Reports of these sulfide-oxidizing lineages in association with sinking organic particles (marine snow) suggests a syntrophic partnership with sulfate-reducing species, though such interspecies transfer of reduced sulfur compounds has not yet been demonstrated. Recent work has also suggested that interspecies sulfur transfer occurs in both consortia from acid mine drainage (Norlund et al., 2009) and in syntrophic consortia responsible for the anaerobic oxidation of methane in the deep sea (Milucka et al., 2012).
The pink berries, consortia made up primarily of a purple sulfur bacterial species (PB-PSB1, Chromatiaceae) and putative sulfate-reducing bacterial species (PB-SRB1, Desulfobulbaceae), provide a tractable system to begin decrypting microbial metabolic partnerships that drive sulfur cycling at the microscale. Based on the combination of phylogenetic information (i.e. the physiology of these species’ cultured relatives) and the conserved spatial structure of the pink berries, we hypothesized that intraberry sulfate reduction by PB-SRB1 provides a local source of sulfide for PB-PSB1 (Fig. 9). Such an association would allow PB-PSB1 to maintain photosynthetic activity even when exogenous sulfide is low or absent, such as during peak light conditions when the chemocline shifts down in the sediment by several centimetres relative to its nighttime levels (Revsbech et al., 1983; Dillon et al., 2009). Electron donors driving sulfate reduction could either be locally supplied from photosynthate or exogenously from the sediment (Fig. 9). Metagenomic sequencing confirmed the genetic potential for this intraberry sulfur cycle; the complete metabolic pathways for sulfate reduction and sulfide oxidation were present in the genomes of PB-SRB1 and PB-PSB1 respectively.
Fig 9.

Model of sulfur cycling in the pink berry consortium. PB-SRB1 (green rods) reduce sulfate to sulfide, oxidizing a variety of electron donors from either exogenous sediment sources or from locally supplied photosynthate produced by PB-PSB1. PB-PSB1 (pink cocci) consume syntrophic sulfide, oxidizing sulfide to sulfate and intracellular stores of elemental sulfur (S0, pale yellow circles). Should PB-PSB1 cells lyse, intracellular sulfur might be reduced and/or disproportionated by PB-SRB1 (grey dashed arrows). Some electron donors for PB-PSB1 (HS-) and PB-SRB1 (H2 or fatty acids) are also likely provided exogenously by compounds effluxed from the sediment (squiggly lines). During the day, the phototrophic PB-PSB1 fixes CO2 into biomass, while at night it may derive maintenance energy by respiring elemental sulfur and intracellular carbohydrate reserves and producing sulfide. Though the PB-SRB1 genome suggests the genetic potential to fix CO2, results from our stable and radiocarbon experiments suggest PB-SRB1 does not contribute significantly to carbon fixation in the berries under the conditions of our incubations.
To test this metabolic model, high-resolution geochemical methods (SIMS, nanoSIMS, microvoltammetry) were used to track the cryptic sulfur cycle from sulfur metabolite pools to cell-specific sulfur assimilation and biomolecules. Sulfur-34 stable isotope labelling allowed us to follow the flow of sulfur within the aggregate, from the reduction of sulfate by PB-SRB1, to interspecies transfer and incorporation into PB-PSB1 cells. After incubation with 34S-enriched sulfate, we observed punctate, solvent-labile sulfur-34 enrichment in PB-PSB1 cells (Fig. 8) that is consistent with accumulation of labelled sulfur in intracellular sulfur globules (Fig. 3).
This sulfur-34 enrichment of PB-PSB1 is unlikely to occur via direct incorporation of the isotopically labelled sulfate. The cellular sulfur of Chromatiaceae species is dominated by periplasmic stores of elemental sulfur (34% of total cell weight), which is exclusively derived from the reduced sulfur pool (Dahl and Prange, 2006). Furthermore, many Chromatiaceae, including the closest cultured relatives to PB-PSB1, are unable to assimilate sulfate (Dahl, 2008; Kumar et al., 2009). Even in those species that can assimilate sulfate, this process is thought to be repressed during anoxic photolithotrophic growth (Neumann et al., 2000; Sander and Dahl, 2008). During photo-organotrophic growth, the model Chromatiaceae species Allochromatium vinosum assimilates sulfate via the cysTWA sulfate ABC transporter and the cysDN assimilatory ATP-sulfurylase. Homologues of these genes were not found in the PB-PSB1 genome, and searches against the complete assembled metagenomic data recovered only distant sequence matches from genes more closely related to those from organisms in the Bacteroidetes, Alphaproteobacteria or Desulfobulbaceae.
As direct 34S-sulfate incorporation by PB-PSB1 cells is unlikely, we propose that PB-SRB1 reduced the 34S-sulfate label to sulfide, which was then taken up and re-oxidized to elemental sulfur by PB-PSB1 (Fig. 9). Consistent with this interpretation, we found that pink berries rapidly oxidized sulfide (Fig. 6A) and that accumulation of the 34S-label in PB-PSB1 was dependent upon the activity of the sulfate-reducing bacteria (Fig. 8C). Sulfur-34 enrichment was not observed when sulfate reduction was inhibited by sodium molybdate. While the application of ‘specific’ inhibitors (such as molybdate) to mixed microbial populations can have unintended consequences on non-target organisms (Oremland and Capone, 1988), we have verified that PB-PSB1 were not directly inhibited by molybdate by demonstrating infrared light-dependent carbon fixation during short (1–4 h) incubations in the presence of exogenous sulfide (Fig. 8D). In longer incubations where exogenous sulfide became limiting (4 days), molybdate treatment diminished the light-dependent fixation of carbon (Fig. 8C). This decrease in primary productivity with SRB inhibition supports the hypothesis that syntrophically supplied sulfide buffers PB-PSB1 from episodic sulfide deprivation.
Having established the importance of sulfate reduction in the pink berry consortia, we sought to describe the pools of reduced sulfur within the pink berries. The close physical association of PB-SRB1 and PB-PSB1 (Fig. 4) suggests that re-oxidation of reduced sulfur species occurs over very short spatiotemporal scales. Sulfide could not be detected by a previous study with Clark-type sulfide microelectrodes (Seitz et al., 1993), and we were only able to occasionally measure micromolar concentrations of sulfide inside very large aggregates using microvoltammetry and Clark-type sulfide microelectrodes (Fig. 6B). The ephemeral nature of the sulfide pool supports our predictions for rapid sulfide consumption in this closely coupled metabolic partnership. Under the conditions we describe, the pink berries were observed to be net sulfide consumers. However, this balance between consumption and production is likely influenced by many factors (e.g. intensity and duration of the photoperiod, temperature, electron donor supply), and further studies are necessary to better elucidate determinants of sulfide flux in the consortia.
The most likely source of this sulfide detected within the berries is the reduction of sulfate by PB-SRB1. However, sulfide could also be produced by several other metabolic processes (Fig. 9), including: (i) reduction of elemental sulfur by PB-SRB1, (ii) disproportionation of elemental sulfur or thiosulfate by PB-SRB1 or (iii) PB-PSB1's dark phase respiration of stored carbohydrates and concomitant reduction of periplasmic elemental sulfur reserves, producing polyhydroxyalkanoates and sulfide (van Gemerden, 1968; Rothermich et al., 2000). To further understand the geochemistry of the pink berry sulfur cycle, we characterized both the spatial distribution and stable isotopic composition of this intraberry sulfide.
Differences in stable isotope ratios between oxidized and reduced pools of sulfur are widely used for modern and paleoecological reconstructions of the sulfur cycle (Canfield and Teske, 1996; Habicht et al., 1998; Canfield, 2001; Hurtgen et al., 2005; Fike et al., 2006; Fike and Grotzinger, 2008; Sim et al., 2011a). Sulfide oxidation mediated by anoxygenic phototrophs (e.g. PB-PSB1) is thought to have minimal impact on the fractionation of sulfur isotopes (Ivanov et al., 1977; Fry et al., 1984; 1985,; Zerkle et al., 2009). However, both sulfate reduction and sulfur disproportionation can produce sulfide that is significantly depleted in heavy stable isotopes relative to the starting pool of sulfate (Canfield, 2001; Sim et al., 2011a). Though use of sulfur isotopic fractionation to make inferences about sulfur cycling is widespread, our understanding of the microbial metabolic information encoded in these measurements is based largely on pure-culture studies of single species (Kaplan and Rittenberg, 1964; Kemp and Thode, 1968; Sim et al., 2011b) or on in situ geochemical measurements where the microbial community was poorly characterized (Habicht and Canfield, 2001; Brüchert, 2004).
The millimetre-sized pink berry consortia provided a well-constrained multispecies ecosystem in which to examine micron scale spatial variation in sulfur isotopic composition (δ34Ssulfide). The use of sulfide capture on silver wire, a technique originally used for radiotracer 35S measurements (Cohen, 1984; Visscher et al., 2000; Dubilier et al., 2001), coupled with SIMS δ34S measurements, elucidated gradients of increasing sulfide concentration and isotopic depletion (lower δ34S values) from the periphery to the centre of large pink berries (Fig. 7). These isotopic geochemical gradients observed in the berries are similar to δ34Ssulfide trends observed from SIMS transects on silver discs through the oxycline of the Guerrero Negro photosynthetic mats (Fike and Grotzinger, 2008; Fike et al., 2008; 2009).
The range of sulfide–sulfate fractionations observed in the berries (15‰ at the periphery to 53‰ at the aggregate centre) is consistent with values reported from pure cultures of sulfate-reducing bacteria which can range from ∼ 0‰ to 66‰ (Sim et al., 2011a). Large isotopic fractionations, such as those observed in the centre of the berries, can be produced by either (i) slow-growing sulfate-reducing bacteria cultured with refractory or growth-limiting concentrations of electron donors (Sim et al., 2011a,b,; Leavitt et al., 2013), or (ii) step-wise fashion from the coupled metabolic activities of reductive and oxidative processes (e.g. phototrophic sulfide oxidation by PB-PSB1 or intermediate oxidation state sulfur disproportionation by PB-SRB1; see Supporting Information S1 for more detailed discussion of mechanisms that could have produced the observed isotopic gradients).
Cultured relatives of PB-SRB1 in the genera Desulfofustis and Desulfocapsa are capable of both sulfate reduction and the disproportionation of elemental sulfur or thiosulfate (Finster, 2008), corroborating our isotopic findings which suggest disproportionation could contribute to the pink berry sulfide pool. Both ecophysiological and genomic data strongly supports the conclusion that PB-SRB1 is capable of sulfate reduction, though genomic evidence for the disproportionation of elemental sulfur or thiosulfate by PB-SRB1 remains less clear. The exact suite of genes required for disproportionation is still unknown, despite the recent sequencing of Desulfocapsa sulfexigens, a sulfur disproportionator incapable of sulfate reduction (Finster et al., 2013). The sulfur disproportionation pathway appears to involve many of the same genes used in sulfate reduction, in addition to a sulfite-oxidoreductase enzyme (Frederiksen and Finster, 2003) for which there are several candidates in genomes of PB-SRB1 and D. sulfexigens (Finster et al., 2013).
In pure culture, growth by elemental sulfur disproportionation has been described only in the presence of a sulfide sink that keeps the exogenous sulfide concentration low, providing thermodynamically favourable conditions for this reaction (Canfield et al., 1998; Finster, 2008). Phototrophic consumption of sulfide by PB-PSB1 provides a biotic sulfide sink in the consortia that could create an attractive niche for elemental sulfur disproportionation, with both abundant sulfur deposits and low concentrations of sulfide. Should sulfide reach higher concentrations, disproportionation of polysulfides could become an important portion of the metabolic strategy of PB-SRB1. Recent studies of anaerobic methane-oxidizing consortia suggest that at least some sulfate-reducing consortia members can disproportionate disulfide that forms in sulfidic environments by the abiotic reaction of elemental sulfur with sulfide (Milucka et al., 2012).
Conclusion
Tracking the interspecies metabolic exchanges that drive microscale biogeochemical processes in natural microbial communities remains a technical challenge. For example, biogeochemical cycling in laminated photosynthetic microbial mats have been studied for decades (e.g. Canfield and Des Marais, 1993; Decker et al., 2005; Baumgartner et al., 2009; Petroff et al., 2011), yet the microbial interactions controlling substrate flux (Burow et al., 2013) and geochemical signatures (Fike and Grotzinger, 2008; Fike et al., 2008) are only just beginning to be understood. Using the pink berries, we demonstrate how an integrative microbiological and microgeochemical approach can be used to decrypt the microbial metabolic partnerships that drive sulfur cycling at the microscale. This methodology, which may ultimately be used to examine more complex ecosystems, offers direct evidence of syntrophic interspecies sulfur transfer.
SIMS analysis of spatial gradients in sulfide abundance and isotopic composition provide a geochemical context for this microscale sulfur cycle. We find it notable that, even within this well-described, limited diversity system, the observed isotopic variation in sulfide can be explained by a number of different plausible scenarios from sulfate reduction alone to a series of coupled reductive and oxidative processes (see also Supporting Information S1). This ambiguity indicates that care should be taken when using such data alone for reconstructions sulfur cycling in more complex sedimentary systems, both ancient and modern. While we have demonstrated the activity of one portion of the sulfur cycle (sulfate reduction and sulfide oxidation), data from our work and other sulfur-based syntrophies (Norlund et al., 2009; Milucka et al., 2012) suggest there may also exist a network of metabolic interactions involving intermediate oxidation state sulfur species (e.g. elemental sulfur, disulfide, thiosulfate) that remain to be explored.
Experimental procedures
Sampling
Unless otherwise stated, berries were sampled in June and July of 2007, 2010 and 2011 from a single intertidal pool formed in the Little Sippewissett Salt Marsh, Falmouth, MA USA (41°34′33.01′N, 70°38′21.24′W). Large berries (∼ 0.5–1 cm in diameter) used for the silver wire sulfide capture and cyclic microvoltammetry were sampled from a second pool in Little Sippewissett (41°34′33.52′N, 70°38′9.71′W) in September 2012. Pink berries were also sampled from Penzance Point Marsh, Woods Hole, MA, USA (41°31′29.95′N, 70°41′7.48′W) and were sampled in the summer of 2011. Berries were collected from the sediment–water interface by sieving (1 mm mesh size) and were washed three times in 0.2 μM of filter-sterilized marsh water.
SSU rRNA clone libraries and sanger capillary sequencing
Five to 10 small aggregates were homogenized with PCR-grade water, and DNA was extracted with the MoBio PowerSoil kit (MoBio, Carlsbad, CA, USA) with a 1 min bead-beating step employed for lysis in place of the 10 min vortexing step outlined in the manufacturer's protocol. Bacterial 16S rRNA genes and eukaryotic 18S rRNA genes were PCR-amplified, cloned, sequenced and clustered to operational taxonomic units (OTUs) at the 97% sequence similarity threshold as described in the Supporting Information S1. GenBank accession numbers for dereplicated, chimera-checked 16S rRNA gene sequence data are KF512914–KF513148, and 18S rRNA gene sequence data are KF516997–KF517018. Phylogenic trees were constructed either with RAxML 7.2.8 (Stamatakis, 2006) with 1000 rapid bootstrap inferences and GTRGAMMA rate approximation, or FastTree using the approximate maximum-likelihood method (Price et al., 2010) with 1000 SH-like support, GTRCAT approximation with 20 rate categories.
Metagenomic sequencing and analysis
Metagenomic sequencing
Total extracted community DNA was sequenced by Roche GS 454 FLX+, Illumina HiSeq and Illumina MiSeq technologies as described in Supporting Information S1. All quality-filtered, unassembled sequence data is available under NCBI BioProject PRJNA214436 in the Sequence Read Archive (SRA) accessions SRX332170, SRX332174 and SRX332175. Data are also available via the MG-RAST server under MG-RAST IDs 4454153.3, 4517592.3 and 4516362.3. Overlapping Illumina MiSeq paired-end reads (250 bp) were assembled, when possible, using the MG-RAST 3.3 pipeline and classified using the M5RNA database to provide a diversity description paralleling that of the 16S rRNA gene clone libraries (Meyer et al., 2008). To assess diversity of the dsrAB sulfur cycling marker genes, a Hidden Markov Model (HMM) and full-length reference tree were built from a curated dsrAB alignment (Loy et al., 2009) using the HMMER 3.0 and FastTree (Price et al., 2010) as implemented by the Phylosift pipeline (Darling et al., 2014). Using the Phylosift pipeline, Illumina sequence reads were scanned using LAST (Kielbasa et al., 2011), aligned to the reference marker with HMMER 3.0, and placed onto the full-length dsrAB phylogenetic tree using pplacer (Matsen et al., 2010).
Metagenomic assembly, genomic binning and genome completeness
Roche 454 Titanium and interleaved paired-end Illumina HiSeq data were co-assembled using the idba_ud algorithm 1.0.9 (Peng et al., 2012). Using protein queries from Desulfobulbus propionicus and Allochromatium vinosum tBLASTn searches identifying key sulfur-cycling functional genes were conducted on nucleotide databases of this complete, assembled metagenomic data. This dataset have been deposited as a whole genome shotgun (WGS) project at DDBJ/EMBL/GenBank under the accession AVFP00000000. The version described in this paper is version AVFP01000000. Data is also available via the MG-RAST database under MG-RAST ID 4532235.3.
Contigs larger than 1 kb were binned into genomes by tetranucleotide frequencies using emergent self-organized maps as described in Supporting Information S1 and previously (Dick et al., 2009; Wrighton et al., 2012). RAST annotations of the PB-PSB1 and PB-SRB1 genomes are available at FigShare (http://dx.doi.org/10.6084/m9.figshare.770903). This draft genome project has been deposited as a WGS project at DDBJ/EMBL/GenBank under the accessions AVFQ00000000 and AVFR00000000. The versions described in this paper are version AVFQ01000000 and AVFR01000000.
Embedding and cryosectioning for microscopy and nanoSIMS
Washed berries were rinsed in phosphate-buffered saline (PBS) for 1 min and then fixed for 1 h at room temperature (4% paraformaldehyde, 0.5% glutaraldehyde in PBS). Post-fixation, berries were washed three times with PBS and incubated for > 1 h in a cryoprotectant solution (7.5% sucrose in PBS). Berries were then transferred to O.C.T. TissueTek (Sakura, CA, USA) and allowed to infiltrate for > 2 h before being flash frozen in liquid nitrogen. Frozen tissue blocks were sectioned at 10 μm thickness at −20°C using a straight-razor cryostat. Samples for CARD-FISH hybridization and epireflective confocal microscopy were placed onto Tissue Path Superfrost Plus Gold Slides (Fisher Scientific, Waltham, MA, USA), while samples for nanoSIMS were placed onto either glass rounds or indium tin oxide (ITO)-coated glass squares (Dekas and Orphan, 2011).
CARD-FISH, imaging elemental sulfur inclusions and confocal microscopy
The probe design tool of the ARB software package (Ludwig et al., 2004) was used to create specific probes for PB-SRB1 phylotype found in the 16S rRNA gene clone library data. Specificity of the probe (SRB-PiBe213) for this sequence cluster was checked against the GenBank database using BLAST, the SILVA database (release 108), the Ribosomal Database Project and NCBI database, and no hits for sequences outside of the target cluster could be detected. The SRB-PiBe213 probe (5′-tcctcctcgcacaaccgc-3′) was ordered as conjugate from Biomers (Ulm, Germany). The general gammaproteobacterial probe GAM42a probe sequence was checked and found to target the PB-PSB1 sequences.
In addition to hybridizations with the custom SRB-PiBe213 probe, GAM42A (Manz et al., 1992) and Delta495a-c with competitors a-c (Lücker et al., 2007), the eubacterial probe EUB338I-III (Amann et al., 1990; Daims et al., 1999) was used as a positive control and a nonsense probe NON338 (Wallner et al., 1993) as a control for nonspecific binding. Hybridizations and tyramide signal amplification were performed as described previously (Ishii et al., 2004) with the modifications described in detail in the Supporting Information S1. Initial imaging was conducted using a Zeiss Axio IMAGER MZ epifluorescence microscope equipped with a color camera (AxioCam HRc, Carl Zeiss, Thornwood, NY, USA). Confocal microscopy of the SRB-PiBE213 CARD-FISH hybridization was conducted using a Leica TCS SP8X confocal microscope (Leica Microsystems, Wetzlar, Germany) with a tunable white light laser.
Elemental sulfur inclusions in the purple sulfur bacterial cells were imaged by epireflective confocal microscopy using an Olympus FV1000 LSM on tissue sections as described previously (Pasteris et al., 2001). Briefly, the 488 nm laser line was used to generate the reflection signal from the refractile elemental sulfur granules with a detection window of 478–498 nm, while the autofluorescence from the purple sulfur bacterial cells was collected using the 543 nm laser line and automatic filter settings for Alexa546 fluorophore.
Sulfide consumption assay
Triplicate microcosms were established with 50 small berries each (∼ 1–3 mm diameter) in 50 ml serum bottles of anoxic filter-sterilized in-situ marsh water under an N2/CO2 headspace (90:10), with or without sulfide added to a final concentration of 1 mM. Triplicate abiotic controls with and without 1 mM sulfide were also established and contained only anoxic filter-sterilized in situ marsh water. Microcosms were incubated on a 14 h light/10 h dark cycle at 28°C, and soluble sulfide was monitored spectrophotometrically (Cline, 1969).
Cyclic microvoltammetry
Voltammetic analysis of berries collected in a 50 ml Falcon tube were performed utilizing glass Au-Hg amalgam electrodes (with tips drawn to ∼ 500 μm diameter) lowered vertically in 0.1–1 mm increments using a manual micromanipulator. The electrodes were constructed and calibrated according to the methods outlined by Brendel and Luther (1995). Electrodes were calibrated in the lab for O2, HS- and Mn2+ using water collected from the sample site; each electrode's response was checked immediately before use by measuring the signal for 200 μM Mn2+ and calibrated using the pilot ion method after Meites (1965) and Slowey and Marvin-DiPasquale (2012). The tip of the electrode was positioned to penetrate a number of berries using this technique. The berries typically compressed slightly before the electrode tip was able to penetrate, followed by movement of the berry itself with the electrode as it penetrated. As such, exact spatial reference was not possible, although it was clear that a number of scans did occur inside individual berries. A sequence of 10 cyclic voltammograms was obtained at each position using a DLK-60 potentiostat and software (Analytical Instrument Systems, Flemington, NJ, USA). Instrumental variability between measurements was typically < 1%. Sulfide was also independently measured in other aggregates using a Unisense sulfide microsensor (Unisense, Aarhus, Denmark) according to manufacturer's instructions, with total sulfide calculated assuming an interior pH of 8 (Seitz et al., 1993).
Sulfide capture and SIMS 7f-Geo ion microprobe analysis of δ34S
Large berries (0.5–1 cm diameter) were collected, rinsed free of sediment, threaded onto 24 gauge silver wire (99.95%; Surepure Chemetals, Florham Park, NJ, USA) and incubated in situ from 4 p.m. until 11 a.m. the next day. Berries were then removed, wires were rinsed with de-ionized water and stored under a nitrogen atmosphere prior to analysis. The wire was sectioned, mounted onto a glass round using double-sided carbon tape and sputter-coated with 10 nm of gold. Analysis of silver sulfide precipitated on metallic silver was conducted using the Cameca IMS 7f-GEO magnetic sector SIMS at the Caltech Center for Microanalysis using methods described previously (e.g. Fike and Grotzinger, 2008; Fike et al., 2008; Fike et al., 2009) and in detail in the Supporting Information S1.
Stable isotope amendment experiments
Anoxic, filter-sterilized in-situ marsh water was amended with 13C-enriched bicarbonate (98 atom % 13C, Isotec Sigma-Aldrich, St. Louis, MO, USA) at a 10 mM final concentration, and 34S-enriched sulfate (90 atom % 34S, Isotec Sigma-Aldrich) at a 28 mM final concentration, on top of the concentrations naturally present in the water (sulfate initially measured at 26.5 mM). Berries were washed free of sediment and placed into serum bottle incubations with sulfide added to 0.5 mM and an N2/CO2 (90:10) headspace. Incubations were maintained for 4 days at 28°C either in the dark, or the light (14 h light/ 10 h dark cycle). Similar light/dark incubations were also established in the presence of 10 mM of sodium molybdate to inhibit the activity of sulfate-reducing bacteria in the aggregates. Isotopically unlabelled light and dark control incubations were incubated in parallel and consisted of equivalent additions of standard isotopic composition bicarbonate and sulfate on top of that naturally present in the marsh water.
After 4 days, berries were removed from the incubations, fixed, embedded and sectioned for nanoSIMS analysis. Berries from the light condition were sectioned onto glass rounds and subsequently sputter-coated with 10 nm of gold. Continuous dark incubations were sectioned onto conductive ITO squares (Dekas and Orphan, 2011). Several berries from three dark biological replicates (+/− molybdate, and unlabelled controls) were fixed and flash frozen without embedding for analysis by bulk elemental analyser isotope ratio mass spectrometry (EA-IRMS).
NanoSIMS sample preparation and imaging
Samples for nanoSIMS analysis were optically mapped using phase contrast and epifluorescence microscopy to identify islands of PB-PSB1 target cells. Neither FISH nor CARD-FISH were conducted on these samples to preserve the intracellular elemental sulfur inclusions, which were found to wash out during permeabilization steps required for these protocols. Target PB-PSB1 cells were found to have abundant intracellular sulfur inclusions prior to nanoSIMS analysis.
Measurements were conducted on the Cameca NanoSIMS 50 L instrument at the Caltech Center for Microanalysis in two separate 3-day sessions in 2010 and 2011. Samples were collected using a primary Cs+ ion beam at 1.2 pA corresponding to a nominal spot size of ∼ 50 nm. The beam was rastered at either 256 × 256 or 512 × 512 pixel resolution over square regions from 15 to 30 μm in size. All samples were presputtered for 10–15 min to locally remove any exterior layers or gold coating. Seven secondary ions were simultaneously collected, 12C-, 13C-, 12C14N-, 12C15N-,31P-, 32S-, 34S-. NanoSIMS images were processed using ‘Open MIMS’, a plug-in to ImageJ available online at http://www.nrims.hms.harvard.edu/NRIMS_ImageJ.php (Gormanns et al., 2012). Each series of frames was corrected for drift and detector dead time but represent raw values that were not corrected for instrumental mass fractionation. Values shown are the sum of several frames from each analysis region.
Bulk analysis of sulfur isotopes by EA-IRMS
Sulfate from in-situ marsh water was precipitated with barium chloride (Kolmert et al., 2000), dried and prepared for EA-IRMS. Pink berries preserved from triplicate incubations (dark, +/− isotope labels, +/− 10 mM sodium molybdate) were dried at 55°C for 48 h, and crimped in sealed aluminum foil. Samples were analysed for their sulfur isotopic composition using an ECS 4010 elemental analyser (Costech Analytical Technologies, Valencia, CA, USA) coupled to a Thermo Finnigan Delta V Plus mass spectrometer (Thermo Scientific, Waltham, MA, USA). Sulfur isotope composition was calibrated against NBS-127, IAEA-S1, and IAEA-S3. Sulfur isotope values are reported in per mil (‰) relative to the V-CDT (Vienna Canyon Diablo Troilite) scale. Based on replicate analyses across several days, reproducibility of these sulfur isotope measurements is < 0.3‰ (1σ).
Radiocarbon assay of carbon fixation
Incubations of five sediment-free 2 mm diameter berries were placed in small screw-cap tubes with 1 ml of filter-sterilized in-situ marsh water and an N2/CO2 headspace (90:10). Duplicate incubations were pre-equilibrated for 3 h either in the ambient light, dark or with 10 mM of final concentration sodium molybdate. Duplicate vials were also prepared with heat-killed berries (10 min boil). Just before the start of the experiment, each incubation was amended with neutralized sulfide to a final concentration of 1 mM, followed by the addition of 10 μL of 14C bicarbonate in 0.01 M of sodium hydroxide with a nominal specific activity of 250 μCi/ml. Incubations were sampled after either 1 or 4 h at room temperature illuminated by an array of 196 infrared light emitting diodes (λ = 850 nm) to ensure that any observed carbon fixation came from the purple sulfur bacteria and not from oxygenic phototrophs (diatoms, cyanobacteria) in the berries.
Incubations were terminated by the addition of 1 ml of saturated urea solution and heating to 85°C for 30 min to inactivate and disaggregate the berries. Unincorporated radioactive bicarbonate was removed by heating 50 μL of this berry homogenate with 400 μL of glacial acetic acid in glass scintillation vials at 65°C for 20 min. Vials were gently tapped throughout the heating to ensure removal of any condensate near the rim. Ten millilitres of Universol scintillation cocktail was added to the sample and the acid-stable products in the biomass were quantified as scintillation per second with an LS 650 multipurpose scintillation counter (Beckman Coulter, Fullerton, CA, USA).
Acknowledgments
We would like to acknowledge the excellent work of many students, teaching fellows, and instructors who contributed to this research over the many years of the Microbial Diversity course at the Marine Biological Laboratory; in particular we thank Cristina Moraru and Rebekah J. Ward for assistance in developing embedding and CARD-FISH protocols, Jarrod J. Scott for providing 16S rRNA gene sequence data from 2007 and Alexander P. Petroff for helpful discussions. Many thanks to Douglas C. Nelson and Susan E. Alford for their work with the radiocarbon fixation assay, Abigail Green-Saxena and Yunbin Guan for assistance with nanoSIMS data acquisition, Fotios C. Kafantaris for microvoltammetry work, Jennifer Houghton Julie Huber for use of her lab and Claire Beaudoin for sulfide microsensors measurements, and to Nanelle R. Barash and Annette R. Rowe for their critical reading of the manuscript. This work was supported by NSF grants DEB-1310168, EAR-1124389, and EAR-1123391, a grant from the Gordon and Betty Moore Foundation (#3306), and awards to Elizabeth G. Wilbanks from the NSF Graduate Research Fellowship, UC Davis Dissertation Year Fellowship, P.E.O. Scholar Award, and the NAI/APS Lewis and Clark Fund in Astrobiology. This research was performed by participants in the MBL Microbial Diversity course and was supported in part by the Howard Hughes Medical Foundation, the Gordon and Betty Moore Foundation (#2493), the NSF (DEB-0917499), the US DOE (DE-FG02-10ER13361), and the NASA Astrobiology Institute.
Supporting Information
Additional Supporting Information may be found in the online version of this article at the publisher's web-site
Supplemental results and discussion.
S2. Supplemental data. SIMS 7f-GEO raw and processed data used to construct for main text Figure 7C,D.
S3. Supplemental data. NanoSIMS-50L raw and processed data used to construct Figure 8A,B in main text.
Maximum-likelihood phylogeny (rooted) constructed from 16S rRNA gene sequences of pink berry purple sulfur bacteria PB-PSB1 and cultured Chromatiales relatives. Phylogeny was constructed with FastTree using the approximate maximum-likelihood method (Price et al., 2010) and GTRCAT approximation with 20 rate categories. Values at the nodes are SH-like local supports (1000) computed by FastTree and used as condiference values of tree branches. Scale bar represents the number of estimated changes per position for a unit of branch length.
Fig. S2. Maximum-likelihood phylogeny (mid-point rooted) constructed from 16S rRNA gene sequences of pink berry Bacteroidetes phylotypes OTUs (pink), cultured isolates (blue) and uncultured environmental amplicon. Phylogeny was constructed with FastTree using the approximate maximum-likelihood method (Price et al., 2010) and GTRCAT approximation with 20 rate categories. Values at the nodes are SH-like local supports (1000) computed by FastTree and used as condiference values of tree branches. Scale bar represents the number of estimated changes per position for a unit of branch length. Marked with red stars are the dominant pink berry phylotypes. Note the relative scarcity of cultured isolates and abundance of related sequences from diverse sulfur-cycling habitats.
Fig. S3. Maximum-likelihood phylogeny (mid-point rooted) constructed from 18S rRNA gene sequences of pink berry eukaryotes OTUs and cultured relatives. Phylogeny was constructed with FastTree using the approximate maximum-likelihood method (Price et al., 2010) and GTRCAT approximation with 20 rate categories. Values at the nodes are SH-like local supports (1000) computed by FastTree and used as condiference values of tree branches. Scale bar represents the number of estimated changes per position for a unit of branch length.
Fig. S4. Epifluorescence microscopy of CARD-FISH hybridization of sectioned pink berries with a nonsense probe (NON338, panel A), and a Gammaproteobacteria probe (GAM42a, panel B). The left side of each panel shows the Alexa 488 probe signal and background autofluorescence; the right side of the panel shows the DAPI stain.
Fig. S5. Maximum-likelihood phylogeny (FastTree) constructed from an alignment of full-length dsrAB gene sequences (Loy et al., 2009). Illumina sequence reads were processed with the Phylosift pipeline which placed them onto this fixed, full-length reference tree using pplacer (Matsen et al., 2010). Branches with reads placed are in red, and with a branch line width proportional to the number of assigned sequences.
Fig. S6. Chromatiales soxYZ gene. Generated by RAST synteny viewer using 1e-20 BLASTP similarity cut-off to define and colour gene sets (each set has unique number and colour). Ordered according to % aa similarity to scaffold_341 soxY query. Note the conserved Chromatiales hypothetical gene cluster upstream from soxYZ (7,12,10,3).
Fig. S7. Chromatiales dsrABEFHCMKLJOPNRS gene cluster is represented in three distinct metagenomic contigs from PB-PSB1. Generated by RAST synteny viewer using 1e-20 BLASTP similarity cut-off to define and colour gene sets (each set has unique number and colour). Ordered according to % aa similarity to scaffold_285 dsrA query. Genes shown in parenthesis at top (dsrH and dsrJ) were not annotated on metagenomic contigs by RAST but are identifiable as gene fragments using independent BLASTP queries. Also, note the conserved Chromatiales hypothetical gene cluster upstream from dsrAB (10,17,16/18).
Fig. S8. Genomic context of aprM–aprBA gene cluster in PB-PSB1. Generated by RAST synteny viewer using 1e-20 BLASTP similarity cut-off to define and colour gene sets (each set has unique number and colour). Ordered according to % aa similarity to the scaffold_71 aprB query.
Fig. S9. Genomic context of aprAB–qmoABC gene cluster in PB-SRB1.Generated by RAST synteny viewer using 1e-20 BLASTP similarity cut-off to define and colour gene sets (each set has unique number and colour). Ordered according to % aa similarity to the scaffold_149 aprA query.
Fig. S10. Genomic context of dsrAB PB-SRB1. Generated by RAST synteny viewer using 1e-20 BLASTP similarity cut-off to define gene sets (each set has unique number and colour). Table below shows annotations for Desulfobulbaceae-conserved genes in this genomic region. Ordered according to % aa similarity to scaffold_206 dsrA query.
Fig. S11. Genomic context of dsrC PB-SRB1. Generated by RAST synteny viewer using 1e-20 BLASTP similarity cut-off to define gene sets (each set has unique number and colour). Table below shows annotations for conserved genes in PB-SRB1 in this genomic region. Ordered according to % aa similarity to the scaffold_372 dsrC query.
Fig. S12. Genomic context of dsrMKJOP gene cluster in PB-SRB1. Generated by RAST synteny viewer using 1e-20 BLASTP similarity cut-off to define and colour gene sets (each set has unique number and colour). Ordered according to % aa similarity to the scaffold_12 dsrM query.
Fig. S13. Elemental analyser–isotope ratio mass spectrometry of pooled berry biomass from dark incubations with either added 34 S-enriched sulfate (‘labelled’) or standard sulfate (‘unlabelled’). Incubations were conducted both with and without 10 mM molybdate. Also shown are three different measurements of pooled berry biomass taken directly from the marsh (‘native’). Values shown are per mil V-CDT, the mean of biological replicates; error bars show standard deviation between these replicates.
Quantification of the single copy phylogenetic marker genes for estimating genome completion and number of genomes per bin of the PB-SRB1 and PB-PSB1 associated bins. Note that translation elongation factor EF-2 is duplicated in the closely related Desulfobulbaceae genomes.
Table S2. Genes of interest in the PB-PSB1 and PB-SBR1 genomes. Gene locations are based on the RAST annotations of the genomes (complete dataset available at FigShare).
References
- Allison S. Martiny J. Resistance, resilience, and redundancy in microbial communities. Proc Natl Acad Sci USA. 2008;105:11512–11519. doi: 10.1073/pnas.0801925105. [DOI] [PMC free article] [PubMed] [Google Scholar]
- Amann RI, Binder BJ, Olson RJ, Chisholm SW, Devereux R. Stahl DA. Combination of 16S rRNA-targeted oligonucleotide probes with flow cytometry for analyzing mixed microbial populations. Appl Environ Microbiol. 1990;56:1919–1925. doi: 10.1128/aem.56.6.1919-1925.1990. [DOI] [PMC free article] [PubMed] [Google Scholar]
- Baumgartner LK, Reid RP, Dupraz C, Decho AW, Buckley DH, Spear JR, et al. Sulfate reducing bacteria in microbial mats: changing paradigms, new discoveries. Sediment Geol. 2006;185:131–145. [Google Scholar]
- Baumgartner LK, Dupraz C, Buckley DH, Spear JR, Pace NR. Visscher PT. Microbial species richness and metabolic activities in hypersaline microbial mats: insight into biosignature formation through lithification. Astrobiology. 2009;9:861–874. doi: 10.1089/ast.2008.0329. [DOI] [PubMed] [Google Scholar]
- Boetius A, Ravenschlag K, Schubert CJ, Rickert D, Widdel F, Gieseke A, et al. A marine microbial consortium apparently mediating anaerobic oxidation of methane. Nature. 2000;407:623–626. doi: 10.1038/35036572. [DOI] [PubMed] [Google Scholar]
- Brendel PJ. Luther GW., III Development of a gold amalgam voltammetric microelectrode for the determination of dissolved Fe, Mn, O2, and S(-II) in porewaters of marine and freshwater sediments. Environ Sci Technol. 1995;29:751–761. doi: 10.1021/es00003a024. [DOI] [PubMed] [Google Scholar]
- Brüchert V. Physiological and ecological aspects of sulfur isotope fractionation during bacterial sulfate reduction. Geol Soc Am Spec Pap. 2004;379:1–16. [Google Scholar]
- Burow LC, Woebken D, Marshall IP, Lindquist EA, Bebout BM, Prufert-Bebout L, et al. Anoxic carbon flux in photosynthetic microbial mats as revealed by metatranscriptomics. ISME J. 2013;7:817–829. doi: 10.1038/ismej.2012.150. [DOI] [PMC free article] [PubMed] [Google Scholar]
- Canfield D. Des Marais D. Biogeochemical cycles of carbon, sulfur, and free oxygen in a microbial mat. Geochim Cosmochim Acta. 1993;57:3971–3984. doi: 10.1016/0016-7037(93)90347-y. [DOI] [PubMed] [Google Scholar]
- Canfield D. Teske A. Late Proterozoic rise in atmospheric oxygen concentration inferred from phylogenetic and sulphur-isotope studies. Nature. 1996;382:127–132. doi: 10.1038/382127a0. [DOI] [PubMed] [Google Scholar]
- Canfield DE. Biogeochemistry of Sulfur Isotopes. In: Cole DR, editor; Valley JW, editor. Stable Isotope Geochemistry. Washington, DC: Mineralogical Society of America; 2001. pp. 607–636. [Google Scholar]
- Canfield DE, Thamdrup B. Fleischer S. Isotope fractionation and sulfur metabolism by pure and enrichment cultures of elemental sulfur-disproportionating bacteria. Limnol Oceanogr. 1998;43:253–264. [Google Scholar]
- Canfield DE, Stewart FJ, Thamdrup B, De Brabandere L, Dalsgaard T, Delong EF, et al. A cryptic sulfur cycle in oxygen-minimum-zone waters off the Chilean coast. Science. 2010;330:1375–1378. doi: 10.1126/science.1196889. [DOI] [PubMed] [Google Scholar]
- Cline JD. Spectrophotometric determination of hydrogen sulfide in natural waters. Limnol Oceanogr. 1969;14:454–458. [Google Scholar]
- Cohen Y. Comparative N and S cycles: oxygenic photosynthesis, anoxygenic photosynthesis, and sulfate-reduction in cyanobacterial mats. In: Reddy CA, editor; Klug MJ, editor. Recent Advances in Microbial Ecology. Washington, DC: American Society for Microbiology Press; 1984. pp. 435–441. [Google Scholar]
- Dahl C. Inorganic sulfur compounds as electron donors in purple sulfur bacteria. In: Hell R, editor. Sulfur Metabolism in Phototrophic Organisms. Vol. 27. 2008. pp. 289–317. [Google Scholar]
- Dahl C. Prange A. Bacterial sulfur globules: occurrence, structure and metabolism. In: Shively JM, editor; Inclusions in Prokaryotes. Berlin, Germany: Springer; 2006. pp. 21–51. [Google Scholar]
- Daims H, Brühl A, Amann R, Schleifer K-H. Wagner M. The domain-specific Probe EUB338 is insufficient for the detection of all bacteria: development and evaluation of a more comprehensive probe set. Syst Appl Microbiol. 1999;22:434–444. doi: 10.1016/S0723-2020(99)80053-8. [DOI] [PubMed] [Google Scholar]
- Darling AE, Jospin G, Lowe E, Matsen FA, IV, Bik H. Eisen JA. Phylosift: metagenome phylogeny for the masses. PeerJ. 2014;2:e243. doi: 10.7717/peerj.243. http://dx.doi.org/10.7717/peerj.243. [DOI] [PMC free article] [PubMed] [Google Scholar]
- Decker KLM, Potter CS, Bebout BM, Des Marais DJ, Carpenter S, Discipulo M, et al. Mathematical simulation of the diel O, S, and C biogeochemistry of a hypersaline microbial mat. FEMS Microbiol Ecol. 2005;52:377–395. doi: 10.1016/j.femsec.2004.12.005. [DOI] [PubMed] [Google Scholar]
- Dekas AE. Orphan VJ. Identification of diazotrophic microorganisms in marine sediment via fluorescence in situ hybridization coupled to nanoscale secondary ion mass spectrometry (FISH-NanoSIMS) Methods Enzymol. 2011;486:281–305. doi: 10.1016/B978-0-12-381294-0.00012-2. [DOI] [PubMed] [Google Scholar]
- Dick GJ, Andersson AF, Baker BJ, Simmons SL, Thomas BC, Yelton AP. Banfield JF. Community-wide analysis of microbial genome sequence signatures. Genome Biol. 2009;10:R85–R85. doi: 10.1186/gb-2009-10-8-r85. [DOI] [PMC free article] [PubMed] [Google Scholar]
- Dillon JG, Miller S, Bebout BM, Hullar M, Pinel N. Stahl DA. Spatial and temporal variability in a stratified hypersaline microbial mat community. FEMS Microbiol Ecol. 2009;68:46–58. doi: 10.1111/j.1574-6941.2009.00647.x. [DOI] [PubMed] [Google Scholar]
- Dubilier N, Mülders C, Ferdelman T, de Beer D, Pernthaler A, Klein M, et al. Endosymbiotic sulphate-reducing and sulphide-oxidizing bacteria in an oligochaete worm. Nature. 2001;411:298–302. doi: 10.1038/35077067. [DOI] [PubMed] [Google Scholar]
- Falkowski PG, Fenchel T. Delong EF. The microbial engines that drive Earth's biogeochemical cycles. Science. 2008;320:1034–1039. doi: 10.1126/science.1153213. [DOI] [PubMed] [Google Scholar]
- Ferdelman TG, Lee C, Pantoja S, Harder J, Bebout BM. Fossing H. Sulfate reduction and methanogenesis in a Thioploca-dominated sediment off the coast of Chile. Geochim Cosmochim Acta. 1997;61:3065–3079. [Google Scholar]
- Fike DA. Grotzinger JP. A paired sulfate–pyrite δ34S approach to understanding the evolution of the Ediacaran–Cambrian sulfur cycle. Geochim Cosmochim Acta. 2008;72:2636–2648. [Google Scholar]
- Fike DA, Grotzinger JP, Pratt LM. Summons RE. Oxidation of the Ediacaran ocean. Nature. 2006;444:744–747. doi: 10.1038/nature05345. [DOI] [PubMed] [Google Scholar]
- Fike DA, Gammon CL, Ziebis W. Orphan VJ. Micron-scale mapping of sulfur cycling across the oxycline of a cyanobacterial mat: a paired nanoSIMS and CARD-FISH approach. The ISME journal. 2008;2:749–759. doi: 10.1038/ismej.2008.39. [DOI] [PubMed] [Google Scholar]
- Fike DA, Finke N, Zha J, Blake G, Hoehler TM. Orphan VJ. The effect of sulfate concentration on (sub)millimeter-scale sulfide δ34S in hypersaline cyanobacterial mats over the diurnal cycle. Geochim Cosmochim Acta. 2009;73:6187–6204. [Google Scholar]
- Finster K. Microbiological disproportionation of inorganic sulfur compounds. J Sulfur Chem. 2008;29:281–292. [Google Scholar]
- Finster K, Liesack W. Thamdrup B. Elemental sulfur and thiosulfate disproportionation by Desulfocapsa sulfoexigens sp. nov., a new anaerobic bacterium isolated from marine surface sediment. Appl Environ Microbiol. 1998;64:119–125. doi: 10.1128/aem.64.1.119-125.1998. [DOI] [PMC free article] [PubMed] [Google Scholar]
- Finster KW, Kjeldsen KU, Kube M, Reinhardt R, Mussmann M, Amann R. Schreiber L. Complete genome sequence of Desulfocapsa sulfexigens, a marine deltaproteobacterium specialized in disproportionating inorganic sulfur compounds. Stand Genomic Sci. 2013;8:58–68. doi: 10.4056/sigs.3777412. [DOI] [PMC free article] [PubMed] [Google Scholar]
- Frederiksen T-M. Finster K. Sulfite-oxido-reductase is involved in the oxidation of sulfite in Desulfocapsa sulfoexigens during disproportionation of thiosulfate and elemental sulfur. Biodegradation. 2003;14:189–198. doi: 10.1023/a:1024255830925. [DOI] [PubMed] [Google Scholar]
- Fry B, Gest H. Hayes JM. Isotope effects associated with the anaerobic oxidation of sulfide by the purple photosynthetic bacterium, Chromatium vinosum. FEMS Microbiol Lett. 1984;22:283–287. doi: 10.1016/0378-1097(85)90318-0. [DOI] [PubMed] [Google Scholar]
- Fry B, Gest H. Hayes JM. Isotope effects associated with the anaerobic oxidation of sulfite and thiosulfate by the photosynthetic bacterium, Chromatium vinosum. FEMS Microbiol Lett. 1985;27:227–232. doi: 10.1016/0378-1097(85)90318-0. [DOI] [PubMed] [Google Scholar]
- Fuchsman CA, Kirkpatrick JB, Brazelton WJ, Murray JW. Staley JT. Metabolic strategies of free-living and aggregate-associated bacterial communities inferred from biologic and chemical profiles in the Black Sea suboxic zone. FEMS Microbiol Ecol. 2011;78:586–603. doi: 10.1111/j.1574-6941.2011.01189.x. [DOI] [PubMed] [Google Scholar]
- van Gemerden H. On the ATP generation by Chromatium in darkness. Archiv für Mikrobiologie. 1968;64:118–124. doi: 10.1007/BF00406970. [DOI] [PubMed] [Google Scholar]
- Gibson J, Leadbetter E. Jannasch H. Great Sippewissett Salt Marsh: a summary of projects carried out by students in the microbial ecology coure of the Marine Biological Laboratory, Woods Hole, during summers 1972–1981. In: Halvorson HO, editor; Cohen Y, Castenholz RW, editors. Microbial Mats: Stromatolites. New York: Alan R. Liss; 1984. pp. 95–100. [Google Scholar]
- Gormanns P, Reckow S, Poczatek JC, Turck CW. Lechene C. Segmentation of multi-isotope imaging mass spectrometry data for semi-automatic detection of regions of interest. PLoS ONE. 2012;7:e30576. doi: 10.1371/journal.pone.0030576. [DOI] [PMC free article] [PubMed] [Google Scholar]
- Habicht K. Canfield D. Isotope fractionation by sulfate-reducing natural populations and the isotopic composition of sulfide in marine sediments. Geology. 2001;29:555–558. [Google Scholar]
- Habicht K, Canfield D. Rethmeier J. Sulfur isotope fractionation during bacterial reduction and disproportionation of thiosulfate and sulfite. Geochim Cosmochim Acta. 1998;62:2585–2595. [Google Scholar]
- Hansen EE, Lozupone CA, Rey FE, Wu M, Guruge JL, Narra A, et al. Pan-genome of the dominant human gut-associated archaeon, Methanobrevibacter smithii, studied in twins. Proc Natl Acad Sci U S A. 2011;108:4599–4606. doi: 10.1073/pnas.1000071108. [DOI] [PMC free article] [PubMed] [Google Scholar]
- Holmkvist L, Ferdelman TG. Jørgensen BB. A cryptic sulfur cycle driven by iron in the methane zone of marine sediment (Aarhus Bay, Denmark) Geochim Cosmochim Acta. 2011;75:3581–3599. [Google Scholar]
- Hurtgen MT, Arthur MA. Halverson GP. Neoproterozoic sulfur isotopes, the evolution of microbial sulfur species, and the burial efficiency of sulfide as sedimentary pyrite. Geology. 2005;33:41. [Google Scholar]
- Ishii K, Mussmann M, MacGregor BJ. Amann R. An improved fluorescence in situ hybridization protocol for the identification of bacteria and archaea in marine sediments. FEMS Microbiol Ecol. 2004;50:203–213. doi: 10.1016/j.femsec.2004.06.015. [DOI] [PubMed] [Google Scholar]
- Ivanov MV, Gogotova GI, Matrosov AG. Zyakun AM. Fractionation of sulfur isotopes by phototrophic sulfur bacteria Ectothiorhodospira shaposhnikovii. Microbiology (Engl Transl Mikrobiologiya) 1977;45:655–659. [PubMed] [Google Scholar]
- Kaplan IR. Rittenberg SC. Microbiological fractionation of sulphur isotopes. J Gen Microbiol. 1964;34:195–212. doi: 10.1099/00221287-34-2-195. [DOI] [PubMed] [Google Scholar]
- Kemp ALW. Thode HG. The mechanism of the bacterial reduction of sulphate and of sulfite from isotope fractionation studies. Geochim Cosmochim Acta. 1968;32:71–91. [Google Scholar]
- Kielbasa SM, Wan R, Sato K, Horton P. Frith MC. Adaptive seeds tame genomic sequence comparison. Genome Res. 2011;21:487–493. doi: 10.1101/gr.113985.110. [DOI] [PMC free article] [PubMed] [Google Scholar]
- Kolmert A, Wikstrom P. Hallberg KB. A fast and simple turbidimetric method for the determination of sulfate in sulfate-reducing bacterial cultures. J Microbiol Methods. 2000;41:179–184. doi: 10.1016/s0167-7012(00)00154-8. [DOI] [PubMed] [Google Scholar]
- Kumar AP, Srinivas TNR, Thiel V, Tank M, Sasikala C, Ramana CV. Imhoff JF. Thiohalocapsa marina sp. nov., from an Indian marine aquaculture pond. Int J Syst Evol Microbiol. 2009;59:2333–2338. doi: 10.1099/ijs.0.003053-0. [DOI] [PubMed] [Google Scholar]
- Leavitt WD, Halevy I, Bradley AS. Johnston DT. Influence of sulfate reduction rates on the Phanerozoic sulfur isotope record. Proc Natl Acad Sci USA. 2013 doi: 10.1073/pnas.1218874110. and published ahead of print June 3, 2013, doi: 10.1073/pnas.1218874110. [DOI] [PMC free article] [PubMed] [Google Scholar]
- Loy A, Duller S. Wagner M. Evolution and ecology of microbes dissimilating sulfur compounds: insights from siroheme sulfite reductases. In: Friedrich CG, editor; Dahl C, editor. Microbial Sulfur Metabolism. Berlin, Germany: Springer; 2008. pp. 46–59. [Google Scholar]
- Loy A, Duller S, Baranyi C, Mussmann M, Ott J, Sharon I, et al. Reverse dissimilatory sulfite reductase as phylogenetic marker for a subgroup of sulfur-oxidizing prokaryotes. Environ Microbiol. 2009;11:289–299. doi: 10.1111/j.1462-2920.2008.01760.x. [DOI] [PMC free article] [PubMed] [Google Scholar]
- Ludwig W, Strunk O, Westram R, Richter L, Meier H, Yadhukumar, et al. ARB: a software environment for sequence data. Nucleic Acids Res. 2004;32:1363–1371. doi: 10.1093/nar/gkh293. [DOI] [PMC free article] [PubMed] [Google Scholar]
- Lücker S, Steger D, Kjeldsen KU, MacGregor BJ, Wagner M. Loy A. Improved 16S rRNA-targeted probe set for analysis of sulfate-reducing bacteria by fluorescence in situ hybridization. J Microbiol Methods. 2007;69:523–528. doi: 10.1016/j.mimet.2007.02.009. [DOI] [PubMed] [Google Scholar]
- Manz W, Amann R, Ludwig W, Wagner M. Schleifer K-H. Phylogenetic oligodeoxynucleotide probes for the major subclasses of proteobacteria: problems and solutions. Syst Appl Microbiol. 1992;15:593–600. [Google Scholar]
- Matsen FA, Kodner RB. Armbrust EV. Pplacer: linear time maximum-likelihood and Bayesian phylogenetic placement of sequences onto a fixed reference tree. BMC Bioinformatics. 2010;11:538. doi: 10.1186/1471-2105-11-538. [DOI] [PMC free article] [PubMed] [Google Scholar]
- Meites L. Polarographic Techniques. New York: John Wiley & Sons; 1965. [Google Scholar]
- Meyer F, Paarmann D, D'Souza M, Olson R, Glass EM, Kubal M, et al. The metagenomics RAST server – a public resource for the automatic phylogenetic and functional analysis of metagenomes. BMC Bioinformatics. 2008;9:386. doi: 10.1186/1471-2105-9-386. [DOI] [PMC free article] [PubMed] [Google Scholar]
- Milucka J, Ferdelman TG, Polerecky L, Franzke D, Wegener G, Schmid M, et al. Zero-valent sulphur is a key intermediate in marine methane oxidation. Nature. 2012;491:541–546. doi: 10.1038/nature11656. [DOI] [PubMed] [Google Scholar]
- Neumann S, Wynen A, Truper HG. Dahl C. Characterization of the cys gene locus from Allochromatium vinosum indicates an unusual sulfate assimilation pathway. Mol Biol Rep. 2000;27:27–33. doi: 10.1023/a:1007058421714. [DOI] [PubMed] [Google Scholar]
- Norlund KLI, Southam G, Tyliszczak T, Hu Y, Karunakaran C, Obst M, et al. Microbial architecture of environmental sulfur processes: a novel syntrophic sulfur-metabolizing consortia. Environ Sci Technol. 2009;43:8781–8786. doi: 10.1021/es803616k. [DOI] [PubMed] [Google Scholar]
- Oremland RS. Capone DG. Use of ‘specific’ inhibitors in biogeochemistry and microbial ecology. In: Marshall KC, editor; Advances in Microbial Ecology. New York: Plenum Publishing; 1988. pp. 285–383. [Google Scholar]
- Orphan VJ. Methods for unveiling cryptic microbial partnerships in nature. Curr Opin Microbiol. 2009;12:231–237. doi: 10.1016/j.mib.2009.04.003. [DOI] [PubMed] [Google Scholar]
- Orphan VJ, House CH, Hinrichs KU, McKeegan KD. DeLong EF. Multiple archaeal groups mediate methane oxidation in anoxic cold seep sediments. Proc Natl Acad Sci USA. 2002;99:7663–7668. doi: 10.1073/pnas.072210299. [DOI] [PMC free article] [PubMed] [Google Scholar]
- Overmann J. van Gemerden H. Microbial interactions involving sulfur bacteria: implications for the ecology and evolution of bacterial communities. FEMS Microbiol Rev. 2000;24:591–599. doi: 10.1111/j.1574-6976.2000.tb00560.x. [DOI] [PubMed] [Google Scholar]
- Overmann J. Schubert K. Phototrophic consortia: model systems for symbiotic interrelations between prokaryotes. Arch Microbiol. 2002;177:201–208. doi: 10.1007/s00203-001-0377-z. [DOI] [PubMed] [Google Scholar]
- Pasteris JD, Freeman JJ. Goffredi SK. Raman spectroscopic and laser scanning confocal microscopic analysis of sulfur in living sulfur-precipitating marine bacteria. Chem Geol. 2001;180:3–18. [Google Scholar]
- Peng Y, Leung HC, Yiu SM. Chin FY. IDBA-UD: a de novo assembler for single-cell and metagenomic sequencing data with highly uneven depth. Bioinformatics. 2012;28:1420–1428. doi: 10.1093/bioinformatics/bts174. [DOI] [PubMed] [Google Scholar]
- Petroff AP, Wu TD, Liang B, Mui J, Guerquin-Kern JL, Vali H, et al. Reaction-diffusion model of nutrient uptake in a biofilm: theory and experiment. J Theor Biol. 2011;289:90–95. doi: 10.1016/j.jtbi.2011.08.004. [DOI] [PubMed] [Google Scholar]
- Price MN, Dehal PS. Arkin AP. FastTree 2 – approximately maximum-likelihood trees for large alignments. PLoS ONE. 2010;5:e9490. doi: 10.1371/journal.pone.0009490. [DOI] [PMC free article] [PubMed] [Google Scholar]
- Revsbech NP, Jørgensen BB, Blackburn TH. Cohen Y. Microelectrode studies of the photosynthesis and O2, H2S, and pH profiles of a microbial mat. Limnol Oceanogr. 1983;28:1062–1074. [Google Scholar]
- Rothermich MM, Guerrero R, Lenz RW. Goodwin S. Characterization, seasonal occurrence, and diel fluctuation of poly(hydroxyalkanoate) in photosynthetic microbial mats. Appl Environ Microbiol. 2000;66:4279–4291. doi: 10.1128/aem.66.10.4279-4291.2000. [DOI] [PMC free article] [PubMed] [Google Scholar]
- Sander J. Dahl C. Metabolism of inorganic sulfur compounds in purple bacteria. In: Beatty JT, editor; Hunter CN, Daldal F, Thurnauer MC, editors. The Purple Phototrophic Bacteria. The Netherlands: Springer; 2008. pp. 595–622. [Google Scholar]
- Schink B. Synergistic interactions in the microbial world. Antonie Van Leeuwenhoek. 2002;81:257–261. doi: 10.1023/a:1020579004534. [DOI] [PubMed] [Google Scholar]
- Schlesinger W. Biogeochemistry: An Analysis of Global Change. San Diego: Academic Press; 1997. [Google Scholar]
- Seitz AP, Nielsen TH. Overmann J. Physiology of purple sulfur bacteria forming macroscopic aggregates in Great Sippewissett Salt Marsh, Massachusetts. FEMS Microbiol Ecol. 1993;12:225–235. [Google Scholar]
- Sim MS, Bosak T. Ono S. Large sulfur isotope fractionation does not require disproportionation. Science. 2011a;333:74–77. doi: 10.1126/science.1205103. [DOI] [PubMed] [Google Scholar]
- Sim MS, Ono S, Donovan K, Templer SP. Bosak T. Effect of electron donors on the fractionation of sulfur isotopes by a marine Desulfovibrio sp. Geochim Cosmochim Acta. 2011b;75:4244–4259. [Google Scholar]
- Slowey A. Marvin-DiPasquale M. How to overcome inter-electrode variability and instability to quantify dissolved oxygen, Fe(II), mn(II), and S(II) in undisturbed soils and sediments using voltammetry. Geochem Trans. 2012;13:6. doi: 10.1186/1467-4866-13-6. [DOI] [PMC free article] [PubMed] [Google Scholar]
- Stamatakis A. RAxML-VI-HPC: maximum likelihood-based phylogenetic analyses with thousands of taxa and mixed models. Bioinformatics. 2006;22:2688–2690. doi: 10.1093/bioinformatics/btl446. [DOI] [PubMed] [Google Scholar]
- Stewart FJ, Ulloa O. DeLong EF. Microbial metatranscriptomics in a permanent marine oxygen minimum zone. Environ Microbiol. 2012;14:23–40. doi: 10.1111/j.1462-2920.2010.02400.x. [DOI] [PubMed] [Google Scholar]
- Swan BK, Martinez-Garcia M, Preston CM, Sczyrba A, Woyke T, Lamy D, et al. Potential for chemolithoautotrophy among ubiquitous bacteria lineages in the dark ocean. Science. 2011;333:1296–1300. doi: 10.1126/science.1203690. [DOI] [PubMed] [Google Scholar]
- Treseder KK, Balser TC, Bradford MA, Brodie EL, Dubinsky EA, Eviner VT, et al. Integrating microbial ecology into ecosystem models: challenges and priorities. Biogeochemistry. 2011;109:7–18. [Google Scholar]
- Visscher P, Reid R. Bebout B. Microscale observations of sulfate reduction: correlation of microbial activity with lithified micritic laminae in modern marine stromatolites. Geology. 2000;28:919–922. [Google Scholar]
- Wallner G, Amann R. Beisker W. Optimizing fluorescent in situ hybridization with rRNA-targeted oligonucleotide probes for flow cytometric identification of microorganisms. Cytometry. 1993;14:136–143. doi: 10.1002/cyto.990140205. [DOI] [PubMed] [Google Scholar]
- Walsh DA, Zaikova E, Howes CG, Song YC, Wright JJ, Tringe SG, et al. Metagenome of a versatile chemolithoautotroph from expanding oceanic dead zones. Science. 2009;326:578–582. doi: 10.1126/science.1175309. [DOI] [PubMed] [Google Scholar]
- Wrighton KC, Thomas BC, Sharon I, Miller CS, Castelle CJ, VerBerkmoes NC, et al. Fermentation, hydrogen, and sulfur metabolism in multiple uncultivated bacterial phyla. Science. 2012;337:1661–1665. doi: 10.1126/science.1224041. [DOI] [PubMed] [Google Scholar]
- Zerkle AL, Farquhar J, Johnston DT, Cox RP. Canfield DE. Fractionation of multiple sulfur isotopes during phototrophic oxidation of sulfide and elemental sulfur by a green sulfur bacterium. Geochim Cosmochim Acta. 2009;73:291–306. [Google Scholar]
Associated Data
This section collects any data citations, data availability statements, or supplementary materials included in this article.
Supplementary Materials
Additional Supporting Information may be found in the online version of this article at the publisher's web-site
Supplemental results and discussion.
S2. Supplemental data. SIMS 7f-GEO raw and processed data used to construct for main text Figure 7C,D.
S3. Supplemental data. NanoSIMS-50L raw and processed data used to construct Figure 8A,B in main text.
Maximum-likelihood phylogeny (rooted) constructed from 16S rRNA gene sequences of pink berry purple sulfur bacteria PB-PSB1 and cultured Chromatiales relatives. Phylogeny was constructed with FastTree using the approximate maximum-likelihood method (Price et al., 2010) and GTRCAT approximation with 20 rate categories. Values at the nodes are SH-like local supports (1000) computed by FastTree and used as condiference values of tree branches. Scale bar represents the number of estimated changes per position for a unit of branch length.
Fig. S2. Maximum-likelihood phylogeny (mid-point rooted) constructed from 16S rRNA gene sequences of pink berry Bacteroidetes phylotypes OTUs (pink), cultured isolates (blue) and uncultured environmental amplicon. Phylogeny was constructed with FastTree using the approximate maximum-likelihood method (Price et al., 2010) and GTRCAT approximation with 20 rate categories. Values at the nodes are SH-like local supports (1000) computed by FastTree and used as condiference values of tree branches. Scale bar represents the number of estimated changes per position for a unit of branch length. Marked with red stars are the dominant pink berry phylotypes. Note the relative scarcity of cultured isolates and abundance of related sequences from diverse sulfur-cycling habitats.
Fig. S3. Maximum-likelihood phylogeny (mid-point rooted) constructed from 18S rRNA gene sequences of pink berry eukaryotes OTUs and cultured relatives. Phylogeny was constructed with FastTree using the approximate maximum-likelihood method (Price et al., 2010) and GTRCAT approximation with 20 rate categories. Values at the nodes are SH-like local supports (1000) computed by FastTree and used as condiference values of tree branches. Scale bar represents the number of estimated changes per position for a unit of branch length.
Fig. S4. Epifluorescence microscopy of CARD-FISH hybridization of sectioned pink berries with a nonsense probe (NON338, panel A), and a Gammaproteobacteria probe (GAM42a, panel B). The left side of each panel shows the Alexa 488 probe signal and background autofluorescence; the right side of the panel shows the DAPI stain.
Fig. S5. Maximum-likelihood phylogeny (FastTree) constructed from an alignment of full-length dsrAB gene sequences (Loy et al., 2009). Illumina sequence reads were processed with the Phylosift pipeline which placed them onto this fixed, full-length reference tree using pplacer (Matsen et al., 2010). Branches with reads placed are in red, and with a branch line width proportional to the number of assigned sequences.
Fig. S6. Chromatiales soxYZ gene. Generated by RAST synteny viewer using 1e-20 BLASTP similarity cut-off to define and colour gene sets (each set has unique number and colour). Ordered according to % aa similarity to scaffold_341 soxY query. Note the conserved Chromatiales hypothetical gene cluster upstream from soxYZ (7,12,10,3).
Fig. S7. Chromatiales dsrABEFHCMKLJOPNRS gene cluster is represented in three distinct metagenomic contigs from PB-PSB1. Generated by RAST synteny viewer using 1e-20 BLASTP similarity cut-off to define and colour gene sets (each set has unique number and colour). Ordered according to % aa similarity to scaffold_285 dsrA query. Genes shown in parenthesis at top (dsrH and dsrJ) were not annotated on metagenomic contigs by RAST but are identifiable as gene fragments using independent BLASTP queries. Also, note the conserved Chromatiales hypothetical gene cluster upstream from dsrAB (10,17,16/18).
Fig. S8. Genomic context of aprM–aprBA gene cluster in PB-PSB1. Generated by RAST synteny viewer using 1e-20 BLASTP similarity cut-off to define and colour gene sets (each set has unique number and colour). Ordered according to % aa similarity to the scaffold_71 aprB query.
Fig. S9. Genomic context of aprAB–qmoABC gene cluster in PB-SRB1.Generated by RAST synteny viewer using 1e-20 BLASTP similarity cut-off to define and colour gene sets (each set has unique number and colour). Ordered according to % aa similarity to the scaffold_149 aprA query.
Fig. S10. Genomic context of dsrAB PB-SRB1. Generated by RAST synteny viewer using 1e-20 BLASTP similarity cut-off to define gene sets (each set has unique number and colour). Table below shows annotations for Desulfobulbaceae-conserved genes in this genomic region. Ordered according to % aa similarity to scaffold_206 dsrA query.
Fig. S11. Genomic context of dsrC PB-SRB1. Generated by RAST synteny viewer using 1e-20 BLASTP similarity cut-off to define gene sets (each set has unique number and colour). Table below shows annotations for conserved genes in PB-SRB1 in this genomic region. Ordered according to % aa similarity to the scaffold_372 dsrC query.
Fig. S12. Genomic context of dsrMKJOP gene cluster in PB-SRB1. Generated by RAST synteny viewer using 1e-20 BLASTP similarity cut-off to define and colour gene sets (each set has unique number and colour). Ordered according to % aa similarity to the scaffold_12 dsrM query.
Fig. S13. Elemental analyser–isotope ratio mass spectrometry of pooled berry biomass from dark incubations with either added 34 S-enriched sulfate (‘labelled’) or standard sulfate (‘unlabelled’). Incubations were conducted both with and without 10 mM molybdate. Also shown are three different measurements of pooled berry biomass taken directly from the marsh (‘native’). Values shown are per mil V-CDT, the mean of biological replicates; error bars show standard deviation between these replicates.
Quantification of the single copy phylogenetic marker genes for estimating genome completion and number of genomes per bin of the PB-SRB1 and PB-PSB1 associated bins. Note that translation elongation factor EF-2 is duplicated in the closely related Desulfobulbaceae genomes.
Table S2. Genes of interest in the PB-PSB1 and PB-SBR1 genomes. Gene locations are based on the RAST annotations of the genomes (complete dataset available at FigShare).