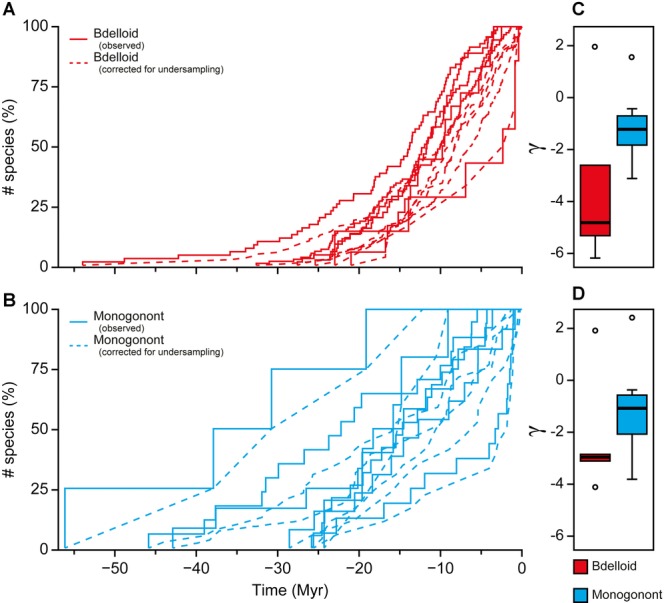
Figure 6.

Lineage through time plots of bdelloid (light gray; red online) and monogonont rotifers (dark gray; blue online) on absolute time scales with differences in shifts in diversification rate (γ) shown. Lineage through time plots (bdelloid (A) and monogonont (B)) are based on pruned Bayesian trees, each tip represents only one terminal per species as identified by the GMYC. Lineage through time plots of phylogenies corrected for undersampling using CorSiM are also shown (dotted lines). Differences between bdelloids and monogononts in the distribution of the raw (C) and corrected values for the γ statistic (D) are shown. Open circles represent outlier values.
