

Abstract
Epigenetic dysregulation is an emerging hallmark of cancers. We developed a high-information-content mass spectrometry approach to profile global histone modifications in human cancers. When applied to 115 lines from the Cancer Cell Line Encyclopedia1, this approach identified distinct molecular chromatin signatures. One signature was characterized by increased histone 3 lysine 36 (H3K36) dimethylation, exhibited by several lines harboring translocations in NSD2, which encodes a methyltransferase. A previously unknown NSD2 p.Glu1099Lys (p.E1099K) variant was identified in nontranslocated acute lymphoblastic leukemia (ALL) cell lines sharing this signature. Ectopic expression of the variant induced a chromatin signature characteristic of NSD2 hyperactivation and promoted transformation. NSD2 knockdown selectively inhibited the proliferation of NSD2-mutant lines and impaired the in vivo growth of an NSD2-mutant ALL xenograft. Sequencing analysis of >1,000 pediatric cancer genomes identified the NSD2 p.E1099K alteration in 14% of t(12;21) ETV6-RUNX1–containing ALLs. These findings identify NSD2 as a potential therapeutic target for pediatric ALL and provide a general framework for the functional annotation of cancer epigenomes.
To gain a more comprehensive understanding of epigenetic dysregulation in cancers, we developed global chromatin profiling, a targeted mass spectrometry (MS) approach to measure the levels of histone modifications in bulk chromatin. MS enables a comprehensive quantitative view of histone alterations and avoids the limitations of antibody-based methods. In particular, the limited availability of high-quality antibodies often restricts which histone marks can be profiled, and cross-reactivity among different marks can further complicate data interpretation2. Here, we used the MS profiling approach to characterize global histone modifications in a subset of cell lines in the Cancer Cell Line Encyclopedia (CCLE), a collection of ~1,000 human cancer lines that has undergone extensive genomic and pharmacologic annotation1. We monitored 42 distinct combinations (for example, modification of separate lysine residues on the same peptide) of histone modifications on H3 across 115 CCLE lines. Our study focused primarily on H3 lysine methylations, given the strong evidence of deregulation of H3 lysine methyltransferases and demethylases in cancers3. Additionally, we prioritized hematological malignancies (Supplementary Table 1) owing to prior evidence of epigenetic dysregulation4-6.
Unsupervised clustering of the resulting data set revealed six clusters (Fig. 1 and Supplementary Fig. 1) with distinct molecular chromatin signatures. Cluster A was characterized by a marked increase of H3K27 trimethylation with a concomitant decrease in mono- and dimethylation at K27 (Figs. 1 and 2). All lines in cluster A were derived from B-cell lymphomas and harbored alterations in the catalytic SET domain of the H3K27 methyltransferase EZH2. These particular alterations have previously been shown to confer gain-of-function activity on EZH2 (refs. 7-9), leading to increased H3K27 trimethylation, consistent with our functional annotation derived from the chromatin signature.
Figure 1.
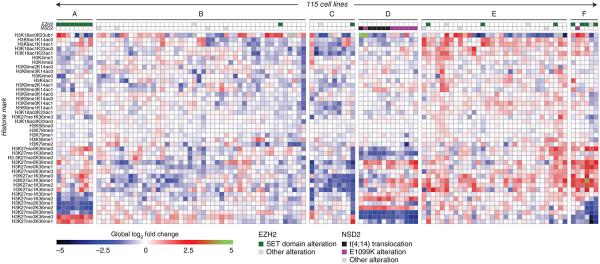
Global chromatin profiling identifies distinct molecular chromatin-signature profiles in the CCLE collection. We subjected 115 cell lines to molecular chromatin-signature profiling by MS. Each row corresponds to a H3 peptide with the specific combination of marks shown (left). The value in each cell of the heatmap corresponds to the log2-fold change of the mark combination versus the median for each row. EZH2 and NSD2 status are indicated. Clusters A–F are identified for reference in the main text.
Figure 2.

H3K27 and H3K36 methylation alterations drive the identification of unique molecular chromatin signatures. Molecular chromatin-signature profiles of clusters A, D and F, magnified to show a subset of histone H3 peptides that drive the key signatures of these three clusters.
Contrarily to cluster A, cluster F was characterized by decreased H3K27 di- and trimethylation with an increase in K27 species that were either unmodified or acetylated (as opposed to methylated) (Figs. 1 and 2 and Supplementary Fig. 1). Notably, 5/6 lines in this cluster also harbored EZH2 alterations, four of which localized in the SET domain. However, these alterations were distinct from those found in cluster A (Supplementary Fig. 1 and Supplementary Tables 1 and 2), and their chromatin signature suggested loss rather than gain of EZH2 activity. EZH2 has a context-dependent role in tumorigenesis and loss-of-function mutations were reported in leukemia6,10. In total, 4/6 lines in cluster F are leukemic lines, consistent with the EZH2 and Polycomb repressive complex 2 (PRC2) loss-of-function spectrum reported in this malignancy. The two nonleukemic lines in cluster F were derived from thyroid and urinary cancers (Supplementary Table 1), raising the possibility that EZH2 and PRC2 loss-of-function alterations may also occur in solid tumors. Collectively, these findings demonstrate that chromatin signatures successfully captured known relationships between chromatin-modifying gene mutations and global histone modification patterns, enabling the systematic functional annotation of alterations of epigenetic regulators.
Cluster D displayed a distinct chromatin state characterized by increased H3K36 dimethylation and decreased unmodified H3K36 (Figs. 1 and 2). Of the lines that compose cluster D, 6/13 are known to harbor the t(4;14) translocation, which leads to overexpression of NSD2 (also known as WHSC1 or MMSET)11,12. Overexpression of NSD2 in t(4;14)-positive multiple myeloma (MM) is associated with globally increased levels of H3K36 dimethylation and decreased K27 trimethylation13, consistent with the chromatin signature in cluster D. However, more than half of cluster D lines (7/13) lacked t(4;14) translocations.
To determine whether specific genetic or other molecular features were enriched in these remaining lines, we performed a systematic interrogation of all CCLE features, including gene expression, copy number and mutation data (see Online Methods). This analysis revealed a previously unknown NSD2 coding variant (NSD2 p.E1099K) that was present in all seven cluster D lines lacking the t(4;14) translocation (false discovery rate (FDR)-adjusted P value = 7.61 × 10⁻⁵). The NSD2 p.E1099K alteration was strongly enriched in ALL cell lines across the CCLE collection (Fig. 3a and Supplementary Table 3), and all NSD2 mutations were found to be heterozygous by exon capture and cDNA sequencing (Supplementary Fig. 2).
Figure 3.

Identification of recurrent NSD2 alterations in ALL. (a) Distribution of NSD2 p.E1099K cell lines across 181 CCLE cell lines of hematopoietic origin. AML, acute myeloid leukemia; CML, chronic myeloid leukemia; MCL, mantle-cell lymphoma; BL, Burkitt’s lymphoma; DLBCL, diffuse large B-cell lymphoma; HL, Hodgkin’s lymphoma. Six ALL cell lines and one myeloma cell line contain the p.E1099K alteration (red). Eight myeloma cell lines contain the t(4;14) translocation (gray). (b) Mapping of the NSD2 p.E1099K alteration on the domain structure of NSD2. Bottom, alignment of amino acids surrounding E1099 in the SET domain sequence of NSD2 with other histone methyltransferases. NSD1, NSD2, NSD3, SETD2 and MES4 methylate H3K36. Boxes indicate identical residues among NSD proteins; red dots indicate identical residues across all sequences. (c) Structural modeling of NSD2 E1099 (magenta stick) to K1099 (white stick) alteration. It is predicted to alter binding between NSD2 (shown in green) and the histone peptide (shown in blue). C1183 (green stick), S31 (blue stick) and K36 (blue stick) are shown to identify modeled locations between residues on NSD2 and the H3 peptide. Dashed line indicates interactions between NSD2 and H3 peptide.
NSD2 is an H3K36 methyltransferase that catalyzes the conversion of unmodified H3K36 to the monomethylated and dimethylated forms13-15. Residue E1099 is located within the SET domain and conserved among the three NSD family members (NSD1, NSD2 and NSD3) but not in other SET domain-containing methyltransferases (Fig. 3b). A homology model of NSD2 based on the NSD1 crystal structure indicated that E1099 is located in a loop proximal to the substrate binding pocket16, raising the possibility that the p.E1099K substitution may alter NSD2-substrate interactions (Fig. 3c and Supplementary Fig. 3). Consistent with this notion, recombinant NSD2 p.E1099K showed higher in vitro activity toward methylating nucleosomes compared to the wild-type enzyme (Fig. 4a). Additionally, all p.E1099K mutant lines showed decreased unmodified H3K36 and increased H3K36 dimethylation in their chromatin signatures (Fig. 1), strongly suggesting that the p.E1099K substitution leads to increased NSD2 activity in cells.
Figure 4.

NSD2 p.E1099K alteration leads to increased enzymatic activity and promotes transformation. (a) Biochemical characterization of the enzymatic activity of wild-type (WT) and p.E1099K-mutant NSD2. The catalytic domain of NSD2 (955–1365) was purified and assayed with nucleosome substrates. Enzymatic activity was assessed by quantifying the production of S-adenosyl-L-homocysteine (SAH) on the y axis. Error bars indicate the s.d. of triplicate measurements. (b) Western blot analysis of lysates from KMS11-TKO cells reconstituted with WT NSD2, p.E1099K-mutant NSD2, CDM NSD2 or both p.E1099K and CDM (p.E1099K-CDM) NSD2 or empty vector, analyzed with the indicated antibodies. Histone H3, loading control. (c) Quantification of soft-agar transformation (5% serum) of KMS11-TKO cells reconstituted with the indicated NSD2 variants. Error bars indicate the s.d. of triplicate samples (see also Supplementary Fig. 5). (d) Global chromatin profiling of KMS11-TKO engineered lines. Chromatin-signature profiling, clustering and color coding are as described in Figure 1. KMS11-TKO cells were reconstituted with the indicated NSD2 variants. The chromatin-signature profiling of KMS11-TKO reconstituted cells is shown with a representative panel of hematopoietic cell lines (see Supplementary Fig. 4 for complete data set and dendrogram shown).
To further investigate the functional effects of the NSD2 p.E1099K alteration, we used KMS11-TKO, an MM cell line in which the translocated NSD2 allele has been specifically deleted17. We engineered these cells to express wild-type, p.E1099K or a catalytically inactive (CDM) NSD2 to examine their impact on chromatin signatures (Fig. 4b,d and Supplementary Figs. 4 and 5). KMS11-TKO cells did not cluster with the parental KMS11 line, as deletion of the translocated allele abolished the ‘hyperactivated’ H3K36 methylation state (Fig. 4d and Supplementary Fig. 4). Expression of either wild-type NSD2 or the p.E1099K mutant, but not the CDM variant, led to increased H3K36 dimethylation and decreased H3K27 trimethylation levels when assayed by immunoblotting (Fig. 4b), whereas H3K4 and H3K9 methylation levels were not affected (Supplementary Fig. 6a). The effect of NSD2 p.E1099K to promote H3K36 dimethylation is also observed in NIH3T3 mouse embryonic fibroblasts (Supplementary Fig. 7). Chromatin profiling allowed us to further distinguish the activity of p.E1099K mutant and wild-type NSD2. KMS11-TKO cells engineered to re-express wild-type NSD2 clustered away from lines carrying the t(4;14) translocation or p.E1099K alteration (Fig. 4d). In contrast, expression of the allele encoding NSD2 p.E1099K in KMS11-TKO cells fully restored the ‘hyperactivated’ H3K36 methylation state and resulted in clustering with the parental KMS11 cells (Fig. 4d and Supplementary Fig. 4). This increased ability to promote H3K36 dimethylation by NSD2 p.E1099K was accompanied by a significant increase in soft-agar colony formation compared to wild-type NSD2 (Fig. 4c and Supplementary Fig. 5). The transforming activity of NSD2 p.E1099K was dependent on its methyltransferase activity, as introduction of the catalytic-dead mutant (CDM) markedly impaired colony formation (Fig. 4c and Supplementary Fig. 5). Notably, most NSD2-mutant ALL cells, but not their wild-type counterparts, displayed robust colony formation (5/6 for mutant versus 2/13 for wild-type; Supplementary Table 4). Together, these findings demonstrate that the allele encoding NSD2 p.E1099K is sufficient to induce a ‘hyperactivated’ H3K36 histone signature in cells and promotes transformation.
Next, we sought to ascertain whether NSD2 p.E1099K-mutant ALL lines were dependent on NSD2 for viability. Depletion of NSD2 with two independent short hairpin RNAs (shRNAs) reduced global H3K36me2 levels and inhibited the growth of all p.E1099K-mutant ALL lines examined (Fig. 5a,b and Supplementary Fig. 6b). In contrast, NSD2 knockdown only marginally affected the growth of wild-type lines (Fig. 5a,b). Moreover, NSD2 depletion strongly inhibited the colony forming ability of p.E1099K-mutant ALL lines, whereas control cells were largely unaffected (Fig. 5c,d). To investigate whether NSD2 is required for tumorigenesis in vivo, we established a subcutaneous xenograft model in mice using SEM leukemic cells stably transduced with doxycycline-inducible NSD2 shRNA. NSD2 depletion was induced by doxycycline addition when tumors reached approximately 200 mm3. NSD2 knockdown led to a significant decrease in H3K36 dimethylation and markedly inhibited tumor growth (P < 0.05), whereas a control GFP shRNA did not affect this xenograft model (Fig. 5e,f and Supplementary Fig. 6c). Collectively, these data strongly suggest that NSD2 p.E1099K-mutant ALL lines are dependent on dysregulated NSD2 in vitro and in vivo.
Figure 5.

NSD2 is required for the growth and proliferation of ALL cells carrying the p.E1099K alteration. (a) Immunoblots of NSD2, H3K36me2, H3 and γ-tubulin in a panel of six leukemic cell lines (red text indicates NSD2 1099K mutant cell lines). JVM-2 is B-cell chronic lymphocytic leukemia cell line; and the remaining five samples are from ALL cell lines. Doxycycline (dox) was used to induce the expression of two independent NSD2 shRNAs (sh1 and sh2). (b) Cell-proliferation assays of the indicated cell lines after NSD2 knockdown. The bars represent proliferation in dox-treated cells relative to untreated controls after 12 d. Error bars indicate s.d. of duplicate samples. Red text indicates NSD2 1099K mutant cell lines. (c) Soft-agar colony formation assay of SEM cells expressing the indicated shRNAs. (d) Quantification of soft-agar colony formation of the indicated ALL cell lines in response to induction (+ dox) of the indicated shRNAs. GFP shRNA was included as control (con). Error bars indicate the s.d. of triplicate samples. (e) Effect of inducible NSD2 and GFP shRNAs in the presence and absence of dox on the growth of subcutaneous SEM xenografts. Mean tumor volume ± s.e.m. is shown (n = 6 for NSD2 shRNA; n = 5 for GFP shRNA). (f) Immunoblots of NSD2 and H3K36me2 of tumor xenografts 18 d after dox induction. Individual tumor samples from each treatment group are shown (n = 6 for NSD2 shRNA; n = 5 for GFP shRNA). H3 and γ-tubulin were included as loading controls.
NSD2 mutations in the CCLE appeared to be strongly enriched in ALL lines (Fig. 3a), most of which were derived from patients with pediatric ALL (Supplementary Table 3). To confirm the occurrence of NSD2 mutations in primary pediatric ALL and determine their prevalence across all major subtypes of pediatric cancer, we sequenced coding exons of NSD2 in 1,021 pediatric cancer samples and their matching normal DNA. The cohort represented 21 different cancers and contained examples of all major subtypes of leukemias, brain tumors and solid tumors seen in the pediatric population (Table 1). The leukemia cohort included a large collection of 239 pediatric B-progenitor acute lymphoblastic leukemia (B-ALL) but lacked hyperdiploid and uncharacterized B-ALL cases. Matched nontumor tissue samples were available for each patient, allowing us to verify the somatic nature of mutations. Notably, 19 tumors, including 18 ALL and one low-grade glioma were found to harbor somatic mutations in NSD2, with the p.E1099K alteration being most prevalent (15/19 cases) (Supplementary Table 5). One tumor harbored a D1125N substitution, four samples had intragenic deletions of exons 1–4 (three cases) or exons 1–5 (one case) (Supplementary Fig. 8), and one displayed an interchromosomal rearrangement resulting in fusion of the 5′ UTR of ST6GAL1 on chromosome 3 with exon 1 of NSD2 on chromosome 4 (Supplementary Fig. 9). Notably, the deletions generate an aberrant transcript that matches one of the altered forms of NSD2 (MB4-2) previously detected in MM resulting from t(4;14) translocation (Supplementary Fig. 8). These NSD2 variants (p.D1125N and MB4-2) increased H3K36 dimethylation and the transforming ability of NSD2 in KMS11-TKO cells similar to NSD2 p.E1099K, suggesting that these variants also lead to NSD2 hyperactivation (Supplementary Fig. 5a,b).
Table 1.
NSD2 somatic mutations in pediatric cancer
| Cancer | Disease | Cohort |
Sequencing platform |
NSD2 alteration |
||||
|---|---|---|---|---|---|---|---|---|
| Patients (n) | Whole-genome | Whole-exome | Capturea | Patients (n) | Frequency (%) | Alteration | ||
| Leukemia | ETV | 50 | 50 | 2 | 50 | 10 | 20.0 | p.E1099K (n = 7) D1125N |
| (n = 1) DEL (n = 4) | ||||||||
| E2A | 33 | 12 | 24 | 0 | 5 | 15.2 | p.E1099K (n = 5) | |
| HYPO | 37 | 19 | 17 | 4 | 1 | 2.7 | p.E1099K (n = 1) | |
| PHALL | 40 | 24 | 18 | 0 | 1 | 2.5 | p.E1099K (n = 1) | |
| INFb | 55 | 23 | 7 | 40 | 1 | 1.8 | p.E1099K (n = 1) | |
| AML | 41 | 0 | 0 | 41 | 0 | N/A | N/A | |
| AML-M7 | 11 | 4 | 11 | 2 | 0 | N/A | N/A | |
| CBF | 83 | 17 | 66 | 4 | 0 | N/A | N/A | |
| ERG | 24 | 13 | 13 | 0 | 0 | N/A | N/A | |
| MLLc | 20 | 0 | 20 | 1 | 0 | N/A | N/A | |
| T-ALL | 91 | 12 | 10 | 90 | 0 | N/A | N/A | |
| Brain tumors | EPD | 40 | 40 | 0 | 21 | 0 | N/A | N/A |
| HGGd | 80 | 37 | 48 | 3 | 0 | N/A | N/A | |
| LGG | 83 | 35 | 0 | 48 | 1 | 1.2 | ST6GAL1-NSD2 (n = 1) | |
| MB | 70 | 37 | 0 | 53 | 0 | N/A | N/A | |
| Solid tumors | ACT | 38 | 20 | 18 | 0 | 0 | N/A | N/A |
| EWS | 19 | 19 | 0 | 0 | 0 | N/A | N/A | |
| NBL | 100 | 39 | 0 | 82 | 0 | N/A | N/A | |
| OS | 19 | 19 | 0 | 2 | 0 | N/A | N/A | |
| RB | 47 | 4 | 0 | 46 | 0 | N/A | N/A | |
| RHB | 37 | 13 | 23 | 30 | 0 | N/A | N/A | |
| All | 1,018 | 437 | 277 | 517 | 19 | 1.9 | N/A | |
ETV, B-progenitor acute lymphoblastic leukemia (B-ALL) with ETV6-RUNX1; E2A, B-ALL with TCF3-PBX1; HYPO, B-ALL with a hypodiploid karyotype; PHALL, B-ALL with BCR-ABL1; INF, infant ALL; ERG, B-ALL with ERG alterations; T-ALL, T-lineage ALL; MLL, noninfant ALL with MLL rearrangements; AML, acute myeloid leukemia; AML-M7, acute megakaryocytic leukemia FAB M7; CBF, core binding factor AML; EPD, ependymoma; HGG, high-grade glioma; LGG, low-grade glioma; MB, medulloblastoma; ACT, adrenocortical carcinoma; EWS, Ewing’s sarcoma; MEL, melanoma; NBL, neuroblastoma; OS, osteosarcoma; RB, retinoblastoma; RHB, rhabdomyosarcoma; N/A, not applicable.
Capture data include custom capture of all coding exons of NSD2 followed by NGS. The low-grade glioblastoma sample SJLGG039 has been deposited in the EBI-EMBL EGA under accession code EGAS00001000255. The bam files of the DNA sequencing data for all pediatric cancer samples and the NSD2 RNA-seq data presented in this paper are deposited in the EBI-EMBL EGA under accession code EGAS00001000449.
Of the 55 cases of infant ALL, five are T-ALL and one is AML.
The MLL ALLs include ten AMLs and four T-ALLs.
Eighty-three tumors were sequenced from these 80 patients.
Recent genomic studies of leukemia have demonstrated significant clonal heterogeneity with frequent occurrence of a dominant clone and one or more minor subclones at the time of diagnosis18,19. Consistent with previous observations, the clinical NSD2 mutations described here spanned a spectrum of heterogeneity, with some present in the dominant subclone, some as major subclones and others as minor subclones. In 6/16 cases, the NSD2 mutations were present in the dominant clone (>50% of cells having a mutant allele fraction (MAF) >0.25), including three with MAF >0.47 (Supplementary Table 5), suggesting that the mutation is present in every cell. Four cases had the mutation in 20–50% of cells, and six had the mutation present only within a minor subclone that comprised <20% of cells. Two ALL cases, ETV022 and ETV026, contained both a p.E1099K sequence alteration (present as a ~4% minor clone) and an NSD2 deletion (present in 30–36% of cells). For leukemias with subclonal NSD2 mutations (MAF of 0.01–0.25), available RNA-seq data confirmed expression of the mutant NSD2 allele (Supplementary Table 5 and Supplementary Figs. 8 and 9).
All somatic mutations except for the ST6GAL1-NSD2 fusion were identified in B-ALL, resulting in an overall frequency of 7.5% (18/239) in B-ALL tumors analyzed. Moreover, NSD2 mutations were enriched in the B-ALL subtypes t(12;21) ETV6-RUNX1 (20%) and t(1;19) TCF3-PBX1 (15%). Sequencing of 30 adult ALL diagnostic samples did not identify any NSD2 mutations (data not shown), suggesting that NSD2 alterations occur predominantly in pediatric ALL. The high frequency of NSD2 mutations in ETV6-RUNX1 ALL (which is found rarely in adults) is consistent with this interpretation. These findings confirm NSD2 as a frequent target of mutations in several pediatric ALL subtypes and suggest that its inhibition may provide a therapeutic benefit for these patients.
Epigenetic dysregulation of histone marks occurs commonly in cancer. Thus far, these alterations have been studied primarily through antibody-based approaches20-22. The MS approach described here circumvents limitations of antibody-based methods while allowing for comprehensive and high-information-content profiling of all histone modifications. Cancer genome sequencing studies have identified recurrent mutations in several chromatin-modifying enzymes3, but many of these alterations lack functional annotation. This study demonstrates the potential utility of chromatin profiling to functionally annotate gene mutations whose epigenetic consequences remain unknown. The recognition that NSD2 mutations produce a characteristic chromatin signature and dependency on oncogenic NSD2 activity suggests that this mutant protein may provide a promising therapeutic target in pediatric ALL. In the future, chromatin signatures may provide novel biomarkers for predicting response to epigenetic therapies. The presence of an EZH2 gain-of-function signature, for instance, appears to correlate with sensitivity to pharmacological EZH2 inhibitors23,24. More generally, this approach may offer a roadmap for systematic profiling of chromatin states across many cancers to inform epigenetic therapy.
METHODS
Methods and any associated references are available in the online version of the paper.
Accession codes
European Genome-phenome Archive: The low-grade glioblastoma sample SJLGG039 has been deposited in the EBI-EMBL EGA under accession code EGAS00001000255. The bam files of the DNA sequencing data for all pediatric cancer samples and the NSD2 RNA-seq data presented in this paper are deposited in the EBI-EMBL EGA under accession code EGAS00001000449.
ONLINE METHODS
Patient samples
All samples were obtained with patient or parent/guardian-provided informed consent under protocols approved by the Institutional Review Board at St. Jude Children’s Research Hospital.
Cell culture
KMS11-TKO17 cells were obtained from Horizon Discovery Ltd. (Cambridge, UK). NSD2 (wild type, 1–1365), p.E1099K and CDM mutant (F1117G Y1118S R1138A C1144A)25,26 were cloned into pLVX-IRES vectors (Clontech). NSD2-shRNAs (5′CGGAAAGCCAAGTTCACCTTT3′) and (5′GAATAAGCCTTACGGGAAA3′) and GFP-shRNA (5′GCTATAACTCACATAATGT3′) were cloned in Tet-U6-pLKO. Cell proliferation assays were carried out in six-well plates (106 cells per well in 5 ml medium) by Vi-cell analyzer (Beckman Coulter). Doxycycline (100 ng/mL) was added every 2 d to induce shRNA expression. Colony formation in soft agar was done in 48-well plates (Lonza, 50101), with the bottom layer containing 200 μL of 0.5% agarose in 10% FBS/RPMI 1640, the middle layer containing 500 μL of 0.3% agarose (TKO cells) or 0.15% agarose (ALL cells), and the top layer containing 200 μL of 0.5% agarose. Doxycycline was added every 2 d to the liquid layer on the top agarose at a final concentration of 200 ng/mL. Biochemical NSD2 enzyme assays were performed at room temperature for 2 h in assay buffer (20 mM Tris-HCl, pH 8.0, 0.01% Tween 20, 10 mM MgCl2, 0.01% BSA and 1 mM DTT) containing the indicated amount of enzyme, S-adenosyl-L-methionine (SAM), and nucleosome. Method for SAH quantification was previously described24. All cell lines used in the work are from the CCLE collection, authenticated by SNP profiling and tested for mycoplasma.
Mass spectrometry
Standard cell lines labeled by SILAC. HeLa, K562 and 293T cells were acquired from ATCC (Manassas, VA). HeLa medium: RPMI without lysine, arginine or methionine (Caisson Labs, North Logan, UT), plus 5% dialyzed FBS (dFBS), 1% penicillin-streptomycin-glutamine (PSG) (Life Technologies, Grand Island, NY), 30 mg/L L-methionine, 80 mg/L (13C6,15N4)-L-arginine, 40 mg/L L-lysine. K562 medium: RPMI without lysine, arginine, or methionine, plus 10% dFBS, 1% PSG, 30 mg/L L-methionine, 80 mg/L (13C6,15N4)-L-arginine, 40 mg/L L-lysine plus 200 mg/L L-proline. 293T medium: DMEM without lysine, arginine or methionine (Caisson Labs), plus 10% dFBS, 4.5 g/L glucose, 1% PSG, 56 mg/L (13C6,15N4)-L-arginine, 146 mg/L L-lysine, 30 mg/L L-methionine plus 200 mg/L L-proline. Lines were propagated according to standard tissue-culture practices. For harvest, cells were washed twice with PBS (Life Technologies) and pelleted at 1,000 × g for 2 min. The supernatant was then removed, and the cell pellet was frozen in liquid nitrogen until histone preparation. We denote these lines as R10 standard lines to indicate that arginine residues in the proteins in these cells are labeled with stable isotopes to an additional 10 Da. All chemicals from Sigma-Aldrich unless otherwise noted.
Cancer Cell Line Encyclopedia cell lines
Sample cell lines were cultured in their recommended growth medium (without SILAC incorporation) using standard tissue-culture practices and stored at −80 °C until preparation.
Histone extraction and preparation for analysis
Frozen cell pellets from sample and R10 standard cell lines were thawed on ice. Histones were extracted from cells as previously described27. The resulting histones were resuspended in 50 μL HPLC-grade water, and the protein concentration was measured using the Coomassie Plus Protein Assay (Thermo Scientific).
Samples were derivatized in a manner highly similar to that previously reported28. The R10 standard mix of histones consisted of equal parts (by protein concentration) of R10-labeled HeLa, K562 and 293T histones. Sample histone (25 μg) was mixed with 25 μg of the R10 standard mix of histones and brought up to 100 mM sodium phosphate buffer (pH 8.0) in a total volume of 65 μL. NHS-propionate (195 μL; 400 mM; synthesized in-house) in anhydrous methanol was added by the Bravo liquid handling system (Agilent Technologies) with tip mixing for 30 min. Samples were desalted on an Oasis 30 mg HLB solid phase extraction plate (Waters, Milford, MA, USA). Samples were loaded and washed with 0.1% trifluoroacetic acid (TFA) and 20% acetonitrile (ACN) and eluted in 0.1% TFA and 60% ACN. The eluates were vacuum concentrated to dryness. Samples were proteolytically digested by 1 μg of sequencing-grade modified trypsin (Promega) per sample in 100 μL 50 mM ammonium bicarbonate at 37 °C. Samples were again vacuum concentrated to dryness. Samples were resuspended in 100 μL of 100 mM NHS propionate in anhydrous MeOH and 11 μL 20 mM phosphate buffer (pH 8.0) and incubated for 1 h with tip mixing. Samples were vacuum concentrated to dryness then desalted on a SepPak 100 mg C18 solid phase extraction plate (Waters). Samples were loaded and washed in 0.1% TFA and eluted in 0.1% TFA, 50% ACN. Eluates were once more vacuum concentrated to dryness before being resuspended in 50 μL 3% ACN 5% formic acid (FA) and diluted 1:10 before data acquisition.
Targeted LCMS data acquisition
Samples were chromatographically separated using a Proxeon Easy NanoLC 1000 (Thermo Scientific) fitted with a PicoFrit 75-μm inner diameter capillary packed in-house with ~200 mm of C18 Reprosil beads (1.9 μm particle size, 200 Å pore size, Dr. Maisch GmBH). The column was heated to 50 °C during separation. Buffer A, 0.1% FA and 3% ACN; Buffer B, 0.1% FA and 90% ACN. Samples were loaded in Buffer A and eluted with a linear gradient from 3–40% of Buffer B over 45 min, 40–90% Buffer B over 5 min and then held at 90% Buffer B for 10 min at 200 nL/min.
Eluted peptides were introduced into a Q-Exactive mass spectrometer (Thermo Scientific) via nanoelectrospray at 2.15 kV. A full-scan MS was acquired at a resolution of 35,000 from 300 to 1,800 m/z. Each full scan was followed by up to 17 scheduled, targeted HCD MS/MS scans. Each targeted peptide species was subjected to targeting for 3–20 min depending on the empirical chromatographic properties, centered on the average observed retention time of two scheduling runs containing synthetic peptides for many possible peptide/modification combinations on histone H3. See Supplementary Table 6 for an example schedule, including normalized HCD collision energies for each species. We attempted to quantify all of the species listed in Supplementary Table 6, but some could not be accurately quantified owing to the combination of insufficient chromatographic resolution and isobaric interferences at the fragment ion level (i.e., H3K27me3K36me2 and H3K27me2K36me3). The species listed in Supplementary Table 7 represent analytes that are confidently quantified and provide standard nomenclature and biochemical abbreviations for the peptide species that were monitored.
Data analysis
Files were imported into a Skyline29 document with targets for many possible combinations of peptides and modifications of peptides from H3. Transitions were chosen on the basis of selectivity for the given modification combinations and detectability. Each sample and modification was manually validated using the criteria of retention-time agreement with other samples and the co-eluting presence of all transitions. Heavy/light ratios were extracted on the basis of transition area integration using Skyline defaults. All ratios were normalized to the heavy/light ratio of the H3 41–49 peptide and log2 transformed. Data for each modification were normalized by the median of all samples before clustering. Clustering was performed in Gene-E using unsupervised hierarchical methods with the following methods: Euclidean distance metric, complete linkage, row and column clustering.
Antibodies for western blotting
NSD2 (H00007468-B01P, Abnova 1:1,500); H3K36Me1 (ab9048, Abcam 1:3,000); H3K36Me2 (07-369, Millipore 1:3,000); H3K36Me3 (ab9050, Abcam 1:3,000); H3K27Me1 (07-448, Millipore 1:3,000); H3K27Me2 (07-421, Millipore 1:500); H3K27Me3 (07-449, Millipore 1:2,000); γ-tubulin (Santa Cruz 1:500), H3K4Me1 (07-436, Millipore 1:1,000); H3K4Me2 (07-030, Millipore 1:2,500); H3K4Me3 (05-1339, Millipore 1:3,000); H3K9Me1 (ABE101, Millipore 1:2,500); H3K9Me2 (17-681, Millipore 1:1,000); H3K9Me3 (05-1242, Millipore, 1:500).
Statistical analysis
Two-class statistical analysis for CCLE features exhibiting differential profiles between the seven lines in Cluster D and the remaining cell lines was undertaken for each of ~19,000 mRNA expression and ~24,000 copy-number features1 using the Wilcoxon rank-sum test, and for ~2,700 mutation features using Fisher’s exact test. Nominal P values obtained were adjusted for multiple hypotheses using the Benjamini-Hochberg method, and features were considered statistically significant if the associated P value was ≤0.1.
For in vivo studies, one way ANOVA (Holm-Sidak method) was used to calculate significance among groups. To calculate the number of mice needed to show significant difference between treated and control groups (P < 0.05), the La Morte tool was used to determine that five mice per group will achieve statistical significance with a power of 90 (for a control group of mean tumor volume of 1,600 mm3 (s.d. = 300) and a treated group with mean tumor volume of 900 mm3 (s.d. = 300)).
Tumor xenograft study
Mice were housed in a temperature- and humidity-controlled animal facility with ad libitum access to food and water and acclimated for at least 3 d before manipulation. Xenograft models were generated by injecting 10 × 106 SEM-NTC or SEM-NSD2sh1 and Matrigel subcutaneously into the right flank of 7- to 8-week-old female SCID Beige mice (Harlan). Twenty-eight days after cell implantation, mice were randomly divided into two groups on the basis of tumor volume (mean volume 200–250 mm3) using a computer software (ABIVO) to ensure random distribution of tumor sizes in each group. No blinding was done after randomization. One group was fed a doxycycline diet (400 p.p.m.; PharmaServ) and the other group normal chow (n = 6 for the 2 NSD2 shRNA group and n = 5 for the 2 GFP shRNA group). Tumor volume was measured by caliper every 3–4 d and calculated as length × width2 × 0.52. Eighteen days after starting the doxycycline diet, mice were sacrificed and tumor samples were collected for PD marker analysis. Mouse studies were undertaken in accordance with the Novartis Institutes for Biomedical Research Animal Care and Use Committee protocols and regulations.
Detection of NSD2 somatic mutation in pediatric cancer
Detection of somatic sequence mutations using whole-genome or whole-exome sequencing data were described previously6. Structural variations were identified by CREST30. To enable detection of recurrent subclonal sequence mutations, we developed a custom program that searches the NGS BAM (the compressed binary version of the Sequence Alignment/Map (SAM) format) files for the presence of mutant allele at chr4:1976590 and chr4:1976590, which encode the D1125N and E1099K substitutions, respectively. The program records the number of unique reads that harbor high-quality (quality score >20) mutant allele at these two sites. Read counts from multiple DNA sequencing data sets for the same tumor (i.e., WGS, exome and custom-designed capture sequencing) were combined to improve sensitivity for detecting low-frequency variants. In addition, RNA-seq reads were analyzed to provide supporting evidence. In the current study, we required at least three DNA mutant reads or two DNA reads plus RNA-seq reads of all candidates. All putative variants were manually reviewed.
NSD2 structural variations in pediatric cancer
In addition to somatic sequence variations, we identified four structural variations in NSD2, including three intragenic deletions that remove exons 1–4 (two cases) or exons 1–5 (one case) of isoform 1 of NSD2 (GenBank NM_133330) and one with an interchromosomal rearrangement resulting in fusion of the 5′ UTR of ST6GAL1 on chromosome 3 with exon 1 of NSD2 on chromosome 4 (Supplementary Figs. 8 and 9). NGS of mRNA isolated from the diagnostic leukemic cells from the three ETV6-RUNX1 ALL cases that contain intragenic NSD2 deletions revealed the expression of transcripts that spliced an alternative first exon of the NSD2 (present only in isoform 10 of NSD2, GenBank NM_001042424) to exon 5 (two cases), or exon 6 (one case). These transcripts utilize an ATG contained within the alternative exon 1 and encode in-frame NSD2 proteins that lack an intact N-terminal PWWP domain (Supplementary Fig. 8a,b). These mutant NSD2 isoforms match one of the altered forms of NSD2 (MB4-2 II) detected in multiple myelomas, that results from a t(4;14)(p16;q32) (ref. 26). The single nonleukemic NSD2 mutation was detected in a case of low-grade glioma (LGG). In this case, a complex chromosomal rearrangement event occurring within the context of chromothripsis resulted in the fusion of the first exon of ST6GAL1 on chromosome 3 to exon 4 of NSD2 isoform 1. RNA-seq analysis revealed that the resultant NSD2 transcript is predicted to encode the wild-type NSD2 protein but with a different 5′ UTR (Supplementary Fig. 9).
Structural modeling of NSD2
A structural model for NSD2 SET domain was built by threading its sequence to the structure of the NSD1 SET domain (PDB 3OOI) using the automatic method in Swiss-Model31. The two set domains contain 77% identity between residues 979–1203 of NSD2 and residues 1855–2082 of NSD1. E1099 interaction with K1124 may be an artifact, as K1124 also participates in a crystal contact. Close inspection indicates the salt bridge between E1099 and K1124 could exist owing to the proximity of the two amino acids and electrostatic nature of the interaction. The modeled version of NSD2 is in an inactive auto-inhibited conformation. To model a histone bound to NSD2, the structure from the homologous protein GLP (PDB 3HNA), which contains an H3K9 peptide, was aligned to NSD2 using PyMOL (RMS = 1.2 Å over 134 Cα). There is overall agreement between I-SET domain of GLP and NSD2, which has been reviewed elsewhere32. To assess the reliability of the position of the modeled histone peptide in NSD2, several structural markers were used. Residue C1183 of NSD2 is directed toward the catalytic site and is thought to represent the structural location of a bound H3K36 (ref. 32). K9 from H3K9 in GLP partially overlaps with C1183 from NSD2 and approximates the location of H3K36 (ref. 32). The N-to-C-terminal directionality of the peptide is based on previous structures of SET domains with bound H3 peptides, which show the H3 modified lysine as buried in the SET domain and residues N-terminal to that lysine interacting with I-SET domain5. In addition, the amino acids on H3 between K36 and S31 are small and hydrophobic, and they are complementary to the hydrophobic residues that line the I-SET domain in NSD2 and would make favorable interactions. In addition, previous studies reported that H3 peptides directed toward the I-SET domain had a slight enrichment of serine and threonine residues32. This would be consistent with S31 and T32 being adjacent to the I-SET domain of NSD2. Structural alignments, alterations and graphics were generated using the ‘align’ and ‘mutation’ function in PyMOL version 1.3 (http://www.pymol.org).
Supplementary Material
ACKNOWLEDGMENTS
We thank R. Pagliarini and R. Tiedt for their critical comments on the manuscript, and the NIBR-BROAD CCLE team for their guidance and contributions to the CCLE project. KMS11-TKO cells were generously provided by Horizon Discovery Ltd., UK. We are grateful for the technical assistance of X. Liu. We thank the members of the St. Jude Children’s Research Hospital Washington University Pediatric Cancer Genome Project and the American Lebanese Syrian Associated Charities (ALSAC) of St. Jude Children’s Research Hospital for funding. The global chromatin profiling project was enabled by a grant from the Novartis Institutes for Biomedical Research. Additional funding support was provided by the National Cancer Institute and the U.S. Department of Defense (L.A.G.), the Pew Scholars Program in the Biomedical Sciences (C.M.) and the St. Baldrick’s Foundation Scholar Award (C.M.).
Footnotes
Note: Any Supplementary Information and Source Data files are available in the online version of the paper.
COMPETING FINANCIAL INTERESTS
The authors declare competing financial interests: details are available in the online version of the paper.
References
- 1.Barretina J, et al. The Cancer Cell Line Encyclopedia enables predictive modelling of anticancer drug sensitivity. Nature. 2012;483:603–607. doi: 10.1038/nature11003. [DOI] [PMC free article] [PubMed] [Google Scholar]
- 2.Peach SE, Rudomin EL, Udeshi ND, Carr SA, Jaffe JD. Quantitative assessment of chromatin immunoprecipitation grade antibodies directed against histone modifications reveals patterns of co-occurring marks on histone protein molecules. Mol. Cell. Proteomics. 2012;11:128–137. doi: 10.1074/mcp.M111.015941. [DOI] [PMC free article] [PubMed] [Google Scholar]
- 3.Ryan RJ, Bernstein BE. Molecular biology. Genetic events that shape the cancer epigenome. Science. 2012;336:1513–1514. doi: 10.1126/science.1223730. [DOI] [PubMed] [Google Scholar]
- 4.Morin RD, et al. Frequent mutation of histone-modifying genes in non-Hodgkin lymphoma. Nature. 2011;476:298–303. doi: 10.1038/nature10351. [DOI] [PMC free article] [PubMed] [Google Scholar]
- 5.Shih AH, Abdel-Wahab O, Patel JP, Levine RL. The role of mutations in epigenetic regulators in myeloid malignancies. Nat. Rev. Cancer. 2012;12:599–612. doi: 10.1038/nrc3343. [DOI] [PubMed] [Google Scholar]
- 6.Zhang J, et al. The genetic basis of early T-cell precursor acute lymphoblastic leukaemia. Nature. 2012;481:157–163. doi: 10.1038/nature10725. [DOI] [PMC free article] [PubMed] [Google Scholar]
- 7.McCabe MT, et al. Mutation of A677 in histone methyltransferase EZH2 in human B-cell lymphoma promotes hypertrimethylation of histone H3 on lysine 27 (H3K27) Proc. Natl. Acad. Sci. USA. 2012;109:2989–2994. doi: 10.1073/pnas.1116418109. [DOI] [PMC free article] [PubMed] [Google Scholar]
- 8.Sneeringer CJ, et al. Coordinated activities of wild-type plus mutant EZH2 drive tumor-associated hypertrimethylation of lysine 27 on histone H3 (H3K27) in human B-cell lymphomas. Proc. Natl. Acad. Sci. USA. 2010;107:20980–20985. doi: 10.1073/pnas.1012525107. [DOI] [PMC free article] [PubMed] [Google Scholar]
- 9.Yap DB, et al. Somatic mutations at EZH2 Y641 act dominantly through a mechanism of selectively altered PRC2 catalytic activity, to increase H3K27 trimethylation. Blood. 2011;117:2451–2459. doi: 10.1182/blood-2010-11-321208. [DOI] [PMC free article] [PubMed] [Google Scholar]
- 10.Ernst T, et al. Inactivating mutations of the histone methyltransferase gene EZH2 in myeloid disorders. Nat. Genet. 2010;42:722–726. doi: 10.1038/ng.621. [DOI] [PubMed] [Google Scholar]
- 11.Malgeri U, et al. Detection of t(4;14)(p16.3;q32) chromosomal translocation in multiple myeloma by reverse transcription-polymerase chain reaction analysis of IGH-MMSET fusion transcripts. Cancer Res. 2000;60:4058–4061. [PubMed] [Google Scholar]
- 12.Chesi M, et al. The t(4;14) translocation in myeloma dysregulates both FGFR3 and a novel gene, MMSET, resulting in IgH/MMSET hybrid transcripts. Blood. 1998;92:3025–3034. [PubMed] [Google Scholar]
- 13.Martinez-Garcia E, et al. The MMSET histone methyl transferase switches global histone methylation and alters gene expression in t(4;14) multiple myeloma cells. Blood. 2011;117:211–220. doi: 10.1182/blood-2010-07-298349. [DOI] [PMC free article] [PubMed] [Google Scholar]
- 14.Kuo AJ, et al. NSD2 links dimethylation of histone H3 at lysine 36 to oncogenic programming. Mol. Cell. 2011;44:609–620. doi: 10.1016/j.molcel.2011.08.042. [DOI] [PMC free article] [PubMed] [Google Scholar]
- 15.Li Y, et al. The target of the NSD family of histone lysine methyltransferases depends on the nature of the substrate. J. Biol. Chem. 2009;284:34283–34295. doi: 10.1074/jbc.M109.034462. [DOI] [PMC free article] [PubMed] [Google Scholar]
- 16.Qiao Q, et al. The structure of NSD1 reveals an autoregulatory mechanism underlying histone H3K36 methylation. J. Biol. Chem. 2011;286:8361–8368. doi: 10.1074/jbc.M110.204115. [DOI] [PMC free article] [PubMed] [Google Scholar]
- 17.Lauring J, et al. The multiple myeloma associated MMSET gene contributes to cellular adhesion, clonogenic growth, and tumorigenicity. Blood. 2008;111:856–864. doi: 10.1182/blood-2007-05-088674. [DOI] [PMC free article] [PubMed] [Google Scholar]
- 18.Mullighan CG, et al. Genome-wide analysis of genetic alterations in acute lymphoblastic leukaemia. Nature. 2007;446:758–764. doi: 10.1038/nature05690. [DOI] [PubMed] [Google Scholar]
- 19.Mullighan CG, et al. Genomic analysis of the clonal origins of relapsed acute lymphoblastic leukemia. Science. 2008;322:1377–1380. doi: 10.1126/science.1164266. [DOI] [PMC free article] [PubMed] [Google Scholar]
- 20.Seligson DB, et al. Global levels of histone modifications predict prognosis in different cancers. Am. J. Pathol. 2009;174:1619–1628. doi: 10.2353/ajpath.2009.080874. [DOI] [PMC free article] [PubMed] [Google Scholar]
- 21.Kurdistani SK. Histone modifications as markers of cancer prognosis: a cellular view. Br. J. Cancer. 2007;97:1–5. doi: 10.1038/sj.bjc.6603844. [DOI] [PMC free article] [PubMed] [Google Scholar]
- 22.Chervona Y, Costa M. Histone modifications and cancer: biomarkers of prognosis? Am. J. Cancer Res. 2012;2:589–597. [PMC free article] [PubMed] [Google Scholar]
- 23.McCabe MT, et al. EZH2 inhibition as a therapeutic strategy for lymphoma with EZH2-activating mutations. Nature. 2012;492:108–112. doi: 10.1038/nature11606. [DOI] [PubMed] [Google Scholar]
- 24.Qi W, et al. Selective inhibition of Ezh2 by a small molecule inhibitor blocks tumor cells proliferation. Proc. Natl. Acad. Sci. USA. 2012;109:21360–21365. doi: 10.1073/pnas.1210371110. [DOI] [PMC free article] [PubMed] [Google Scholar]
- 25.Kim JY, et al. Multiple-myeloma-related WHSC1/MMSET isoform RE-IIBP is a histone methyltransferase with transcriptional repression activity. Mol. Cell. Biol. 2008;28:2023–2034. doi: 10.1128/MCB.02130-07. [DOI] [PMC free article] [PubMed] [Google Scholar]
- 26.Marango J, et al. The MMSET protein is a histone methyltransferase with characteristics of a transcriptional corepressor. Blood. 2008;111:3145–3154. doi: 10.1182/blood-2007-06-092122. [DOI] [PMC free article] [PubMed] [Google Scholar]
- 27.Thomas CE, Kelleher NL, Mizzen CA. Mass spectrometric characterization of human histone H3: a bird’s eye view. J. Proteome Res. 2006;5:240–247. doi: 10.1021/pr050266a. [DOI] [PubMed] [Google Scholar]
- 28.Garcia BA, et al. Chemical derivatization of histones for facilitated analysis by mass spectrometry. Nat. Protoc. 2007;2:933–938. doi: 10.1038/nprot.2007.106. [DOI] [PMC free article] [PubMed] [Google Scholar]
- 29.MacLean B, et al. Skyline: an open source document editor for creating and analyzing targeted proteomics experiments. Bioinformatics. 2010;26:966–968. doi: 10.1093/bioinformatics/btq054. [DOI] [PMC free article] [PubMed] [Google Scholar]
- 30.Wang J, et al. CREST maps somatic structural variation in cancer genomes with base-pair resolution. Nat. Methods. 2011;8:652–654. doi: 10.1038/nmeth.1628. [DOI] [PMC free article] [PubMed] [Google Scholar]
- 31.Kiefer F, Arnold K, Kunzli M, Bordoli L, Schwede T. The SWISS-MODEL Repository and associated resources. Nucleic Acids Res. 2009;37:D387–D392. doi: 10.1093/nar/gkn750. [DOI] [PMC free article] [PubMed] [Google Scholar]
- 32.Schapira M. Structural chemistry of human SET domain protein methyltransferases. Curr. Chem. Genomics. 2011;5:85–94. doi: 10.2174/1875397301005010085. [DOI] [PMC free article] [PubMed] [Google Scholar]
Associated Data
This section collects any data citations, data availability statements, or supplementary materials included in this article.