

Abstract
The human papillomavirus (HPV) vaccines hold great promise for preventing several cancers caused by HPV infections. Yet little attention has been given to whether HPV could respond evolutionarily to the new selection pressures imposed on it by the novel immunity response created by the vaccine. Here, we present and theoretically validate a mechanism by which the vaccine alters the transmission–recovery trade-off that constrains HPV's virulence such that higher oncogene expression is favoured. With a high oncogene expression strategy, the virus is able to increase its viral load and infected cell population before clearance by the vaccine, thus improving its chances of transmission. This new rapid cell-proliferation strategy is able to circulate between hosts with medium to high turnover rates of sexual partners. We also discuss the importance of better quantifying the duration of challenge infections and the degree to which a vaccinated host can shed virus. The generality of the models presented here suggests a wider applicability of this mechanism, and thus highlights the need to investigate viral oncogenicity from an evolutionary perspective.
Keywords: human papillomavirus, virulence evolution, oncogenes, transmission–recovery trade-off, within-host model
1. Introduction
There is considerable excitement surrounding the human papillomavirus (HPV) vaccines due to their innovative virus-like-particle (VLP) technology and the very high efficacy rates found in clinical trials [1,2]. The HPV vaccine is hailed as a very effective preventive measure against the several cancers (cervical, penile, anal and head-and-neck) that are caused by this very common sexually transmitted virus. As HPV is a double-stranded DNA (dsDNA) virus, it is often argued that it is unlikely that escape mutants could evolve to evade the VLP-induced immunity against the virus's L1 surface protein, as is common in RNA virus evolution [2,3]. Lacking in these discussions of potential HPV vaccination response (vaccine escape or type replacement) is the idea that viruses can respond to vaccines by increasing their virulence [4,5]. An important example of which to note is the vaccine-induced evolution of Marek's disease virus (MDV), which is also a dsDNA oncovirus. Unexpectedly, MDV has evolved increased virulence and escape mutants in response to several vaccination campaigns [6,7]. Here, we heed this cautionary tale and are the first to investigate the potential of HPV to evolve higher virulence in response to the vaccine immunity.
In many infections, the within-host density of the infectious agent is the appropriate measure of virulence. For example, Antia et al. [8] define a lethal quantity of a parasite as a natural choice for the maximal level of virulence and they show that within-host dynamics select for a quantity that is just below lethal. However, HPV is mostly avirulent and asymptomatic, and is carried at low within-host densities. Only after several years of persistence do HPV infections become deadly by the transformation of host cells that have become malignant after the infection has stopped being productive for the virus [9,10]. Thus, the classic definition of virulence as a consequence of high nearly lethal parasite dose as a strategy that benefits the virus does not readily apply to natural HPV infections.
Defining HPV's virulence requires understanding the selection pressures that shape less virulent pathogens and, specifically, oncoviruses. HPV exists as dozens of different types (i.e. strains) with differing pathologies; the most clinically relevant being the high-risk (HR) types that have oncogenes (E5, E6 and E7) that interfere with the cell's growth cycle [11]. Despite the cancer-centric name, the main function of the oncogenes is to stimulate cell cycle re-entry in the mid-epithelial layers in order to allow genome amplification [11]. As a result, the virus cannot replicate without the oncogenes. There are two main additional beneficial functions of these genes in HR types. First, the oncogenes interfere with the innate immune system (e.g. inhibition of interferon synthesis and receptor signalling [11,12]), thus delaying the activation of the adaptive immune response [13]. Second, the oncogenes inactivate the host's cell cycle regulators (proteins p53 and pPB) in order to stimulate cell proliferation [14]. This increases the number of infected cells without having to infect new cells or to increase the intrinsic replication rate of the virus. Both of these oncogene functions improve the chances of transmission by increasing the duration of the infection and by increasing the amount of viruses transmitted per host-to-susceptible contact. Nevertheless, it has been found that these oncogenes are not expressed at high levels during acute infections because the early viral protein E2 suppresses oncogene expression [10,15]. If the oncogenes are very beneficial, then why are they not expressed in higher quantities?
It is believed that the cost of stimulating the growth of a large density of infected cells is rapid detection by the immune system. Indeed, low-risk (LR) types that create genital warts are cleared faster than HR types [11,16], because most HR lesions are initially flat and inconspicuous, and only with time does the extra cell proliferation they induce become notable to immune agents [11]. Clearance after immune detection, then, appears to be a major factor affecting HPV's life history. Therefore, we and Orlando et al. [16] believe that the main trade-off that affects this virus is the transmission–recovery trade-off [17,18], and not the classic transmission–virulence trade-off that constrains more virulent pathogens [16] (we are unaware of studies that suggest the contrary). The transmission–recovery trade-off posits that host recovery is the main limitation on pathogen replication because if recovery happens before transmission, then the pathogen's basic reproduction number R0 is less than 1 and it cannot persistently circulate. Generally, the transmission–recovery trade-off is believed to be the main selection pressure constraining less virulent pathogens [17].
Vaccinated hosts are a new environment in which the vaccine-induced immune response will act as a strong, novel selective pressure. A unique feature of the immunity induced by the HPV vaccines is that it triggers a large antibody response, one that is at least two orders of magnitude larger than the natural response [19]. Also distinct from natural immunity is the duration of infection. Vaccine efficacy trials have shown that 99% of vaccinated hosts clear challenge infections with targeted types within six months [20]. We postulate that since the immune response in vaccinated hosts will always be triggered by memory cells and will always mount quickly, then the current ‘lay low’ strategy that HR vaccine-targeted types use to stay longer inside a host ceases to be effective. We investigated whether altering the transmission–recovery trade-off in vaccinated hosts could drive vaccine-targeted HR types to increase their virulence by changing their oncogene production. Using an evolutionary ecology modelling approach, we find that, indeed, higher oncogene expression is favoured in vaccinated hosts, which subsequently increases the chances of transmission before clearance by the vaccine.
2. Material and methods
We developed a within-host model to represent an HPV infection in an unvaccinated host, which was then modified to represent a vaccinated host. These models were then linked to epidemiological functions (similar to [8,17,21]) because selection pressures happen at both the within- and between-host levels. Note that parameter estimates for both within- and between-host models were taken from the literature (tables 1 and 2).
Table 1.
Within-host parameter estimates. The vaccine parameters ωvac and δvac were set to be 100 times [19] the unvaccinated estimates listed in this table.
| parameter |
estimate | references | |
|---|---|---|---|
| ψ | infection rate of uninfected cells | 0.0067 d−1 | [22] |
| μ | death rate of cells | 0.048 d−1 | [23] |
| k | burst size | 1000 virions/cell | [23] |
| ω | proliferation rate of CTL | 0.001 d−1 | [24] |
| a | killing rate of CTL | 0.01 d−1 | [25] |
| δ | decay rate of free virions | 0.05 d−1 | [26] |
| r | self-division rate of infected cells | 0.1 d−1 | fixed |
| N | total population of available cells | 10 000 | fixed |
| ϕ | half-growth constant | 106 | fixed |
Table 2.
Sexual behaviour groups and between-host parameters from literature.
| group | average number of partners year−1 | rates (in days) | references | comments |
|---|---|---|---|---|
| long partnerships | 1 |
ρ = 0.0027 σ = 0.0004 m = 0.356 |
[27,28] [29] [30,31] |
e.g. marriage/common-law, serial monogamy partnership lasts 6 years |
| short partnerships | 2–5 |
ρ = 0.0096 σ = 0.05 m = 0.43 |
[28] median [32] [33] |
e.g. dating considered dissolution within 20 days to 12 weeks |
| casual relationships | 6–8 |
ρ = 0.019 σ = 0.1 m = 0.43 |
[34] median [29] [33] |
e.g. single, dating, hook-ups dissolution within 10 days 3 per week |
| superspreader | 20+ |
ρ = 0.068 σ = 0.44 m = 1.44 |
[27] [30] [35] |
e.g. sex workers, bathhouse frequenters, etc. dissolution within 2.3 days estimate 11 per week for 48 weeks |
(a). Within-host models
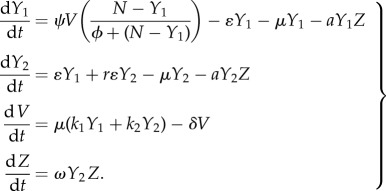
The population of free virions, V, come into contact with uninfected cells, X, and infect them at a rate ψ, making infected cells Y1. See the electronic supplementary material, appendix, for the reduction that allows us to not explicitly include X in the model. The first term of Y1 encapsulates the creation of newly infected cells by the interaction of uninfected cells with free virions, where N represents the total population of all epithelial cells and ϕ is a half-growth constant. The infected cells can either continue their life cycle or they can become self-proliferating cells, Y2. These cells have a higher expression of the oncogenes E6 and E7, which drive the cells to divide more in the mid-layer of the epithelium before terminating and dying. Let ɛ represent the rate of oncogene expression of the HPV type once in an infected cell. The rate of oncogene expression controls the conversion of Y1 cells into becoming self-proliferating cells Y2. Self-proliferating infected cells grow at a rate rɛ, proportional to their own density, and are dependent on oncogene expression (i.e. the higher the oncogene expression, the more cell division). Both types of infected cells contribute to the overall population of free virions (V) by differing virion production rates, ki. As HPV is a non-lytic virus, both kinds of infected cells die at the same rate μ, and their viral production rates are adjusted by the infected cell death rate, μki. Free virions are cleared at a rate δ and the antibody response is captured implicitly by this viral clearance rate.
Finally, we assume that the cytotoxic T-cell (CTL) response, Z, is only initiated by the growth of Y2 and proliferates at a rate ω. The reason for this is twofold. First, HPV infection is exclusively intraepithelial, which causes no viremia and also hides antigen [11]; therefore extra cell growth is a signal to the immune system that something is wrong [11,16]. Second, the cell-mediated response needed for clearance is predominantly against the oncogene E6 [12,13,36]. Note that for simplicity we assume that the CTL kills both groups of infected cells with equally efficiency, with the killing rate a. Altogether then the unvaccinated host model is
 |
2.1 |
It should be noted that we considered a simpler model with only one infected cell population, and we also considered differential CTL killing rates (see the electronic supplementary material, appendix).
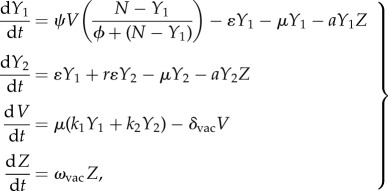
In order to represent vaccinated hosts, several changes were made to this model: (i) the vaccine causes a strong antibody response, therefore, δ is increased to δvac; (ii) proliferation of the CTL is now initiated by the vaccine-created memory response, not the innate response, so only a very small amount of virus present (in Y1, Y2 or V) will trigger the memory response targeting L1 epitopes to activate the adaptive response to invade, thus changing the Z equation and Z's initial conditions; (iii) the antibodies that flood the infection site help prevent newly produced free virions from infecting new cells, thus δvac scales down the infection rate of new cells, ψ. Together, this gives the model for a vaccinated host,
 |
2.2 |
where Z0 is now set to a value that initiates the Z equation once the infection is started. This is equivalent to having a very low threshold, such that a very small amount of the virus triggers the response, which is equivalent to being triggered by the mere presence of the virus, and not viral growth dependent as it is in the unvaccinated host (see [37] and references therein). The CTL in a vaccinated host proliferate at a higher rate, ωvac.
(b). Within-host viral fitness
Viral load is a measure of the virus's reproductive output inside a particular host environment. The total amount of virus it is able to produce during the course of the infection represents the fitness of the virus for that particular within-host environment. We are interested to see how oncogene production changes viral output, so we want to determine the optimal oncogene strategy, ɛ*, which is defined as the oncogene expression that maximizes the total viral output of a host. To determine this, we first find the total viral output Vtotal of a host [38], by finding the integral of the viral load curve V,
| 2.3 |
then, we find the maximum with respect to ɛ, which gives ɛ*. We can then compare the ɛ* selected for in distinct within-host environments (vaccinated versus unvaccinated). Note that because the model cannot be solved analytically, equation (2.3) was computed numerically, which is also true for the equations that follow. The maxima were computed numerically using the function NMaximize in Mathematica.
(c). Transmission and between-host fitness
Next, we consider the effects of transmission. An optimal strategy at the within-host level might not be optimal for between-host transmission [39]. We consider, then, linking these within-host models to a transmission function that represents the relationship between viral load and transmission (similar to [8,21]). We considered a linear but scaled down rate of transmission, where 0 < α < 1:
| 2.4 |
As HPV is for the most part avirulent (virus producing almost no mortality), we equate the reproduction number R0 to the number of new infections caused by an infected host before clearing the virions (similar to [38]). To find an expression for R0, we consider an equation that represents the number of hosts infected by the focal infected individual
| 2.5 |
where m is the rate of sexual acts, g(t) is the probability that the partner is susceptible given a sex act, and β(t) is the probability of transmission given a sex act with a susceptible partner. From this equation, we get an expression for the total number of infected hosts an individual can cause, such that
| 2.6 |
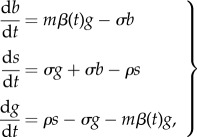
We include ɛ as we are interested in how oncogene expression can affect the R0 of the infected host. It is important to consider g(t) because humans are fairly monogamous, so transmission to a new host happens only after switching to a new sexual partner, the chance of which goes up in time. This changes the value of each contact event putting more weight on later sexual contacts. Thus, the state of partnership affects transmission of a sexually transmitted pathogen like HPV. We modelled g(t) explicitly using a model of three different states that the infected individual can be in with respect to sexual partnerships,
 |
2.7 |
where ρ is the rate of new partner acquisition and σ is the rate of partner break-up. Here, g(t) is the probability the individual is in a partnership with a susceptible, s(t) is the probability of them being single and b(t) is the probability that their partner is also infected. Note that a host can only be in one of these states and thus at any given time g(t) + s(t) + b(t) = 1. The initial conditions were {b,s,g} = {1,0,0}. The focal host, then, begins by being in a partnership with the host who gave them the infection, and then we assume that they become single before forming a new partnership, b → s. We assume that the host does not form partnerships with hosts that have the same infection. At rate m β(t)g, the focal host infects their new partner and they, again, are in a partnership with an infected host, g → b. An analytic solution for g(t) is not easily found because  is non-autonomous, and so g(t) was calculated numerically.
(d). Host heterogeneity: immune status
HPV vaccine efficacy in immunocompetent patients is very high, where most vaccinated individuals clear challenge infections within six months [40]. The effect of the HPV vaccine in immunocompromised patients should be diminished, and overall the strength of the immune response will vary among individuals. It is believed that immunocompromised patients can build a vaccine-induced humoral response because the HPV VLPs used in the vaccine are highly immunogenic [41]. For instance, HIV-positive men without low CD4+ counts have shown to successfully seroconvert after vaccination [42], though at lower titres than HIV-negative patients [43,44]. Immunocompromised individuals with low CD4+ counts or B-cell deficiencies will have trouble building the adaptive response needed to clear the HPV infection, and so, at the very least, vaccinated immunocompromised patients should clear a challenge HPV infection slower than vaccinated immunocompetent patients. Unfortunately, HPV vaccine efficacy and immunological studies in immunocompromised patients are few [43]. Here, we considered how impairment to the adaptive response affects the results by investigating results when CTL proliferation rates ω and the initial densities of CTL were one order of magnitude lower than the parameter estimate and initial conditions of the natural case considered.
(e). Host heterogeneity: sexual behaviour
Sexual behaviour varies between hosts and with age. The host's sexual partnership switching behaviour is important to the transmission of the virus. Hosts that are celibate or do not change sexual partners within the duration of the infection are ‘dead ends’ for the virus, signifying that the R0 of that individual is less than 1, and thus only the formation of a new partnership can lead to transmission [45]. We classified sexual behaviours into four groups (table 1): ‘long partnerships’ represent individuals who are in long-term serial monogamous relationships; ‘short partnerships’ have on average two to five partners per year; ‘casual relationships’ have even higher partner turnover; and ‘superspreaders’, such as sex workers, have 20+ partners per year. Partner acquisition, break-up and sex act rates were obtained from the literature for these groups, and all these rates increase with increased partnership turnover (table 1). Also note that the per-partnership transmission probability is 0.6 for HPV [46], and its R0 is 2, though higher for core-group individuals (e.g. superspreaders) [47].
3. Results
(a). Unvaccinated host results
The viral immunity dynamics were represented using a within-host model. For various values of oncogene expression, the unvaccinated model shows that CTL invasion is triggered if the virus drives many infected cells to divide quickly, thus shortening the duration of the infection (figure 1). The model, then, captures the recovery constraint that we expect. The amount of oncogene expression that is favoured under this constraint is the one that generates the maximal viral output within the duration of the infection (maximum of Vtotal, equation (2.3)). For an infection of 1.5 years (HPV-16 is cleared between 0.5 and 4.9 years [48] and on average before 2 years) we find that the optimal oncogene expression, ɛ*, is below 0.2 (figure 3a). This model thus depicts the HR HPV type strategy of producing few extra self-dividing infected cells in order to have lesions that are fairly flat on the surface during acute infections [16].
Figure 1.

Time-series of unvaccinated within-host model for various oncogene expression levels. Warm to cool colours represent time-series runs for different ɛ values from 0 to 1. Lower ɛ gives slower growth of Y1 and Y2 (e.g. orange–red). Note that Y1 and Y2 infected cells produce the V curves. The invasion of Z is delayed at lower levels of ɛ; thus faster growth of Y2, due to higher ɛ, leads to faster clearance.
Figure 3.

Unvaccinated host plots. (a) Vtotal of both immunocompetent and immunodeficient hosts. The ɛ* that is selected for by within-host processes is low, which demonstrates that recovery is the cost to rapid growth inside the host. Immunodeficient hosts can select for a slightly higher optimal oncogene expression. Unvaccinated immunodeficient parameters: ω = 0.0001, Z0 = 10−5. (b) R0 with respect to oncogene expression for various sexual behaviours. Immunocompetent only. Superspreaders (yellow) and individuals with casual partnerships (purple) have higher R0 values (maximum) above the average (short partnerships, red), and individuals with long partnerships (blue) are below 1. Including the sexual behaviour model does not change the ɛ* away from the within-host optimal, thus all three groups select for the same ɛ*. Vaccinated host plots. (c) Vtotal of both immunocompetent and immunodeficient hosts. No maximum is achieved, instead higher oncogene expression allows for higher viral loads. Immunodeficient hosts have steeper curves implying they reach higher viral loads with lower ɛ values. Vaccinated immunodeficient parameters: ω = 0.01, Z0 = 10−5. (d) R0 with respect to oncogene expression for various sexual behaviours. Immunocompetent only. The ɛ-values where the curves cross R0 = 1 is the minimum value of ɛ needed for the virus to circulate,  . Superspreaders need a lower oncogene expression
  to maintain circulation of the virus than casual and short partnerships (higher
  on purple and red curves, respectively). Long partnerships (blue) do not rise fast enough to cross R0 = 1.
After calibrating the free parameter α to be 6 × 10⁻⁶ such that the short partnership group had an R0 of 2 [47], we then estimated the R0 of the other sexual behaviour groups. The R0 was 2.9 for the casual group, less than 1 for the long partnership group and 9.3 for superspreaders (figure 3b), which is realistic though a bit low considering the high partnership turnover rates of superspreaders.
(b). Vaccinated host results
Unlike the unvaccinated host, the vaccinated within-host environment does not select for low oncogene expression. Instead, oncogene expression can be very high since the total viral load, Vtotal, grows monotonically with higher ɛ values (figure 3c), suggesting that the cost of growth via cell division is removed in vaccinated hosts. For strains with low oncogene expression strategies, the total viral output is sufficiently low that the vaccine is able to clear them effectively (see figure 2, where Y1, Y2 and V decay to zero for ɛ values below 0.7), suggesting that a high antibody response is an effective method to decrease viral replication. However, for higher ɛ this no longer holds, and the exponential growth of Vtotal (ɛ > 0.7; figure 3c) can be explained by figure 2, where the Y1, Y2 and V curves grow before clearance. Therefore, higher ɛ-driven growth allows the virus to produce a high viral load before the inevitable clearance by the vaccine. Note also that vaccinated immunodeficient hosts with high ɛ (ɛ > 0.5) produce higher viral loads than vaccinated immunocompetent hosts with the same ɛ (figure 3c). As another measure of virulence, comparing the populations of Y2 cells shows that vaccinated hosts have fewer Y2 cells than the unvaccinated host for ɛ < 0.9; however, for ɛ > 0.9 the Y2 populations in vaccinated hosts reach a higher peak (compare Y2 curves in figures 1 and 2).
Figure 2.

Time-series of vaccinated within-host model for various oncogene expression levels. At lower levels of oncogene expression, the virus is cleared effectively by the CTL (decay of Y1, Y2 and V for ɛ < 0.7), but if higher, then viral load increases due to an increase in self-dividing infected cells. Note that Z appears at the same time regardless of oncogene expression. The range of ɛ shown is from 0 to 1.2.
We determined the between-host fitness of the higher ɛ strategies by checking that the viral loads are high enough for transmission within a population (equation (2.6)). As there is no longer a maximum in the vaccinated host that defines the optimal oncogene expression, we instead determine where R0 = 1 and define  as the oncogene expression necessary for a strain to persist in a population (figure 3d). We find that the R0(ɛ) curve of the long partnership group does not reach R0 = 1 within any reasonable ɛ-value, implying that even with very high viral loads, there is not enough partner-switching to allow for transmission within the infection window. The other three groups (short, casual and superspreaders) do reach R0 = 1 when ɛ = 3.3, 1.6 and 1.3, respectively (figure 3d). We find that the shape of the vaccinated R0(ɛ) curve rose for higher values of ɛ, which is not possible in unvaccinated hosts because of the transmission–recovery trade-off (compare figure 3b and 3d). This implies that removing the ability of the virus to delay effector cell invasion allows types with higher oncogene expression to have R0 values higher than 1, and thus can spread in the population. Consequently, the vaccine lifts the constraint that is most likely keeping HPV virulence low. Finally, comparing figure 3a and 3c, this shows that in vaccinated immunocompetent superspreaders, this new ɛ strategy requires a lower minimum viral load of less than 10 [7] for persistent transmission.
As the vaccine's main response is humoral, we considered how increasing the strength of the antibody response affected  . In figure 4a, we see that as δvac is increased to 100 times the natural antibody clearance rate, higher
  is needed for a strain to persist. Thus, the vaccine response selects for high oncogene expression. The strains in the shaded regions that are above all three curves have ɛ-values above
  and could out-compete strains with lower
  because they can circulate in all three kinds of hosts (figure 4a). In figure 4b, we plotted the derivative at
  for different strengths of the humoral response (for increasing δvac) as a measure of the strength of the selection for
  . Selection for
  is faster when the humoral response is weaker (δvac < 1) and it is also faster in immunodeficient hosts (figure 4b), suggesting that immunodeficient patients provide a better environment for the emergence of more virulent strains.
Figure 4.
Effect of vaccine humoral response on optimal epsilon. Sexual behaviour groups: superspreaders (yellow), casual (purple) and short (red). (a) The oncogene expression needed for persistent circulation,  , with respect to the strength of the antibody response, δvac. Generally,
  increases with a stronger humoral response. Note that above each line are ɛ values that can also circulate (with R0 values more than 1). (b) The derivative at
  for various δvac. The strength of selection for higher epsilon is stronger in immunodeficient hosts (dashed lines) in both casual and superspreader groups. Higher δvac implies slower selection towards
  . (c) The effect of vaccine-induced clearance time on optimal epsilon. Each line represents the oncogene expression needed for persistent circulation,
  , in a particular sex group, thus the shaded region above represents ɛ values that have R0 values higher than 1. The oncogene expression needed for
  in the vaccinated host depends on how quickly vaccine-induced clearance happens. At Z0 = 10−4, the vaccinated host sheds virus for about 150 days, and at Z0 = 1 the vaccinated host shed the virus for 50 days. For all three sexual behaviour groups, if the challenge infection is cleared quickly (high Z0) then a higher
  is favoured, but if the infection is cleared in under 50 days then even high oncogene expression cannot help the virus from escaping the vaccine.
Note that the long partnership group is not included in the analysis in figure 4 because this group does not reach R0 = 1 (as explained above). This implies that hosts engaged in longer partnerships and who have contracted a challenge infection lasting up to 150 days have R0 < 1. These hosts, then, do not contribute to the persistent circulation of strains with higher oncogene expression.
Finally, figure 4c shows how the duration of infection in a vaccinated host affects the  . High initial Z-values, Z0, equate to faster invasion by the adaptive response. As the duration of the infection shrinks due to the faster clearance by CTL, a higher
  is needed for persistence. Note, however, that if the CTL invasion happens within 50 days (Z0 > 1), then the vaccine is able to clear all infections in all groups, regardless of the level of oncogene expression.
4. Discussion
The evolutionary responses of viruses to vaccines are of serious concern, and they may appear several years after the introduction of such control measures [49]. In a review, Read & Mackinnon contrast successful vaccines that stimulate natural immunity with novel vaccines that stimulate new responses that differ considerably from natural immunity. They warn that imposing new effector mechanisms can create very different selection pressures, with potentially unwanted consequences [5]. Our findings appear to coincide with this scenario, in that the novel vaccine immunity favours increased virulence in order to allow for transmission during the short window of time before vaccine-induced clearance.
The HPV vaccines change the within-host ecology encountered by the virus in three main ways. First, the vaccine-targeted types experience a strong antibody response that is unnaturally high [44], and which we find drives the oncogene expression necessary for persistent circulation up further. Second, the vaccine-induced effector cells invade faster, and invasion can no longer be delayed through strategies using slow viral replication and signalling interference. We show that this effect changes the transmission–recovery trade-off such that low oncogene expression strategies are no longer favoured.
Finally, the vaccine adaptive response now exclusively targets epitopes of the capsid protein L1 [44], which is distinct from natural responses that target the early proteins, E2, E6 and E7, for clearance [13,36]. As the L1 is a late gene whose epitopes are expressed in the upper layers of epithelium or are exposed on the capsids [11], the vaccine-induced effectors will mainly target free virions and these terminating cells. However, infected cells of the mid- and lower levels of the epithelium express the early proteins, and so should be targeted less readily by the vaccine response. Though this detail is not present in our models, we expect that it could augment the effect we found by selecting against the re-infection strategy and favouring the self-proliferation strategy. In this new environment, variants of the vaccine-targeted types exhibiting higher than average cell proliferation would have an advantage.
Discussions of HPV evolutionary responses have been scant and have focused on the potential of L1 neutralization escape [50]. We believe that we are the first to suggest this kind of evolutionary response in HPV types targeted by (or cross-reactive with) the vaccine. The main form of vaccine ‘leakiness’ that has been addressed in the HPV literature is that of type specificity and whether it can result in type replacement [51,52]. A ‘leak’ that has not been considered, and what we find here to be important, is what happens when the vaccine does not block infection and viral shedding. Given that challenge infections by vaccine-targeted types were detectable in vaccinated women [40] during HPV vaccine trials, we argue that the vaccine does not always fully block viral shedding. Indeed, a humoral response may not always provide perfect protection from viral challenge [53]. As HPV is transmitted mechanically through the shedding of both free virions and dead infected keratinocytes from the epithelial surface [54], it is possible that even if the antibody response lowers the free virion population significantly, a vaccinated host could still transmit the virus by shedding infected keratinocytes. For comparison, consider once again the oncogenic MDV example in which shedding of epithelial cells was also involved in transmission. Indeed, the MDV vaccines are leaky because they do not block infection and viral shedding (though this leak is more pronounced compared with the HPV vaccine's stronger prophylactic effect), which has played an important role in the subsequent virulence evolution of MDV [6,7]. In light of this, we strongly encourage studies of challenge infections in vaccinated hosts, their frequency, their duration and to what degree they shed infected cells. Cross-sectional epidemiological studies or longitudinal time-points separated six months apart will often lack the resolution to address these questions, especially if the challenges are short-lived.
Our model assumes that the high antibody response is instantaneous (δvac is a constant), and thus it captures the prophylactic effect of high neutralizing antibody titres the vaccine is intended to create. Locally, however, there should be lower levels of neutralizing antibodies (e.g. in cervicovaginal secretions) [13] and there should be a lag from the time of first challenge until the memory B cells induce antibodies and the subsequent cellular response invades at full force. We have not seen empirical estimates of how many days this takes, though their timing could have considerable consequences on the evolution of the virus and its transmission.
To demonstrate the essential ingredients of the phenomenon, our conceptual model had to idealize the viral replication process by neglecting many of its known details. So, although we demonstrate that virulence evolution is possible, we cannot determine with this study whether it is probable. It has been argued that accelerated carcinogenesis is not adaptive because cells in higher-grade lesions do not produce fully assembled virions [2]. However, given that animal models can be infected with DNA plasmids to produce robust, productive infections [55,56], how infectious are keratinocytes containing HPV DNA? Even if cancer cells themselves are not infectious, how infectious are the cells in the lesions leading up to cancer? Experiments are needed to assess to what degree oncogene expression can rise while maintaining viable viral production, infectiousness and transmission. Furthermore, following several challenges to the prevailing view of slow dsDNA virus evolution (where mechanisms such as recombination are possible [57–61]), there is a need for more direct investigations into the evolutionary potential of HPV variants.
In a recent study, Orlando et al. [16] found that HR types are best suited for transmission in long partnerships (because HR infections last longer), while shorter partnerships with higher turnover rates allow for the persistence of LR types (because LR types are cleared faster). We show here that by artificially shortening the infection duration, targeted HR types can more strongly adopt the strategy of cell proliferation (a strategy that was costly in natural conditions) in order to increase their chance of transmission, thus adopting a similar strategy to LR types. Yet oncogenes of HR types have stronger cell-transforming abilities, and expression at higher levels should more readily cause cellular genetic instabilities and lead to faster progression towards cancer.
Our study does not contain a full population model of interacting hosts, so we cannot investigate the conditions needed for a host population to maintain an emergent vaccine-adapted type. Heterogeneity of hosts plays an important role in the emergence of strains [62], and indeed we found variation in the optimal oncogene expression required of the virus to persist in different sexual activity groups. For instance, superspreaders required lower viral loads for persistent transmission, and in a highly sexually active core group this could favour the emergence of a variant with higher oncogene expression. Emergence happens in stuttering transmission chains, potentially in small groups of individuals, and certain host groups are more likely to be carriers and superspreaders [63–65]. Therefore, future studies should consider how pockets of core-group individuals (the causal and superspreader groups in this study) or of immunodeficient individuals may contribute to the emergence and circulation of new variants.
In conclusion, the uniqueness of the HPV vaccines lies in that they target a virus that is avirulent for the majority of hosts but has strong cell transformation properties. Other oncoviruses have similar features to HPV, making it likely that this vaccination programme may be emulated in the future. Given that virulence is not a fixed trait in any pathogen, it is in our best interest to understand how we are changing the ecological landscape and the selection pressures acting on the virus, in order to more confidently declare a vaccine's evolutionary robustness.
Supplementary Material
Acknowledgements
C.L.M. would like to thank Max Puelma-Touzel and Gabriel Gellner for very helpful technical discussions. Many thanks to Lindi Wahl and Samuel Alizon for critically reviewing the manuscript.
Funding statement
We acknowledge CIHR for funding.
References
- 1.Barr E, Sings HL. 2008. Prophylactic HPV vaccines: new interventions for cancer control. Vaccine 26, 6244–6257. ( 10.1016/j.vaccine.2008.07.056) [DOI] [PubMed] [Google Scholar]
- 2.Schiller JT, Lowy DR. 2012. Understanding and learning from the success of prophylactic human papillomavirus vaccines. Nat. Rev. Microbiol. 10, 681–692. ( 10.1038/nrmicro2872) [DOI] [PMC free article] [PubMed] [Google Scholar]
- 3.Halpern AL. 2000. Comparison of papillomavirus and immunodeficiency virus evolutionary patterns in the context of a papillomavirus vaccine. J. Clin. Virol. 19, 43–56. ( 10.1016/S1386-6532(00)00127-X) [DOI] [PubMed] [Google Scholar]
- 4.Gandon S, Mackinnon MJ, Nee S, Read AF. 2001. Imperfect vaccines and the evolution of pathogen virulence. Nature 414, 751–756. ( 10.1038/414751a) [DOI] [PubMed] [Google Scholar]
- 5.Read AF, Mackinnon MJ. 2008. Pathogen evolution in a vaccinated world. In Evolution of health and disease (eds Stearns SC, Koella JC.), pp. 139–153. Oxford, UK: Oxford University Press. [Google Scholar]
- 6.Nair V. 2005. Evolution of Marek's disease: a paradigm for incessant race between the pathogen and the host. Vet. J. 170, 175–183. ( 10.1016/j.tvjl.2004.05.009) [DOI] [PubMed] [Google Scholar]
- 7.Atkins KE, Read AF, Savill NJ, Renz KG, Islam AFMF, Walkden-Brown SW, Woolhouse MEJ. 2012. Vaccination and reduced cohort duration can drive virulence evolution: Marek's disease virus and industrialized agriculture. Evolution 67, 851–860. ( 10.1111/j.1558-5646.2012.01803.x) [DOI] [PubMed] [Google Scholar]
- 8.Antia R, Levin BR, May RM. 1994. Within-host population dynamics and the evolution and maintenance of microparasite virulence. Am. Nat. 144, 457–472. ( 10.1086/285686) [DOI] [Google Scholar]
- 9.Koshiol J, Lindsay L, Pimenta JM, Poole C, Jenkins D, Smith JS. 2008. Persistent human papillomavirus infection and cervical neoplasia: a systematic review and meta-analysis. Am. J. Epidemiol. 168, 123–137. ( 10.1093/aje/kwn036) [DOI] [PMC free article] [PubMed] [Google Scholar]
- 10.Zur Hausen H. 2002. Papillomaviruses and cancer: from basic studies to clinical application. Nat. Rev. Cancer 2, 342–350. ( 10.1038/nrc798) [DOI] [PubMed] [Google Scholar]
- 11.Doorbar J, Quint W, Banks L, Bravo IG, Stoler M, Broker TR, Stanley MA. 2012. The biology and life-cycle of human papillomaviruses. Vaccine 30(Suppl. 5), F55–F70. ( 10.1016/j.vaccine.2012.06.083) [DOI] [PubMed] [Google Scholar]
- 12.Stanley M. 2008. Immunobiology of HPV and HPV vaccines. Gynecol. Oncol. 109, S15–S21. ( 10.1016/j.ygyno.2008.02.003) [DOI] [PubMed] [Google Scholar]
- 13.Stanley M. 2010. HPV—immune response to infection and vaccination. Infect. Agent. Cancer 5, 19 ( 10.1186/1750-9378-5-19) [DOI] [PMC free article] [PubMed] [Google Scholar]
- 14.Doorbar J. 2005. The papillomavirus life cycle. J. Clin. Virol. 32(Suppl.), S7–S15. ( 10.1016/j.jcv.2004.12.006) [DOI] [PubMed] [Google Scholar]
- 15.Graham SV. 2006. Late events in the life cycle of human papillomaviruses. In Papillomavirus research: from natural history to vaccines beyond (ed. Campo S.), pp. 193–212. Wymondham, UK: Caister Academic Press. [Google Scholar]
- 16.Orlando PA, Gatenby RA, Giuliano AR, Brown JS. 2012. Evolutionary ecology of human papillomavirus: trade-offs, coexistence, and origins of high-risk and low-risk types. J. Infect. Dis. 205, 272–279. ( 10.1093/infdis/jir717) [DOI] [PMC free article] [PubMed] [Google Scholar]
- 17.Alizon S. 2008. Transmission-recovery trade-offs to study parasite evolution. Am. Nat. 172, E113–E121. ( 10.1086/589892) [DOI] [PubMed] [Google Scholar]
- 18.Anderson RM, May RM. 1982. Coevolution of hosts and parasites. Parasitology 85, 411–426. ( 10.1017/S0031182000055360) [DOI] [PubMed] [Google Scholar]
- 19.Schiller JT, Castellsagué X, Villa LL, Hildesheim A. 2008. An update of prophylactic human papillomavirus L1 virus-like particle vaccine clinical trial results. Vaccine 26(Suppl. 1), K53–K61. ( 10.1016/j.vaccine.2008.06.002) [DOI] [PMC free article] [PubMed] [Google Scholar]
- 20.Paavonen J, et al. 2009. Efficacy of human papillomavirus (HPV)-16/18 AS04-adjuvanted vaccine against cervical infection and precancer caused by oncogenic HPV types (PATRICIA): final analysis of a double-blind, randomised study in young women. Lancet 374, 301–314. ( 10.1016/S0140-6736(09)61248-4) [DOI] [PubMed] [Google Scholar]
- 21.Ganusov VV, Antia R. 2003. Trade-offs and the evolution of virulence of microparasites: do details matter? Theor. Popul. Biol. 64, 211–220. ( 10.1016/S0040-5809(03)00063-7) [DOI] [PubMed] [Google Scholar]
- 22.Culp TD, Christensen ND. 2004. Kinetics of in vitro adsorption and entry of papillomavirus virions. Virology 319, 152–161. ( 10.1016/j.virol.2003.11.004) [DOI] [PubMed] [Google Scholar]
- 23.Stanley M. 2006. Immune responses to human papillomavirus. Vaccine 1, 16–22. ( 10.1016/j.vaccine.2005.09.002) [DOI] [PubMed] [Google Scholar]
- 24.Ribeiro RM, Mohri H, Ho DD, Perelson AS. 2002. In vivo dynamics of T cell activation, proliferation, and death in HIV-1 infection: why are CD4+ but not CD8+ T cells depleted? Proc. Natl Acad. Sci. USA 99, 15 572–15 577. ( 10.1073/pnas.242358099) [DOI] [PMC free article] [PubMed] [Google Scholar]
- 25.Asquith B, Edwards CTT, Lipsitch M, McLean AR. 2006. Inefficient cytotoxic T lymphocyte-mediated killing of HIV-1-infected cells in vivo. PLoS Biol. 4, e90 ( 10.1371/journal.pbio.0040090) [DOI] [PMC free article] [PubMed] [Google Scholar]
- 26.De Paepe M, Taddei F. 2006. Viruses’ life history: towards a mechanistic basis of a trade-off between survival and reproduction among phages. PLoS Biol. 4, e193 ( 10.1371/journal.pbio.0040193) [DOI] [PMC free article] [PubMed] [Google Scholar]
- 27.Liljeros F, Edling CR, Amaral LA, Stanley HE, Aberg Y. 2001. The web of human sexual contacts. Nature 411, 907–908. ( 10.1038/35082140) [DOI] [PubMed] [Google Scholar]
- 28.Taira AV, Neukermans CP, Sanders GD. 2004. Evaluating human papillomavirus vaccination programs. Emerg. Infect. Dis. 10, 1915–1923. ( 10.3201/eid1011.040222) [DOI] [PMC free article] [PubMed] [Google Scholar]
- 29.Kretzschmar M, Dietz K. 1998. The effect of pair formation and variable infectivity on the spread of an infection without recovery. Math. Biosci. 148, 83–113. ( 10.1016/S0025-5564(97)10008-6) [DOI] [PubMed] [Google Scholar]
- 30.Muller H, Bauch C. 2010. When do sexual partnerships need to be accounted for in transmission models of human papillomavirus? Int. J. Environ. Res. Public Health 7, 635–650. ( 10.3390/ijerph7020635) [DOI] [PMC free article] [PubMed] [Google Scholar]
- 31.Burchell AN, Richardson H, Mahmud SM, Trottier H, Tellier PP, Hanley J, Coutlée F, Franco EL. 2006. Modeling the sexual transmissibility of human papillomavirus infection using stochastic computer simulation and empirical data from a cohort study of young women in Montreal, Canada. Am. J. Epidemiol. 163, 534–543. ( 10.1093/aje/kwj077) [DOI] [PubMed] [Google Scholar]
- 32.Nelson SJ, Hughes JP, Foxman B, Aral SO, Holmes KK, White PJ, Golden MR. 2010. Age- and gender-specific estimates of partnership formation and dissolution rates in the Seattle sex survey. Ann. Epidemiol. 20, 308–317. ( 10.1016/j.annepidem.2009.11.003) [DOI] [PMC free article] [PubMed] [Google Scholar]
- 33.Lurie MN, Rosenthal S. 2009. Concurrent partnerships as a driver of the HIV epidemic in sub-Saharan Africa? The evidence is limited. AIDS Behav. 14, 17–24. ( 10.1007/s10461-009-9583-5) [DOI] [PMC free article] [PubMed] [Google Scholar]
- 34.Foxman B, Newman M, Percha B, Holmes KK, Aral SO. 2006. Measures of sexual partnerships: lengths, gaps, overlaps, and sexually transmitted infection. Sex. Transm. Dis. 33, 209–214. ( 10.1097/01.olq.0000187210.53010.10) [DOI] [PubMed] [Google Scholar]
- 35.Delva W, Richter M, De Koker P, Chersich M, Temmerman M. 2011. Sex work during the 2010 FIFA World Cup: results from a three-wave cross-sectional survey. PLoS ONE 6, e28363 ( 10.1371/journal.pone.0028363) [DOI] [PMC free article] [PubMed] [Google Scholar]
- 36.Scott M, Nakagawa M, Moscicki A. 2001. Cell-mediated immune response to human papillomavirus infection. Clin. Vaccine Immunol. 8, 209 ( 10.1128/CDLI.8.2.209-220.2001) [DOI] [PMC free article] [PubMed] [Google Scholar]
- 37.Antia R, Bergstrom CT, Pilyugin SS, Kaech SM. 2003. Models of CD8+ responses. 1. What is the antigen-independent proliferation program? J. Theor. Biol. 221, 585–598. ( 10.1006/jtbi.2003.3208) [DOI] [PubMed] [Google Scholar]
- 38.Gilchrist M, Sasaki A. 2002. Modeling host–parasite coevolution: a nested approach based on mechanistic models. J. Theor. Biol. 218, 289–308. ( 10.1006/jtbi.2002.3076) [DOI] [PubMed] [Google Scholar]
- 39.Coombs D, Gilchrist M, Ball CL. 2007. Evaluating the importance of within- and between-host selection pressures on the evolution of chronic pathogens. Theor. Popul. Biol. 72, 576–591. ( 10.1016/j.tpb.2007.08.005) [DOI] [PubMed] [Google Scholar]
- 40.Future T, Group IIS, Group TFIS. 2010. Four year efficacy of prophylactic human papillomavirus quadrivalent vaccine against low grade cervical, vulvar, and vaginal intraepithelial neoplasia and anogenital warts: randomised controlled trial. BMJ 341, c3493 ( 10.1136/bmj.c3493) [DOI] [PMC free article] [PubMed] [Google Scholar]
- 41.Palefsky JM, Gillison ML, Strickler HD. 2006. Chapter 16: HPV vaccines in immunocompromised women and men. Vaccine 24(Suppl. 3), S3/140–S3/146. [DOI] [PubMed] [Google Scholar]
- 42.Wilkin T, et al. 2010. Safety and immunogenicity of the quadrivalent human papillomavirus vaccine in HIV-1-infected men. J. Infect. Dis. 202, 1246–1253. ( 10.1086/656320) [DOI] [PMC free article] [PubMed] [Google Scholar]
- 43.Denny LA, Franceschi S, de Sanjosé S, Heard I, Moscicki AB, Palefsky J. 2012. Human papillomavirus, human immunodeficiency virus and immunosuppression. Vaccine 30(Suppl. 5), F168–F174. ( 10.1016/j.vaccine.2012.06.045) [DOI] [PubMed] [Google Scholar]
- 44.Stanley M, Pinto LA, Trimble C. 2012. Human papillomavirus vaccines--immune responses. Vaccine 30, F83–F87. ( 10.1016/j.vaccine.2012.04.106) [DOI] [PubMed] [Google Scholar]
- 45.Kretzschmar M. 2000. Sexual network structure and sexually transmitted disease prevention: a modeling perspective. Sex. Transm. Dis. 27, 627–635. ( 10.1097/00007435-200011000-00011) [DOI] [PubMed] [Google Scholar]
- 46.Barnabas RV, Laukkanen P, Koskela P, Kontula O, Lehtinen M, Garnett GP. 2006. Epidemiology of HPV 16 and cervical cancer in Finland and the potential impact of vaccination: mathematical modelling analyses. PLoS Med. 3, e138 ( 10.1371/journal.pmed.0030138) [DOI] [PMC free article] [PubMed] [Google Scholar]
- 47.Crawford B, Zaleta CMK. 2009. The impact of vaccination and coinfection on HPV and cervical cancer. Discret. Contin. Dyn. Syst. Ser. B 12, 279–304. ( 10.3934/dcdsb.2009.12.279) [DOI] [Google Scholar]
- 48.Koshiol JE, et al. 2006. Time to clearance of human papillomavirus infection by type and human immunodeficiency virus serostatus. Int. J. Cancer 119, 1623–1629. ( 10.1002/ijc.22015) [DOI] [PubMed] [Google Scholar]
- 49.Gandon S, Day T. 2008. Evidences of parasite evolution after vaccination. Vaccine 26, C4–C7. ( 10.1016/j.vaccine.2008.02.007) [DOI] [PubMed] [Google Scholar]
- 50.Roden R, Wu T-C. 2006. How will HPV vaccines affect cervical cancer? Nat. Rev. Cancer 6, 753–763. ( 10.1038/nrc1973) [DOI] [PMC free article] [PubMed] [Google Scholar]
- 51.Poolman EM, Elbasha EH, Galvani AP. 2008. Vaccination and the evolutionary ecology of human papillomavirus. Vaccine 26, C25–C30. ( 10.1016/j.vaccine.2008.04.010) [DOI] [PubMed] [Google Scholar]
- 52.Durham DP, Poolman EM, Ibuka Y, Townsend JP, Galvani AP. 2012. Reevaluation of epidemiological data demonstrates that it is consistent with cross-immunity among human papillomavirus types. J. Infect. Dis. 206, 1291–1298. ( 10.1093/infdis/jis494) [DOI] [PMC free article] [PubMed] [Google Scholar]
- 53.Stern PL, Brown M, Stacey SN, Kitchener HC, Hampson I, Abdel-Hady E, Moore JV. 2000. Natural HPV immunity and vaccination strategies. J. Clin. Virol. 19, 57–66. ( 10.1016/S1386-6532(00)00128-1) [DOI] [PubMed] [Google Scholar]
- 54.Kadaja M, Silla T, Ustav E, Ustav M. 2009. Papillomavirus DNA replication—from initiation to genomic instability. Virology 384, 360–368. ( 10.1016/j.virol.2008.11.032) [DOI] [PubMed] [Google Scholar]
- 55.Cladel NM, Budgeon LR, Cooper TK, Balogh KK, Hu J, Christensen ND. 2013. Secondary infections, expanded tissue tropism, and evidence for malignant potential in immunocompromised mice infected with Mus musculus papillomavirus 1 DNA and virus. J. Virol. 87, 9391–9395. ( 10.1128/JVI.00777-13) [DOI] [PMC free article] [PubMed] [Google Scholar]
- 56.Cladel NM, Hu J, Balogh K, Mejia A, Christensen ND. 2008. Wounding prior to challenge substantially improves infectivity of cottontail rabbit papillomavirus and allows for standardization of infection. J. Virol. Methods 148, 34–39. ( 10.1016/j.jviromet.2007.10.005) [DOI] [PMC free article] [PubMed] [Google Scholar]
- 57.Gottschling M, Stamatakis A, Nindl I, Stockfleth E, Alonso A, Bravo IG. 2007. Multiple evolutionary mechanisms drive papillomavirus diversification. Mol. Biol. Evol. 24, 1242–1258. ( 10.1093/molbev/msm039) [DOI] [PubMed] [Google Scholar]
- 58.Gottschling M, Goker M, Stamatakis A, Bininda-Emonds ORP, Nindl I, Bravo IG, 2011. Quantifying the phylodynamic forces driving papillomavirus evolution. Mol. Biol. Evol. 28, 2101–2113. ( 10.1093/molbev/msr030) [DOI] [PubMed] [Google Scholar]
- 59.Chen Z, DeSalle R, Schiffman M, Herrero R, Burk RD. 2009. Evolutionary dynamics of variant genomes of human papillomavirus types 18, 45, and 97. J. Virol. 83, 1443–1455. ( 10.1128/JVI.02068-08) [DOI] [PMC free article] [PubMed] [Google Scholar]
- 60.Orav M, Henno L, Isok-Paas H, Geimanen J, Ustav M, Ustav E. 2013. Recombination-dependent oligomerization of human papillomavirus genomes upon transient DNA replication. J. Virol. 87, 12 051–12 068. ( 10.1128/JVI.01798-13) [DOI] [PMC free article] [PubMed] [Google Scholar]
- 61.Firth C, Kitchen A, Shapiro B, Suchard MA, Holmes EC, Rambaut A. 2010. Using time-structured data to estimate evolutionary rates of double-stranded DNA viruses. Mol. Biol. Evol. 27, 2038–2051. ( 10.1093/molbev/msq088) [DOI] [PMC free article] [PubMed] [Google Scholar]
- 62.Gandon S, Hochberg ME, Holt RD, Day T. 2012. What limits the evolutionary emergence of pathogens? Phil. Trans. R. Soc. B 368, 20120086 ( 10.1098/rstb.2012.0086) [DOI] [PMC free article] [PubMed] [Google Scholar]
- 63.Lloyd-Smith JO, Schreiber SJ, Kopp PE, Getz WM. 2005. Superspreading and the effect of individual variation on disease emergence. Nature 438, 355–359. ( 10.1038/nature04153) [DOI] [PMC free article] [PubMed] [Google Scholar]
- 64.Blumberg S, Lloyd-Smith JO. 2013. Inference of R(0) and transmission heterogeneity from the size distribution of stuttering chains. PLoS Comput. Biol. 9, e1002993 ( 10.1371/journal.pcbi.1002993) [DOI] [PMC free article] [PubMed] [Google Scholar]
- 65.Hartfield M, Alizon S. 2013. Introducing the outbreak threshold in epidemiology. PLoS Pathog. 9, e1003277 ( 10.1371/journal.ppat.1003277) [DOI] [PMC free article] [PubMed] [Google Scholar]
Associated Data
This section collects any data citations, data availability statements, or supplementary materials included in this article.