

Abstract
There is increasing appreciation that hosts in natural populations are subject to infection by multiple parasite species. Yet the epidemiological and ecological processes determining the outcome of mixed infections are poorly understood. Here, we use two intracellular gut parasites (Microsporidia), one exotic and one co-evolved in the western honeybee (Apis mellifera), in an experiment in which either one or both parasites were administered either simultaneously or sequentially. We provide clear evidence of within-host competition; order of infection was an important determinant of the competitive outcome between parasites, with the first parasite significantly inhibiting the growth of the second, regardless of species. However, the strength of this ‘priority effect’ was highly asymmetric, with the exotic Nosema ceranae exhibiting stronger inhibition of Nosema apis than vice versa. Our results reveal an unusual asymmetry in parasite competition that is dependent on order of infection. When incorporated into a mathematical model of disease prevalence, we find asymmetric competition to be an important predictor of the patterns of parasite prevalence found in nature. Our findings demonstrate the wider significance of complex multi-host–multi-parasite interactions as drivers of host–pathogen community structure.
Keywords: Apis mellifera, Microsporidia, host, parasite, co-infection, priority effect
1. Introduction
Animal species are host to a wide range of parasites and, equally, parasites can target a range of viable hosts: multi-host–multi-parasite systems are the norm [1,2], with potential consequences for the structure and diversity of host–parasite communities [2]. From a host perspective, multiple infections occur when conspecific strains or parasite species co-infect a single host [3,4] and, though coexisting parasites can act independently of one another, they may interact synergistically (by cooperating in extracting host resources, for example [5,6]) or antagonistically, by inhibiting each other's growth or even preventing the establishment of weaker competitors [3,4].
Competing parasites can alter one another's distributions, affecting their fitness, population size and, ultimately, leading to changes in the richness and abundance of parasite communities [7]. In turn, these can have significant impacts on epidemiology [8–12], with major repercussions for disease control in humans [13,14] and other animal hosts [15]. For example, rodents infected with multiple Plasmodium sp. clones contain an unusually high number of asexual forms, leading to enhanced virulence. This suggests a strong trade-off between virulence (e.g. host resource acquisition) and transmission (probability of host death) [11,16]. However, predicting the type and outcome of interactions is not straightforward as it may depend on multiple factors, including variation in the environment, host (genotype), relatedness between pathogens, transmission route or even the relative inoculation frequency of different pathogens [17–20].
One important aspect that can affect the type of interaction is the sequence of infection. Multiple infections can occur simultaneously, or more realistically, sequentially, wherein a parasite infects an organism that is already host to a pre-established parasite. An increasing number of studies have begun to explore these dynamics [21–23]. The species that arrives first is often found to have a larger overall influence on the type and outcome of intra-host interactions [24]. Such ‘priority effects’ may have both negative and positive impacts for the later parasite. For example, the second species may be disadvantaged if there is a significant depletion of host resources following initial infection [25]. Conversely, the second may benefit due to host immunosuppression by the first pathogen, thereby facilitating establishment, and increasing the likelihood of host immune avoidance [23].
A major obstacle in understanding these multi-faceted interactions among parasites within a single host has been a genuine lack of empirical research into multiple host–parasite systems, with knock-on effects for theoretical progress in the field [2]. To address this gap in understanding, we explore the competitive interaction dynamics between two intracellular microsporidian (Microsporidia: Nosema) ventricular (gut) parasites of the western honeybee (Apis mellifera) by manipulating the sequence of infection of a native (Nosema apis) versus an exotic species (Nosema ceranae). Microsporidia are a highly diverse group of obligate intracellular pathogens that usually reproduce asexually (but see [26]) and infect a wide range of animals from insects to mammals [27]. They have been implicated as causative agents of numerous diseases, with significant economic and ecological impacts [28]. Nosema ceranae is considered an emerging infectious disease [29] that has reached a global distribution [30] by recently switching to A. mellifera [31] from its putatively original host, the Asian honeybee Apis cerana [32]. The distribution of both Microsporidia appears strongly influenced by environmental conditions [30,33], with N. ceranae in particular being negatively affected by low temperature [34,35].
In a controlled laboratory experimental approach using individual adult honeybees, we explored the nature of the competitive interaction between N. apis and N. ceranae. We demonstrate that competition between pathogens is antagonistic, but that competitive effects depend on the sequence of infection, with the first parasite significantly inhibiting the growth of the second. Notably, competition is strongly asymmetrical, with the exotic N. ceranae inducing a greater inhibitory effect than the native N. apis. We explored the impact of asymmetric competition on pathogen prevalence by developing a simple mathematical model. Our findings demonstrate the importance of complex multi-host–multi-parasite interactions for host–parasite community structure and disease emergence.
2. Material and methods
(a). Host and pathogen preparation
Honeybee brood was sampled from three unrelated colonies, and day-old worker bees that emerged in an incubator were mixed and held in metal cages (10 individuals per cage) in an incubator at +30°C with ad libitum 50% (w/v) sucrose solution. Both Nosema species were obtained from propagations in the laboratory through mass feeding of caged honeybees with either N. ceranae spores originating from Germany or N. apis spores originating from Sweden. Freshly prepared inocula of N. ceranae and N. apis spores were prepared on the day of experimental infection by crushing the ventriculus of infected honeybees in distilled water. Inocula were purified using the triangulation method [36]. Spore numbers were counted with a Neubauer haemocytometer under a light microscope (×400) and diluted to obtain the required concentration in 50% (w/v) sucrose solution.
For the control, an extract from the ventriculus of uninfected caged honeybees was obtained as above. Nosema species identification and absence of spores in the controls were confirmed with a multiplex PCR that simultaneously differentiates N. apis from N. ceranae [36].
(b). Experimental set-up
Caged bees were fed individually on days 3 and 6 after emergence with 10 µl of 50% (w/v) sucrose solution containing 50 000 spores of either N. ceranae or N. apis, a 1 : 1 mix of the two or a control solution. When bees received Nosema spores on both days, they acquired a total of 105 spores. This is within the suggested dosage of spores that yields infection in all individual bees (ID100) [37,38]. Bees that did not consume the entire inoculum were discarded. Ten treatments were administered (table 1), with each treatment consisting of four independent replicate cages of 10 bees per cage. Fourteen days after the first infection (bees were 17 days old), surviving bees were killed and stored at −20°C for parasite quantification.
Table 1.
Overview of experiment design. Each treatment was replicated four times.
| treatment | first infection (day 3) 50 000 spores in total per bee | second infection (day 6) 50 000 spores in total per bee |
|---|---|---|
| — | controla | controla |
| C– | N. ceranae | controla |
| CA | N. ceranae | N. apis |
| –A | controla | N. apis |
| A– | N. apis | controla |
| AC | N. apis | N. ceranae |
| –C | controla | N. ceranae |
| AA | N. apis | N. apis |
| AC/AC | N. apis/N. ceranae | N. apis/N. ceranae |
| CC | N. ceranae | N. ceranae |
aExtract from the midgut of uninfected honeybees.
(c). Determining the level of infection (pathogen load)
The level of infection was determined using whole gastral DNA extracts. Both N. ceranae and N. apis are tissue specific, infecting only the ventriculus [39]. Nosema spores are ingested and travel to the midgut where they geminate and infect epithelial cells to complete their life cycle. After lysis of an infected cell, spores of various developmental stages are released and can either accumulate in the rectum or germinate and infect surrounding healthy epithelial cells [33,40]. By using the whole gaster for determining pathogen load, there is potential for spore loss through defaecation. But faeces are very rarely observed in caged bees, and gastral extracts therefore represent a good proxy for pathogen load.
DNA was extracted from five individual bees per cage and N. apis and N. ceranae DNA copy number was determined by quantitative PCR (qPCR). Gasters were individually washed and crushed in 500 µl of ddH2O, then 200 µl were used for genomic DNA extraction using a DNeasy Plant Mini Kit (Qiagen) according to manufacturer's instructions for plant tissue with a robot (QIAcube (Qiagen) instrument). Levels of infection were determined by qPCR using primers previously described by vanEngelsdorp et al. [41], with a modification to the reverse primer of N. apis to match available Genbank sequences and to increase amplification efficiency (AAAGTCTATTGTATTGCGCGTGCT versus original reverse: TATATTTATTGTATTGCGCGTGCT). Amplicon sizes were 232 bp and 208 bp for N. ceranae and N. apis, respectively. Separate quantitative reactions were performed for each Nosema species in a Bio-Rad C1000 Thermal Cycler (Bio-Rad) using 2× SensiMix SYBR and Fluorescein (Bioline), 0.2 µM of each primer and 1 µl (approx. 1 ng) of template in a final volume of 10 µl. Samples including all components except DNA template served as a negative control in each run. Each reaction was performed in duplicate and the average quantification cycle (Cq) value was taken (accepting a maximum Cq difference of 1 between duplicates). Amplification was performed using the thermal profile described in vanEngelsdorp et al. [41] but with an empirically determined optimal annealing temperature of 54°C. Post amplification melting curve analysis was used to check for non-specific amplification (50–95°C with an increment of 0.5°C s−1) and external standards (serving also as positive controls) comprising serial dilutions ranging from 10−3 to 10−8 of purified PCR products (QIAquick PCR purification kit (Qiagen)) were used to estimate PCR reaction efficiencies. PCR products were quantified on an Epoch Microplate Spectophotometer (BioTek)) for each target DNA fragment. Standard curves were included in each run for absolute quantification of DNA copy number of each Nosema species; we accepted PCR efficiencies between 90 and 100% and R2 values above 0.98.
Spore load per bee was estimated by counting the number of spores in ten randomly selected singly infected bees using a Neubauer haemocytometer under a light microscope (×400). These represented a subset of the samples analysed by qPCR, and a correlation between actual spore counts and DNA copy number was generated to provide an estimation of the infection load of individual bees. Using these regression equations, all DNA data were transformed to spore counts (electronic supplementary material, figure S1) to calculate the impact of each pathogen on the spore production of the other. This constituted a component of our mathematical model (see §3b).
(d). Statistical analysis
The effect of experimental treatment on the growth of each parasite species was analysed using generalized linear mixed models (GLMM), including replicate as a random factor and treatment as a fixed factor. Normality and homogeneity were checked by visual inspection of diagnostic plots (plots of residuals against fitted values). The validity of our models was assessed by performing likelihood tests of final models (containing fixed factors) against the respective null model that contained only the random effects. Post hoc tests with Bonferroni correction were applied to test differences between treatments.
The magnitude of observed effects was assessed using the standardized effect size, as [42]
 |
2.1 |
with r representing Pearson's correlation coefficient (constrained between 0 and 1, with 0 indicating absence of effect), and t values were obtained from the model summary.
A second model using the total copy number of Nosema spp. from each treatment was also constructed using the same method as described earlier, and post hoc tests with Bonferroni correction were also applied to test for differences in group means. DNA copy numbers were log-transformed prior to analysis to meet model assumptions. Data were analysed using R (v. 2.15.2) and the R packages lme4 [43] and multcomp [44].
The number of bees that remained alive until the termination of the experiment was also recorded and differences between treatments were tested using GLMM, including replicate as a random factor, followed by post hoc tests with Bonferroni correction.
(e). Mathematical modelling
We constructed a mathematical model in Mathematica (v. 9.0) by implementing two differential equations to simulate the change in the frequency of infected colonies across time. Briefly, we modelled a population of honeybee colonies with a proportion A infected by N. apis (0 < A < 1) and C infected by N. ceranae (0 < C < 1). Colonies can be infected by both pathogens with a frequency of AC. We assume that, once a colony is infected, it stays infected until it dies, at which point it is replaced in our model with an uninfected colony. In the model, transmission of N. apis from N. apis-only infected colonies to N. apis-susceptible colonies occurs at a rate of oA, while transmission of N. ceranae from N. ceranae-only infected colonies to N. ceranae-susceptible colonies occurs at a rate of oC. Transmission of N. apis and N. ceranae can also occur from mixed infected colonies at a rate of mA and mC, respectively. The mortality rate of colonies infected with either N. apis (v in vA) or N. ceranae (v in vC) was set to 0.03 (indicating an annual death rate of infected colonies of 3%). This value was set after taking into account data from Germany across a 5-year study published in table 2 of Gisder et al. [34], and calculating the average death rate of colonies infected with either Nosema spp. after accounting for background mortality of uninfected colonies.
The rate of change of colonies infected with N. apis is given by
| 2.2 |
and the rate of change of colonies infected with N. ceranae is
| 2.3 |
The code used to generate the plots is given in the electronic supplementary material.
3. Results
(a). Interspecific competition between Nosema apis and Nosema ceranae
Mortality recorded at the end of the experiment was not found to differ significantly across treatments (p > 0.05), which was unsurprising as the experiment was designed such that experiments were terminated before severe mortality occurred, to ensure adequate sample sizes for subsequent pathogen analysis. Moreover, none of the bees fed with the control solution became infected. Thus, control groups were excluded from further analysis.
Experimental treatment was found to have a significant effect on pathogen load (F11,217 = 12.106, p < 0.001). Post hoc analysis revealed a significant priority effect in the sequential interspecific double infections (i.e. CA or AC); the growth of the second pathogen (administered on day 6) was significantly inhibited by the presence of the first pathogen (administered on day 3).
Specifically, when given after N. ceranae, N. apis DNA was 11 times lower than when given after the control (A in treatment CA versus A in treatment –A; p < 0.001; effect size of reduction: r = 0.46; figure 1a). But the growth of N. ceranae when administered on day 3 was not influenced by the presence of the second pathogen, N. apis (C in treatment C– versus C in treatment CA, p > 0.05; figure 1a). Nosema apis DNA was also significantly lower than N. ceranae DNA when it was administered second, by 1.2 times (C versus A within treatment CA; p < 0.05; effect size of reduction: r = 0.25; figure 1a, comparison not shown).
Figure 1.

Mean (±95% CI) N. ceranae and N. apis DNA copy number (log transformed) for each treatment at the end of the experiment (means estimated across all four replicates). Each panel emphasizes main comparisons (bars of the same colour are compared within each panel as they represent amounts of either N. ceranae or N. apis present in double infections as compared with the equivalent time point in single infections (***p < 0.05, ns = not significant)). For both species, growth is reduced when the other species is inoculated first (***p < 0.05, ns = not significant). Treatment comparisons: (a) N. ceranae given at day 3 versus N. apis at day 6; (b) N. apis at day 3 versus N. ceranae at day 6; (c) both species given simultaneously.
Likewise, when given after N. apis, N. ceranae DNA was six times lower than when given after the control (C in treatment AC versus C in treatment –C; p < 0.001; effect size of reduction: r = 0.30; figure 1b). Once again, the growth of the first pathogen, N. apis, was not affected by the presence of the second pathogen, N. ceranae (A in treatment A– versus A in treatment AC, p > 0.05; figure 1b). However, unlike in treatment CA where DNA of the first pathogen (N. ceranae) was more abundant than the second pathogen (N. apis), we detected no difference in DNA between pathogens in the treatment AC (A versus C within treatment AC; p > 0.05; figure 1b, comparison not shown). In the mixed treatments where N. apis and N. ceranae were given simultaneously, the growth of each species was not affected by the presence of the other (A in AC/AC versus AA; C in AC/AC versus CC; A versus C within AC/AC treatment, p > 0.05; figure 1c).
In order to check if there was a growth advantage of one species over the other in general, we also compared pathogen growth across single infections. We found that, by the end of the experiment, both pathogens were able to multiply to the same extent under single (A–, –A, C–, –C) and sequential single infections (CC, AA; p > 0.05 for all possible comparisons; figure 1, comparisons not shown), suggesting that there was no major growth advantage of one species over the other under these infection conditions, and also demonstrating a lack of a ‘timing effect’ as infection of older bees (day 6 versus day 3) resulted in similar parasite loads for both species.
Finally, total parasite growth varied subtly among treatments, with treatments in which N. ceranae was administered first showing a slight reduction in total amount of Nosema spp. DNA compared to all other treatments. Differences among treatments were, however, marginal and not consistently significant (electronic supplementary material, figure S2).
(b). Mathematical modelling
First, we considered the impact of each parasite in a colony on the spore production of the other parasite. Transformation of DNA copy number to spore counts showed that N. ceranae resulted in a 2.6-fold reduction in N. apis spore production when the former was established first, while pre-establishment of N. apis suppressed N. ceranae spore production by a factor of 1.2. When setting the model parameters to represent this effect (figure 2), we find that the prevalences of N. apis and N. ceranae converge to equilibrium levels, with N. ceranae stabilizing at a higher prevalence than N. apis.
Figure 2.
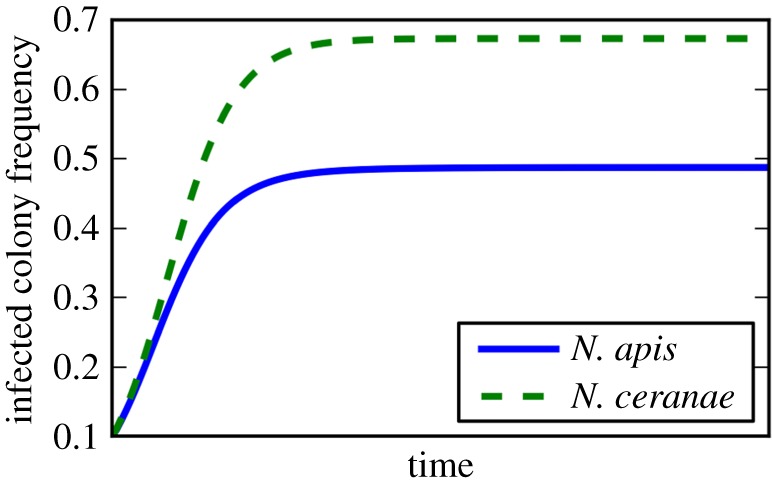
Model prediction that N. ceranae has a higher prevalence than N. apis due to its suppression of N. apis spores. A numerical integration of equations (2.2) and (2.3) plotted in the figure shows how the frequency of both Microsporidia reach stable equilibria. Parameters are oA = oC = 0.1, mA = oA/2.6, mC = oC/1.2, v = 0.03. (Online version in colour.)
A negative effect of low temperature on N. ceranae germination has been previously observed [34], suggesting negative impacts of harsh winters in northern temperate or boreal climates on N. ceranae spore survival. We modelled this cold climate effect by reducing the colony-to-colony transmission rate of N. ceranae relative to that of N. apis. We derived the equilibrium levels of the two species predicted by our model for a given set of parameters and confirmed that the equilibria are stable (electronic supplementary material). We plotted stable equilibria for a range of colony-to-colony transmission rates of N. ceranae, with the aim of predicting relative prevalences across a range of climatic conditions. For relevance, we chose a range that reflected conditions that are typically found from Southern to Northern Europe (figure 3; electronic supplementary material, table S1). With increasingly cold climate compromising N. ceranae transmission, our model predicted a transition zone at which N. apis becomes more prevalent than N. ceranae (figure 3a). When we ignore interspecific competition, the result is trivial: N. ceranae never manages to predominate N. apis (figure 3b).
Figure 3.
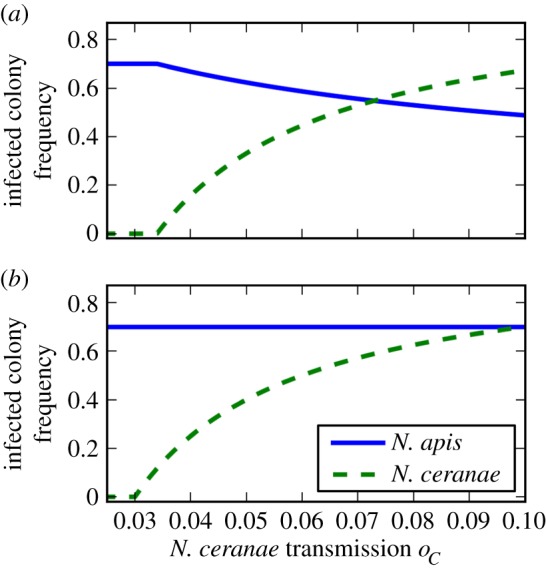
Model predictions across a climatic gradient (varying N. ceranae transmission). (a) At lower levels of N. ceranae transmission (colder climate) N. apis is more prevalent, while at higher levels (warmer climate) N. ceranae is more prevalent. (b) Excluding interspecific competition, N. apis is always more prevalent than N. ceranae. Both panels of the figure show stable equilibria plotted for both N. apis and N. ceranae over varying levels of oC. Other parameters for (a) are oA = 0.1, mA = oA/2.6, mC = oC/1.2, v = 0.03 and the same for (b), except mA = oA, mA = oC. (Online version in colour.)
Our experimental results focused on the impact of multiple infections on individual bees. But at the colony level, the impact of N. ceranae on N. apis transmission may be lower than we predict as not all bees in multiply-infected colonies are infected by both pathogens. Furthermore, N. ceranae might lead to increased mortality of colonies when compared to N. apis [45]. Alternatively, the advantage of N. ceranae over N. apis may actually accumulate within colonies, meaning that the impact of N. ceranae on N. apis transmission may be higher than we predict. To test if our model is robust to these effects, we varied the level of the impact of the Microsporidia on each other's transmission. This resulted in a slight reduction in both N. ceranae and N. apis prevalence across a range of N. ceranae colony-to-colony transmission rates (electronic supplementary material, figure S3). We also investigated the effect of increased mortality of N. ceranae-infected colonies (see electronic supplementary material, §S1 and §S2), with our model predicting that increased mortality reduces N. ceranae prevalence (electronic supplementary material, figure S4). Despite this potential influence of mortality on pathogen prevalence, our model predicts that a transition in predominance between N. apis and N. ceranae will nevertheless occur. As field data on the colony level addressing differential mortality of the two pathogens are currently lacking, we suggest that, if differences do exist, these are likely to be subtle because where environmental conditions are permissive, N. ceranae prevalence is naturally high (electronic supplementary material, table S1).
4. Discussion
We provide clear evidence of interspecific competition between N. apis and N. ceranae when in a common host, A. mellifera. The effect of competition was found to depend strongly on the sequence of infection, with the pre-established parasite inhibiting the growth of the second pathogen, indicating a ‘priority effect’. Interestingly, no interaction was observed when the two pathogens were introduced simultaneously. Importantly, the extent to which each species was inhibited through competition with the other was asymmetrical, with the exotic N. ceranae inducing a much greater inhibitory effect than the native N. apis. By incorporating differences in interspecific competition into a model, we found that the observed priority effect helped to explain the relative prevalence of these pathogens in nature. Specifically, both N. apis and N. ceranae occur across severe boreal to mild temperate climates, but while N. apis predominates in the former, N. ceranae is more prominent in the latter [33,46].
Order of infection can determine the outcome of multi-parasite interactions, and has been shown to be relevant for a broad range of pathogenic organisms including viruses and fungi, as well as Microsporidia. Outcomes of pathogen interactions are often negative, leading to decreased performance of one or both competitors [47–49] via processes of exploitation or apparent competition [3,4]. As both Nosema species are known to infect the same host honeybee tissues [39], exploitation competition for space and resources could be responsible for our findings. During infection, Nosema invades adult honeybee ventricular epithelial cells, leading to their degeneration [50]. Overlapping requirements for host cellular resources could explain why the parasite species that arrives second suffers reduced growth. Prior residency may provide a temporal advantage, enabling parasite niche establishment and an initial uptake in host resources that increase its density relative to its competitor, which additionally faces a deteriorating and lower-quality host environment. Alternatively, or in addition to this effect, competitive interactions may mediate an immune response in the host that suppresses growth of the pathogen arriving second through immune priming [51]. It is difficult to distinguish between these two processes, and a combination of both could potentially account for the priority effect observed in our study. For example, under a mixed infection regime in the rodent malaria system, depletion of host resources (red blood cells) as well as immune priming are thought to play a role in competition between genetically diverse strains [52].
Interestingly, we detected an asymmetry in the strength of the priority effect, with N. ceranae having a stronger negative effect on N. apis growth than vice versa. This difference could similarly be driven by resource competition. Dussaubat et al. [53] found inhibition of pathways involved in the renewal of gut tissue following N. ceranae infection, and documented lesions in the epithelial layer of the ventriculus. It is possible that host resource quality deteriorates more quickly during N. ceranae infection, perhaps due to the higher virulence attributed to N. ceranae [50,54,55]. Alternatively, the environment encountered by N. ceranae may be more favourable, perhaps due to N. ceranae being better able to evade the host's immune response after the host's initial exposure to N. apis. As a native pathogen, N. apis may induce a more specific immune response that is less effective against subsequent infection with the exotic N. ceranae. While there are indications that N. ceranae induces immune suppression of the honeybee [56], potentially making the host more susceptible to secondary infection, a parallel study of N. apis has not been conducted and is required for meaningful comparisons to be drawn.
Regardless of the underlying mechanisms, the stronger inhibitory effects of the exotic N. ceranae over the native N. apis offer a potential explanation for the widespread distribution of this novel parasite. In a simplified mathematical model, we found that both environmental (climate) and interspecific competition variables may be important in explaining the differential prevalence of Nosema spp. across climatic regions. By taking asymmetric competition into account, we could better explain the predominance of N. ceranae over N. apis, at least under conditions of equal transmission (figure 2). Moreover, by exploring a range of transmission rates for N. ceranae, which we assumed to be influenced by its sensitivity to environmental stress (cold intolerance), our model could predict a transition in the predominance of one species over the other (figure 3a), reflecting the transition observed in nature between severe temperate/boreal and warmer climates [33].
Field data across Europe reveal a transition zone in the relative prevalences of the two species, with N. ceranae predominating over N. apis in Southern regions such as Spain, and N. apis predominating in Northern climates such as Sweden (electronic supplementary material, table S1). This transition may be gradual across a geographical latitude gradient, with differences in the relative prevalence of either pathogen becoming less pronounced in central Europe (e.g. Germany; electronic supplementary material, table S1). It is challenging to assess the field data as a whole against our model because high variance between field studies hinders comparison. However, although our model predictions are generally elevated as compared to the field data (compare figure 3a and electronic supplementary material, table S1), the relative differences between the prevalence of the two pathogens are consistent across studies and with our model predictions.
Data from Sweden in 2007 [35] report the occurrence of N. ceranae and N. apis in approximately 3% and 33% of colonies, respectively (electronic supplementary material, table S1). Our model assumes impaired N. ceranae transmission in boreal conditions, and indeed predicts substantially lower N. ceranae prevalence compared with N. apis. Although N. apis prevalence is overestimated in our model with the parameters that we used, the relative difference between pathogens (approx. 30%) falls within the predicted range of our model (figure 3a, low oC values). Conversely, when transmission rates are similar between the two species, as is the case in temperate conditions, our model predicts a switch in the relative prevalence of the two species, with N. ceranae and N. apis occurring in 70% and 50% of colonies, respectively. Field data from Spain across multiple years are consistent with this pattern, with N. ceranae and N. apis occurring in 40% and 10% of colonies, respectively (electronic supplementary material, table S1). Thus, although our model overestimates the recorded prevalence, the relative differences between the species are in line with our predictions. The transition zone in our model occurs where the superior competitive ability of N. ceranae is compensated by its susceptibility to cold. More studies covering a wider range of climatic gradients are required to characterize this zone more precisely, but we predict that it will vary by year and season as environmental conditions fluctuate. Climatic conditions and current available field data indicate that central Europe may be a suitable region upon which to focus attention.
Deviations between our model and field data can be partly attributed to lack of available data in addition to model limitations. Lack of empirical information concerning realistic transmission rates or routes of transmission of N. apis and N. ceranae is a considerable source of uncertainty. The maximum transmission rate, which we keep constant for N. apis and equal to that of N. ceranae in temperate conditions, was arbitrarily set to 0.1. This value can be lowered to attain prevalences that are more representative of the field data without affecting the relative prevalence of the two microsporidia (data not shown). In addition, in the current model we assume a linear relationship derived from our experiment, between number of spores and transmission rate. A power function might be more suitable for future modelling. Exclusion of seasonality (which may influence prevalence [57]) and the extrapolation of our laboratory-derived individual host data to host colonies in the field are also possible limitations, although for the latter our model is robust to variation in the inhibitory abilities of N. ceranae (electronic supplementary material, figure S3). Our model is also restricted to a rate of mortality that is set constant and equal for both species. While increased mortality attributable to N. ceranae impacts its prevalence, its effect is subtle (electronic supplementary material, figure S4). Moreover, the relative prevalences predicted by our model given a more moderate rate of mortality are consistent with the field data. Given that both N. apis and N. ceranae are also globally widespread and highly prevalent [58,59], we doubt that mortality attributable to N. ceranae is substantially different from N. apis at the colony level, despite potentially subtle differences in virulence at the level of the individual bee [55]. Finally, we assume that N. ceranae has already reached equilibrium, but this cannot be conclusively demonstrated given available data. However, the rapid spread of N. ceranae across the globe indicates that N. ceranae is now firmly established [60]. Despite these potential limitations, we are able to show that the outcome of asymmetric interspecific competition on pathogen prevalence depends significantly on variation in the pathogen's response to environmental stress, and furthermore, that these variables may assist in explaining the contemporary prevalence of exotic and native pathogens of the western honeybee. In other words, in addition to abiotic factors, complex host–parasite interactions play an important role in shaping pathogen community structure.
In conclusion, we demonstrate that interspecific competition between N. apis and N. ceranae is antagonistic, that it depends on the sequence of infection, and that it is asymmetrical, with the emerging infectious pathogen, N. ceranae, more strongly inhibiting the growth of the native N. apis than vice versa. Under certain conditions, our model indicated that, in combination with environmental variables, asymmetric interspecific competition can help to explain the widespread prevalence of an emerging infectious pathogen (N. ceranae) through enhanced inhibition of its native competitor, N. apis. However, as interspecific competition can impact both pathogens and host(s), it is unclear to what extent co-infection dynamics influence the epidemiology of Microsporidia in honeybees, as critical disease components such as virulence and transmission have not yet been quantified. These represent important targets for future research if we are to reach a better understanding of the impacts of disease in multi-host–multi-parasite systems.
Ethics statement
Experiments and observations conform with the laws of Germany in relation to animal protection. The authors declare no competing interests with research described in this paper.
Supplementary Material
Supplementary Material
Supplementary Material
Supplementary Material
Acknowledgements
We thank Ingemar Fries for supplying N. apis and for his helpful comments on the manuscript, as well as those of the anonymous referees and the editor.
Funding statement
This work was supported by the Federal Ministry of Food, Agriculture and Consumer Protection (Germany): Fit Bee project (grant no. 511-06.01-28-1-71.007-10), the EU: BeeDoc (grant no. 244956) and the Insect Pollinators Initiative (IPI grant no. BB/1000100/1 and BB/I000151/1). The IPI is funded jointly by the Biotechnology and Biological Sciences Research Council, the Department for Environment, Food and Rural Affairs, the Natural Environment Research Council, the Scottish Government and the Wellcome Trust, under the Living with Environmental Change Partnership.
References
- 1.Woolhouse MEJ, Haydon DT, Antia R. 2005. Emerging pathogens: the epidemiology and evolution of species jumps. Trends Ecol. Evol. 20, 238–244. ( 10.1016/j.tree.2005.02.009) [DOI] [PMC free article] [PubMed] [Google Scholar]
- 2.Rigaud T, Perrot-Minnot MJ, Brown MJF. 2010. Parasite and host assemblages: embracing the reality will improve our knowledge of parasite transmission and virulence. Proc. R. Soc. B 277, 3693–3702. ( 10.1098/rspb.2010.1163) [DOI] [PMC free article] [PubMed] [Google Scholar]
- 3.Cox FEG. 2001. Concomitant infections, parasites and immune responses. Parasitology 122, S23–S38. ( 10.1017/S003118200001698X) [DOI] [PubMed] [Google Scholar]
- 4.Read AF, Taylor LH. 2001. The ecology of genetically diverse infections. Science 292, 1099–1102. ( 10.1126/science.1059410) [DOI] [PubMed] [Google Scholar]
- 5.Griffin A, West S, Buckling A. 2004. Cooperation and competition in pathogenic bacteria. Nature 430, 1024–1027. ( 10.1038/nature02744) [DOI] [PubMed] [Google Scholar]
- 6.West SA, Buckling A. 2003. Cooperation, virulence and siderophore production in bacterial parasites. Proc. R. Soc. Lond. B 270, 37–44. ( 10.1098/rspb.2002.2209) [DOI] [PMC free article] [PubMed] [Google Scholar]
- 7.Poulin R. 2001. Interactions between species and the structure of helminth communities. Parasitology 122, S3–S11. ( 10.1017/S0031182000016991) [DOI] [PubMed] [Google Scholar]
- 8.Escribano A, Williams T, Goulson D, Cave RD, Chapman JW, Cabellero P. 2001. Consequences of interspecific competition on the virulence and genetic composition of a nucleopolyhedrovirus in Spodoptera frugiperda larvae parasitized by Chelonus insularis. Biocontrol Sci. Technol. 11, 649–662. ( 10.1080/09583150120076193) [DOI] [Google Scholar]
- 9.Brown SP, Hochberg ME, Grenfell BT. 2002. Does multiple infection select for raised virulence? Trends Microbiol. 10, 401–405. ( 10.1016/S0966-842X(02)02413-7) [DOI] [PubMed] [Google Scholar]
- 10.Paul REL, Nu VAT, Krettli AU, Brey PT. 2002. Interspecific competition during transmission of two sympatric malaria parasite species to the mosquito vector. Proc. R. Soc. Lond. B 269, 2551–2557. ( 10.1098/rspb.2002.2171) [DOI] [PMC free article] [PubMed] [Google Scholar]
- 11.Mideo N. 2009. Parasite adaptations to within-host competition. Trends Parasitol. 25, 261–268. ( 10.1016/j.pt.2009.03.001) [DOI] [PubMed] [Google Scholar]
- 12.Telfer S, Lambin X, Birtles R, Beldomenico P, Burthe S, Paterson S, Begon M. 2010. Species interactions in a parasite community drive infection risk in a wildlife population. Science 330, 243–246. ( 10.1126/science.1190333) [DOI] [PMC free article] [PubMed] [Google Scholar]
- 13.Blackwell AD, Martin M, Kaplan H, Gurven M. 2013. Antagonism between two intestinal parasites in humans: the importance of co-infection for infection risk and recovery dynamics. Proc. R. Soc. B 280, 20131671 ( 10.1098/rspb.2013.1671) [DOI] [PMC free article] [PubMed] [Google Scholar]
- 14.Abu-Raddad LJ, Patnaik P, Kublin JG. 2006. Dual infection with HIV and malaria fuels the spread of both diseases in sub-Saharan Africa. Science 314, 1603–1606. ( 10.1126/science.1132338) [DOI] [PubMed] [Google Scholar]
- 15.Lello J, Boag B, Fenton A, Stevenson IR, Hudson PJ. 2004. Competition and mutualism among the gut helminths of a mammalian host. Nature 428, 840–844. ( 10.1038/nature02472.1) [DOI] [PubMed] [Google Scholar]
- 16.Pollitt LC, Churcher TS, Dawes EJ, Khan SM, Sajid M, Basáñez MG, Colegrave N, Reece SE. 2013. Costs of crowding for the transmission of malaria parasites. Evol. Appl. 6, 617–629. ( 10.1111/eva.12048) [DOI] [PMC free article] [PubMed] [Google Scholar]
- 17.Taylor LH, Walliker D, Read AF. 1997. Mixed-genotype infections of the rodent malaria Plasmodium chabaudi are more infectious to mosquitoes than single-genotype infections. Parasitology 115, 121–132. ( 10.1017/S0031182097001145) [DOI] [PubMed] [Google Scholar]
- 18.Chao L, Hanley KA, Burch CL, Dahlberg C, Turner PE. 2000. Kin selection and parasite evolution: higher and lower virulence with hard and soft selection. Q. Rev. Biol. 75, 261–275. ( 10.1086/393499) [DOI] [PubMed] [Google Scholar]
- 19.Thomas MB, Watson EL, Valverde-Garcia P. 2003. Mixed infections and insect–pathogen interactions. Ecol. Lett. 6, 183–188. ( 10.1046/j.1461-0248.2003.00414.x) [DOI] [Google Scholar]
- 20.Ben-Ami F, Rigaud T, Ebert D. 2011. The expression of virulence during double infections by different parasites with conflicting host exploitation and transmission strategies. J. Evol. Biol. 24, 1307–1316. ( 10.1111/j.1420-9101.2011.02264.x) [DOI] [PubMed] [Google Scholar]
- 21.Lohr JN, Yin M, Wolinska J. 2010. Prior residency does not always pay off—co-infections in Daphnia. Parasitology 137, 1493–1500. ( 10.1017/S0031182010000296) [DOI] [PubMed] [Google Scholar]
- 22.Jackson JA, Pleass RJ, Cable J, Bradley JE, Tinsley RC. 2006. Heterogeneous interspecific interactions in a host–parasite system. Int. J. Parasitol. 36, 1341–1349. ( 10.1016/j.ijpara.2006.07.003) [DOI] [PubMed] [Google Scholar]
- 23.Karvonen A, Seppälä O, Tellervo Valtonen E. 2009. Host immunization shapes interspecific associations in trematode parasites. J. Anim. Ecol. 78, 945–952. ( 10.1111/j.1365-2656.2009.01562.x) [DOI] [PubMed] [Google Scholar]
- 24.Alford RA, Wilbur HM. 1985. Priority Effects in experimental pond communities: competition between Bufo and Rana. Ecology 66, 1097–1105. ( 10.2307/1939161) [DOI] [Google Scholar]
- 25.Hoverman JT, Hoye BJ, Johnson PTJ. 2013. Does timing matter? How priority effects influence the outcome of parasite interactions within hosts. Oecologia 173, 1471–1480. ( 10.1007/s00442-013-2692-x) [DOI] [PubMed] [Google Scholar]
- 26.Haag K, Traunecker E, Ebert D. 2013. Single-nucleotide polymorphisms of two closely related microsporidian parasites suggest a clonal population expansion after the last glaciation. Mol. Ecol. 22, 314–326. ( 10.1111/mec.12126) [DOI] [PubMed] [Google Scholar]
- 27.Keeling P, Fast N. 2002. Microsporidia: biology and evolution of highly reduced intracellular parasites. Annu. Rev. Microbiol. 56, 93–116. ( 10.1146/annurev.micro.56.012302.160854) [DOI] [PubMed] [Google Scholar]
- 28.Texier C, Vidau C, Viguès B, El Alaoui H, Delbac F. 2010. Microsporidia: a model for minimal parasite-host interactions. Curr. Opin. Microbiol. 13, 443–449. ( 10.1016/j.mib.2010.05.005) [DOI] [PubMed] [Google Scholar]
- 29.Higes M, Martín-Hernández R, Meana A. 2010. Nosema ceranae in Europe: an emergent type C. nosemosis. Apidologie 41, 375–392. ( 10.1051/apido/2010019) [DOI] [Google Scholar]
- 30.Higes M, Meana A, Bartolomé C, Botías C, Martín-Hernández R. 2013. Nosema ceranae (Microsporidia), a controversial 21st century honey bee pathogen. Environ. Microbiol. Rep. 5, 17–29. ( 10.1111/1758-2229.12024) [DOI] [PubMed] [Google Scholar]
- 31.Paxton R, Klee J, Korpela S, Fries I. 2007. Nosema ceranae has infected Apis mellifera in Europe since at least 1998 and may be more virulent than Nosema apis. Apidologie 38, 558–565. ( 10.1051/apido:2007037) [DOI] [Google Scholar]
- 32.Fries I, Feng F, da Silva A, Slemenda SB, Pieniazek NJ. 1996. Nosema ceranae n. sp. (Microspora, Nosematidae), morphological and molecular characterization of a microsporidian parasite of the Asian honey bee Apis cerana (Hymenoptera, Apidae). Eur. J. Protistol. 32, 356–365. ( 10.1016/S0932-4739(96)80059-9) [DOI] [Google Scholar]
- 33.Fries I. 2010. Nosema ceranae in European honey bees (Apis mellifera). J. Invertebr. Pathol. 103, S73–S79. ( 10.1016/j.jip.2009.06.017) [DOI] [PubMed] [Google Scholar]
- 34.Gisder S, Hedtke K, Möckel N, Frielitz MC, Linde A, Genersch E. 2010. Five-year cohort study of Nosema spp. in Germany: does climate shape virulence and assertiveness of Nosema ceranae? Appl. Environ. Microbiol. 76, 3032–3038. ( 10.1128/aem.03097-09) [DOI] [PMC free article] [PubMed] [Google Scholar]
- 35.Forsgren E, Fries I. 2013. Temporal study of Nosema spp. in a cold climate. Environ. Microbiol. Rep. 5, 78–82. ( 10.1111/j.1758-2229.2012.00386.x) [DOI] [PubMed] [Google Scholar]
- 36.Fries I, et al. 2013. Standard methods for Nosema research. J. Apic. Res. 52, 1–28. ( 10.3896/IBRA.1.52.1.14) [DOI] [PMC free article] [PubMed] [Google Scholar]
- 37.Malone LA, Stefanovic D. 1999. Comparison of the responses of two races of honeybees to infection with Nosema apis Zander. Apidologie 30, 375–382. ( 10.1051/apido:19990503) [DOI] [Google Scholar]
- 38.Forsgren E, Fries I. 2010. Comparative virulence of Nosema ceranae and Nosema apis in individual European honey bees. Vet. Parasitol. 170, 212–217. ( 10.1016/j.vetpar.2010.02.010) [DOI] [PubMed] [Google Scholar]
- 39.Huang WF, Solter LF. 2013. Comparative development and tissue tropism of Nosema apis and Nosema ceranae. J. Invertebr. Pathol. 113, 35–41. ( 10.1016/j.jip.2013.01.001) [DOI] [PubMed] [Google Scholar]
- 40.Fries I. 1988. Infectivity and multiplication of Nosema apis Z. in the ventriculus of the honey bee. Apidologie 19, 319–328. ( 10.1051/apido:19880310) [DOI] [Google Scholar]
- 41.VanEngelsdorp D, et al. 2009. Colony collapse disorder: a descriptive study. PLoS ONE 4, e6481 ( 10.1371/journal.pone.0006481) [DOI] [PMC free article] [PubMed] [Google Scholar]
- 42.Field A, Miles J, Field Z. 2012. Discovering statistics using R, 1st edn London, UK: Sage. [Google Scholar]
- 43.Bates D, Maechler M. 2009. lme4: Linear mixed-effects modles using S4 classes, R package version 1.1-7 See http://www.CRAN.R-project.org/package=lme4.
- 44.Hothorn T, Bretz F, Westfall P. 2008. Simultaneous inference in general parametric models. Biom. J. 50, 346–363. ( 10.1002/bimj.200810425) [DOI] [PubMed] [Google Scholar]
- 45.Higes M, et al. 2008. How natural infection by Nosema ceranae causes honeybee colony collapse. Environ. Microbiol. 10, 2659–2669. ( 10.1111/j.1462-2920.2008.01687.x) [DOI] [PubMed] [Google Scholar]
- 46.Higes M, Martín R, Meana A. 2006. Nosema ceranae, a new microsporidian parasite in honeybees in Europe. J. Invertebr. Pathol. 92, 93–95. ( 10.1016/j.jip.2006.02.005) [DOI] [PubMed] [Google Scholar]
- 47.Pilarska DK, Solter LF, Kereselidze M, Linde A, Hoch G. 2006. Microsporidian infections in Lymantria dispar larvae: interactions and effects of multiple species infections on pathogen horizontal transmission. J. Invertebr. Pathol. 93, 105–113. ( 10.1016/j.jip.2006.05.003) [DOI] [PubMed] [Google Scholar]
- 48.Hoch G, Schopf A, Maddox J. 2000. Interactions between an Entomopathogenic Microsporidium and the Endoparasitoid Glyptapanteles liparidis within their host, the gypsy moth larva. J. Invertebr. Pathol. 75, 59–68. ( 10.1006/jipa.1999.4894) [DOI] [PubMed] [Google Scholar]
- 49.Malakar R, Elkinton JS, Hajek AE, Burand JP. 1999. Within-host interactions of Lymantria dispar (Lepidoptera: Lymantriidae) nucleopolyhedrosis virus and Entomophaga maimaiga (Zygomycetes: Entomophthorales). J. Invertebr. Pathol. 73, 91–100. ( 10.1006/jipa.1998.4806) [DOI] [PubMed] [Google Scholar]
- 50.Higes M, García-Palencia P, Martín-Hernández R, Meana A. 2007. Experimental infection of Apis mellifera honeybees with Nosema ceranae (Microsporidia). J. Invertebr. Pathol. 94, 211–217. ( 10.1016/j.jip.2006.11.001) [DOI] [PubMed] [Google Scholar]
- 51.Graham AL. 2008. Ecological rules governing helminth-microparasite coinfection. Proc. Natl. Acad. Sci. USA 105, 566–570. ( 10.1073/pnas.0707221105) [DOI] [PMC free article] [PubMed] [Google Scholar]
- 52.de Roode JC, Helinski MEH, Anwar MA, Read AF. 2005. Dynamics of multiple infection and within-host competition in genetically diverse malaria infections. Am. Nat. 166, 531–542. ( 10.1086/491659) [DOI] [PubMed] [Google Scholar]
- 53.Dussaubat C, et al. 2012. Gut pathology and responses to the microsporidium Nosema ceranae in the honey bee Apis mellifera. PLoS ONE 7, e37017 ( 10.1371/journal.pone.0037017) [DOI] [PMC free article] [PubMed] [Google Scholar]
- 54.Martín-Hernández R, Botías C, Barrios L, Martínez-Salvador A, Meana A, Mayack C, Higes M. 2011. Comparison of the energetic stress associated with experimental Nosema ceranae and Nosema apis infection of honeybees (Apis mellifera). Parasitol. Res. 109, 605–612. ( 10.1007/s00436-011-2292-9) [DOI] [PubMed] [Google Scholar]
- 55.Williams GR, Shutler D, Burgher-MacLellan KL, Rogers REL. 2014. Infra-population and -community dynamics of the parasites Nosema apis and Nosema ceranae, and consequences for honey bee (Apis mellifera) hosts. PLoS ONE 9, e99465 ( 10.1371/journal.pone.0099465) [DOI] [PMC free article] [PubMed] [Google Scholar]
- 56.Antúnez K, Martín-Hernández R, Prieto L, Meana A, Zunino P, Higes M. 2009. Immune suppression in the honey bee (Apis mellifera) following infection by Nosema ceranae (Microsporidia). Environ. Microbiol. 11, 2284–2290. ( 10.1111/j.1462-2920.2009.01953.x) [DOI] [PubMed] [Google Scholar]
- 57.Martín-Hernández R, Botías C, Bailón EG, Martínez-Salvador A, Prieto L, Meana A, Higes M. 2012. Microsporidia infecting Apis mellifera: coexistence or competition. Is Nosema ceranae replacing Nosema apis? Environ. Microbiol. 14, 2127–2138. ( 10.1111/j.1462-2920.2011.02645.x) [DOI] [PubMed] [Google Scholar]
- 58.Fernández JM, Puerta F, Cousinou M, Dios-Palomares R, Campano F, Redondo L. 2012. Asymptomatic presence of Nosema spp. in Spanish commercial apiaries. J. Invertebr. Pathol. 111, 106–110. ( 10.1016/j.jip.2012.06.008) [DOI] [PubMed] [Google Scholar]
- 59.Meixner MD, et al. 2014. Occurrence of parasites and pathogens in honey bee colonies used in a European genotype–environment interactions experiment. J. Apic. Res. 53, 215–219. ( 10.3896/IBRA.1.53.2.04) [DOI] [Google Scholar]
- 60.Klee J, et al. 2007. Widespread dispersal of the microsporidian Nosema ceranae, an emergent pathogen of the western honey bee, Apis mellifera. J. Invertebr. Pathol. 96, 1–10. ( 10.1016/j.jip.2007.02.014) [DOI] [PubMed] [Google Scholar]
Associated Data
This section collects any data citations, data availability statements, or supplementary materials included in this article.