

Abstract
We examined two novel hypotheses: (1) that orthostatic tolerance (OT) would be prolonged when hyperventilatory-induced hypocapnia (and hence cerebral hypoperfusion) was prevented; and (2) that pharmacological reductions in cerebral blood flow (CBF) at baseline would lower the ‘CBF reserve’, and ultimately reduce OT. In study 1 (n = 24; aged 25 ± 4 years) participants underwent progressive lower-body negative pressure (LBNP) until pre-syncope; end-tidal carbon dioxide ( ) was clamped at baseline levels (isocapnic trial) or uncontrolled. In study 2 (n = 10; aged 25 ± 4 years), CBF was pharmacologically reduced by administration of indomethacin (INDO; 1.2 mg kg−1) or unaltered (placebo) followed by LBNP to pre-syncope. Beat-by-beat measurements of middle cerebral artery blood flow velocity (MCAv; transcranial Doppler), heart rate (ECG), blood pressure (BP; Finometer) and end-tidal gases were obtained continuously. In a subset of subjects’ arterial-to-jugular venous differences were obtained to examine the independent impact of hypocapnia or cerebral hypoperfusion (following INDO) on cerebral oxygen delivery and extraction. In study 1, during the isocapnic trial,
  was successfully clamped at baseline levels at pre-syncope (38.3 ± 2.7 vs. 38.5 ± 2.5 mmHg respectively; P = 0.50). In the uncontrolled trial,
  at pre-syncope was reduced by 10.9 ± 3.9 mmHg (P ≤ 0.001). Compared to the isocapnic trial, the decline in mean MCAv was 15 ± 4 cm s−1 (35%; P ≤ 0.001) greater in the uncontrolled trial, yet the time to pre-syncope was comparable between trials (544 ± 130 vs. 572 ± 180 s; P = 0.30). In study 2, compared to placebo, INDO reduced resting MCAv by 19 ± 4 cm s−1 (31%; P ≤ 0.001), but time to pre-syncope remained similar between trials (placebo: 1123 ± 138 s vs. INDO: 1175 ± 212 s; P = 0.53). The brain extracted more oxygen in face of hypocapnia (34% to 53%) or cerebral hypoperfusion (34% to 57%) to compensate for reductions in delivery. In summary, cerebral hypoperfusion either at rest or induced by hypocapnia at pre-syncope does not impact OT, probably due to a compensatory increase in oxygen extraction.
Introduction
Syncope is a transient, sudden loss of consciousness and postural tone, which is often but not always preceded by pre-syncopal symptoms (e.g. visual disturbances, dizziness, nausea (Stewart, 2013). Postural vasovagal syncope is the most common form and usually occurs in the presence of orthostatic hypotension; irrespective of the condition provoking syncope onset, loss of consciousness is fundamentally due to cerebral hypoperfusion and inadequate cerebral oxygenation (Van Lieshout et al. 2003; Thomas et al. 2009b). Currently, the exact pathophysiological mechanisms influencing cerebral hypoperfusion and syncope onset are unknown, but are multifactorial. Vasovagal syncope is frequently associated with hyperventilation, which has been reported in the pathophysiology of syncope (Saltzman et al. 1963; Grubb et al. 1991; Martinon Torres et al. 2001; Van Lieshout et al. 2003; Porta et al. 2008). Furthermore, hypotension induced by postural (LeLorier et al. 2003; Convertino et al. 2009) and pharmacological (Stewart et al. 2011) methods in healthy individuals, has been shown to stimulate hyperventilation and the development of hypocapnia, and is thought to be evoked at least in part by ventilatory–baroreflex interactions (Stewart et al. 2011).
The cerebral vasculature is highly sensitive to changes in the partial pressure of arterial carbon dioxide ( ), such that hypocapnia causes increased cerebral vascular resistance and decreased cerebral blood flow (CBF) (Willie et al. 2012). Hypocapnia induced cerebral hypoperfusion has been associated with orthostatic intolerance (Novak et al. 1998; Serrador et al. 2006). There is evidence to suggest that hyperventilatory-induced hypocapnia during head up tilt (HUT) causes vasodepression, i.e. reduced vascular resistance and hence blood pressure (BP; Thijs et al. 2008), which could ultimately impact orthostatic tolerance (OT). In contrast, in postural tachycardia syndrome (POTS), there is evidence that sustained hypocapnia and cerebral ischaemia produce sympathoexcitation, tachycardia, and consequent elevations in blood pressure (Del Pozzi et al. 2014). However, only a few studies have noted the effect of
  on OT time. Breathing 5% CO2 has been shown to improve OT by ∼10%, and it was speculated that this improvement in OT was attributed to a delayed reduction in CBF by way of elevated resting CBF (although CBF was not measured; Howden et al. 2004). Blaber et al. (2001) found that maintaining end-tidal carbon dioxide (
 ) at baseline levels during upright tilt did not eliminate cerebral hypoperfusion; however, in four out of the five individuals who experienced pre-syncope onset, OT was improved. This improvement in tolerance time was associated with a higher resting middle cerebral artery velocity (MCAv). Given that the orthostatic challenge adopted by Blaber et al. (2001) consisted of a series of six 10-min 90 deg HUTs, pre-syncope was not induced in a controlled manner; therefore, whether the prevention of hypocapnia during orthostatic stress improves OT, still remains to be quantified in a larger sample size with more sustained orthostatic stress and control of
  .
.
It has been noted over 50 years ago that the development of syncope and symptoms of cerebral ischaemia develop when CBF is reduced below a critical threshold of ∼35% below resting values, irrespective of a wide variation in BP (−19% to −64%; e.g. Finnerty et al. 1954). McHenry et al. (1961) in an elderly and hypertension population associated this critical level of cerebral hypoperfusion with a reduction in cerebral oxygen delivery. As highlighted above, CO2 supplementation has been show to improve OT which was suggested to be mediated via an elevation in resting MCAv and thus a heightened ‘cerebral reserve’ (i.e. difference between baseline CBF and the flow evident at syncope; Howden et al. 2004). Somewhat consistent with this notion, others have reported a ∼22% decline in OT in the morning compared to the evening, partly due to a lower CBF reserve as reflected by a 15% lower morning resting MCAv (Lewis et al. 2010). These findings suggest cerebral hypoperfusion at rest can negatively impact OT, yet the importance of resting CBF per se in the pathophysiology of OT, has not been clearly explicated. More specifically, and of relevance to this study, it is currently unknown how the level of hypocapnia associated with hyperventilation preceding syncope, and therefore associated cerebral hypoperfusion, influences cerebral oxygen delivery independently of the development of hypotension.
In two main investigations, we aimed to independently examine the effects of hyperventilatory-induced hypocapnia and cerebral hypoperfusion on OT. Study 1 aimed to examine the contribution of hypocapnia-induced cerebral hypoperfusion on OT. To address this question,  was clamped at baseline values via an end-tidal forcing approach during progressive lower body negative pressure (LBNP) to pre-syncope. We hypothesized that tolerance time to progressive LBNP would be longer when hyperventilatory-induced hypocapnia was prevented. Study 2 investigated the influence of cerebral hypoperfusion on OT. We achieved this by pharmacological manipulation of resting CBF with administration of indomethacin (INDO; a non-selective cyclooxygenase 1 and 2 inhibitor). Indomethacin at clinically relevant doses (as given in this study) lowers CBF by 25–40% (Markus et al. 1994; Bruhn et al. 2001) without concomitant changes in metabolic rate (Hohimer et al. 1985; Kraaier et al. 1992), plasma catecholamines (Wennmalm et al. 1984) or arterial CO2 (
 ; Fan et al. 2010, 2011). We hypothesized that the administration of INDO would lower the ‘CBF reserve’, and ultimately reduce OT. In a subset of subjects, arterial-to-jugular venous differences were obtained to examine the independent impact of hypocapnia (matched to individual levels measured in study 1) and cerebral hypoperfusion (prior to and following INDO as per study 2) on cerebral oxygen delivery and extraction.
Methods
Ethical approval and screening
Studies 1 and 2 were approved by the Human Ethics Committee of the University of British Columbia, and conformed to the standards set by the Declaration of Helsinki. All subjects provided written informed consent. Participants were non-smokers, had no previous history of cardiovascular, cerebrovascular or respiratory diseases, and were not taking any cardiovascular medications. All participants reported no past episodes of syncope and/or related symptoms in their normal daily lives within the last 6 months. Room temperature was maintained at 22–23°C, and experimental testing began after 12-h abstinence from alcohol, caffeine, and strenuous exercise, and at least a 4-h fast. Experimental testing took place between 10.00 h and 16.00 h. Female participants were tested in the early follicular phase (day 1–7) of the menstrual cycle – day 1 being the first day of menstruation, or during menstruation of the pill withdrawal phase (day 2–7). All participants underwent a familiarization session of the experimental procedures and protocol on a separate day (≥24 h) prior to their initial assessment.
Experimental design
Study 1
Twenty-four (12 males; 12 females) healthy participants with a mean ± standard deviation (SD) age of 25 ± 4 years, body mass 69 ± 11 kg, height 178 ± 8 cm, and body mass index 23.2 ± 3.3 kg m–2 participated in this study. The design was a two-trial, counterbalanced experiment involving progressive (LBNP until pre-syncope, with  and end-tidal oxygen (
 ) clamped at baseline levels (isocapnia condition) or uncontrolled (poikilocapnic condition). Following instrumentation and ≥20 min of supine rest, participants engaged in a supine LBNP protocol. Lower body suction was applied in −20 mmHg incremental steps, each lasting 2 min, until −100 mmHg was reached, after which −100 mmHg was continued until pre-syncope onset (see ‘Determination of pre-syncope and orthostatic tolerance’ below). Following ≥1 h and 20 min of supine rest, participants underwent the LBNP again under the different condition.
Study 1B (hypocapnic challenge)
A subset of the recruited participants (n = 5; 28 ± 3 years) underwent an additional protocol to examine the response of hypocapnia, independent of systemic hypotension on CBF regulation. Invasive arterial–jugular venous differences and volumetric CBF measures were made to directly calculate alterations in oxygen delivery and extraction. A 20 gauge peripheral intravenous catheter and 20 gauge radial artery catheter were inserted following local anaesthesia with 1% lidocaine. Ultrasound was used to identify the internal jugular vein and assist with the cannulation of the vein. A jugular bulb catheter (Edwards, Seattle, WA, USA) was placed in the right internal jugular vein by the Seldinger technique and directed cephalad under sterile conditions. Following 15 min of supine rest, individuals were instructed to hyperventilate at their desired combination of frequency and tidal volume to induce a steady-state (>5 min) level hypocapnia ( : ∼23 ± 5 mmHg) equivalent to the level experienced in the syncope trial (study 1). Intra-arterial blood pressure and velocity in the middle (MCAv) and posterior cerebral artery (PCAv) were measured continuously (see ‘Measurements’ section for more details). Global CBF (gCBF) was estimated via diameter and blood velocity recordings in the left internal carotid artery and right vertebral artery obtained using a 10 MHz multifrequency linear array probe attached to a high-resolution ultrasound machine (Terason 3000, Teratech, Burlington, MA, USA; see Willie et al. (2012) for further details regarding ultrasound data collection and analysis). Imaging of the extracranial arteries commenced when end-tidal clamping was stable. Arterial and venous blood gas samples from the radial artery and jugular catheter, respectively, were drawn simultaneously near the end of the step change in
  into a preheparinized syringe, and immediately analysed. Following standardised calibration, all blood samples were analysed using an arterial blood-gas analysing system (ABL-90 Co-Ox, Radiometer, Copenhagen, Denmark) for
  ,
,  and arterial oxygen saturation. Global CBF, arterial oxygen delivery, venous content of oxygen, cerebral delivery of oxygen (CDO2), cerebral oxygen extraction (CO2 extraction) were calculated (see Ainslie et al. 2014 for detailed calculations).
Study 2
In study 2, pharmacological manipulation of CBF, independent of changes in  , was achieved by ingesting INDO (1.2 mg kg−1; or a placebo) 90 min before undergoing a progressive LBNP protocol to pre-syncope. Ten healthy males with a mean ± SD age of 25 ± 4 years, body mass 71 ± 10 kg, height 173 ± 10 cm, and body mass index 23.2 ± 3.3 kg m–2, took part in this randomized, placebo controlled experiment. Participants attended the laboratory on two occasions, occurring at the same time of the day (separated by ≥24 h) and followed the same experimental procedures. Following capsule ingestion, instrumentation and ≥20 min of supine rest, participants engaged in a supine LBNP protocol: LBNP was applied in 6 min stages at −25, −50, −75 and −100 mmHg until pre-syncope (see ‘Determination of pre-syncope and orthostatic tolerance’ below). This LBNP protocol differed slightly from study 1 in order to elicit a more sustained orthostatic stimuli to ensure steady state was achieved at each level so that the cardiorespiratory and cerebrovascular reflexes could fully develop. This is unlikely to be a major limitation given the within-experimental comparison.
Study 2B
To examine the effect of INDO on CBF regulation at rest, invasive arterial–jugular venous differences were measured (n = 4; 26 ± 6 years; same procedures as detailed in study 1B) to directly calculate alterations in  ,
,  and arterial oxyhaemoglobin saturation, arterial oxygen delivery, CDO2, and O2 extraction. Following 15 min of supine rest prior to and 90 min following INDO ingestion (1.2 mg kg−1), arterial and venous blood gas samples were simultaneously drawn from the radial artery and jugular catheter respectively, into a preheparinized syringe and analysed immediately.
Determination of pre-syncope and orthostatic tolerance
In line with previous research (Levine et al. 1994; Thomas et al. 2009b; Lewis et al. 2010, 2012), pre-syncope and OT was defined by a sustained drop in systolic BP <80 mmHg for more than 10 s or on participants request due to one or more subjective presyncopal symptoms becoming intolerable (feelings of dizziness, nausea, faintness, visual disturbances, hearing disturbances, and fatigue). Pre-syncopal symptoms were recorded using a validated questionnaire (Thomas et al. 2009b) immediately after the cession of the experimental protocol. Participants were asked to rate their symptoms based upon a visual scale from 1 to 10 (1 being no symptoms to 10 being intolerable), for the period related to the end of the challenge or at the point of pre-syncope. Orthostatic tolerance was determined as the time elapsed before termination of the LBNP.
Measurements
Beat-to-beat measurements of MCAv and PCAv, were acquired using a 2-MHz pulsed transcranial Doppler ultrasound system (Spencer Technologies, Seattle, WA, USA). Using search methods described elsewhere (Willie et al. 2011), the Doppler probe was maintained in position, at a fixed angle, using a commercially available fixation headframe (Marc 600; Spencer Technologies). Stroke volume (SV) and cardiac output (CO) were calculated from the BP waveform obtained from finger photoplethysmography using the Modelflow method, incorporating age, sex, height, and weight (BeatScope 1.0 software; TNO TPD; Biomedical Instruments, Amsterdam, The Netherlands) (Wesseling et al. 1993). Total peripheral resistance index (TPRi) was calculated from mean arterial BP (MAP/CO). Cerebrovascular resistance index (CVRi) was calculated as MAP/MCAv. Cerebrovascular vascular conductance index (CVCi) was calculated as MCAv or PCAv/MAP.
For measurement of  and
and  , subjects breathed through a mouthpiece and two-way non-rebreathing valve. Respired gas pressures were sampled at the mouth by securing a calibrated online gas analyser (model ML206, AD Instruments, Colorado Springs, CO, USA) into the mouthpiece and respiratory flow was measured at the mouth using a pneumotachograph (model HR 800L, HansRudolph, Shawnee, KS, USA).
End-tidal forcing for study 1 was achieved as described in depth elsewhere (Bain et al. 2013; Foster et al. 2014) In brief, on a breath-by-breath bases,  ,
,  , inspiratory and expiratory tidal volume were determined online using specifically designed software (LabView, Austin, TX, USA), and
  and
and  were controlled by a portable end-tidal forcing system (AirForce, GE Foster, Kelowna, BC, Canada). This system uses independent gas solenoid valves for oxygen, carbon dioxide, and nitrogen and controls the volume of each gas being delivered to the inspiratory reservoir through a mixing-and-humidification chamber. With use of feedback information regarding
  ,
,  , and inspiratory and expiratory tidal volume, the system prospectively targets the inspirate to bring end-tidal gas to the desired level. Gas control was fine-tuned using a feedback control and error reduction algorithms. Clamped
  and
and  levels were determined as the values measured during the last 5 min of baseline measurements. The experimental protocol during the end-tidal clamped trial did not start until ≥3 min into clamping to ensure that
  ,
,  , MCAv and PCAv had reached steady state. All data were sampled continuously at 200 Hz using an analogue–digital converter (PowerLab/16SP ML795; ADInstruments, Colorado Springs, CO, USA) interfaced with a computer and displayed in real time during testing. Data were stored for subsequent off-line analysis using the commercially available LabChart software (version 7.3.7; ADInsturments). Baseline values represent a 1-min average prior to LBNP, and pre-syncope values represent a 10 s average prior to the termination of the test protocol.
Statistical analysis
All data were analysed using SPSS (version 21, Surrey, UK) and expressed as mean ± SD. Statistical significance was defined as P ≤ 0.05.
Study 1
Trial differences in OT were determined using a one-tailed paired t test. Two-way repeated measures ANOVA was used to examine the interaction between any time point (baseline vs. pre-syncope) and experimental condition (unclamped vs. clamped trials). In the event of any significant interaction, paired t tests were then used (provided the data was normally distributed). A two-way repeated measures ANOVA was used to explore the interaction between sex (males vs. female) on OT and the time course change (baseline vs. syncope). In study 1B, within-study differences between normocapnia and hypocapnia were assessed via a paired t test, provided data were normally distributed.
Study 2
A two-way repeated measure ANOVA was used to explore the interaction between the experimental trial (placebo vs. INDO) and time point (baseline vs. pre-syncope). To further explore any significant interaction effects, paired t tests were then employed. In study 2B, pre and post INDO differences were examined via a paired t test.
Based on the sample size (n = 5 in study 1B, and n = 4 in study 2B), and the effect size (change in cerebral oxygen) with each intervention (hypocapnia or cerebral hypoperfusion), we calculated that a power of 80% would achieve significance if we observed a mean difference of 19% and 10% in cerebral oxygen with hypocapnia (study 1B) and cerebral hypoperfusion induced by INDO (study 2B), respectively. Given that these changes were observed (and exceeded) in studies 1B and 2B and significance was observed, we feel that despite the small sample size in these studies, the effect size of the intervention was suitable.
Results
Study 1 – effect of hypocapnia on orthostatic tolerance
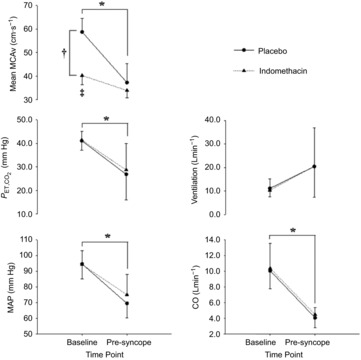
In the isocapnia trial,  was successfully maintained at baseline levels at pre-syncope (38.3 ± 2.7 mmHg vs. 38.5 ± 2.5 mmHg, respectively; P = 0.50; Fig.2), whereas in the uncontrolled trial
  dropped from 37.2 ± 2.7 mmHg at baseline to 26.3 ± 5.9 mmHg at pre-syncope (P < 0.001; Fig.2). Tolerance time in the isocapnic trial (572 ± 180 s) was not significantly different from the unclamped trial (544 ± 130 s; P = 0.30; Fig.1A). Several significant main effects between baseline and pre-syncope were evident, independent of experimental trial, when compared with baseline: reductions in MAP (−20%), mean MCAv (−21%), mean PCAv (−19%), CO (−61%), and SV (−24%) and an elevation in HR (+87%) were evident at pre-syncope (P ≤ 0.003; Table1 and Fig.2).
Figure 2. Mean change in cardiorespiratory variables and cerebral blood flow velocity with pre-syncope in study 1.
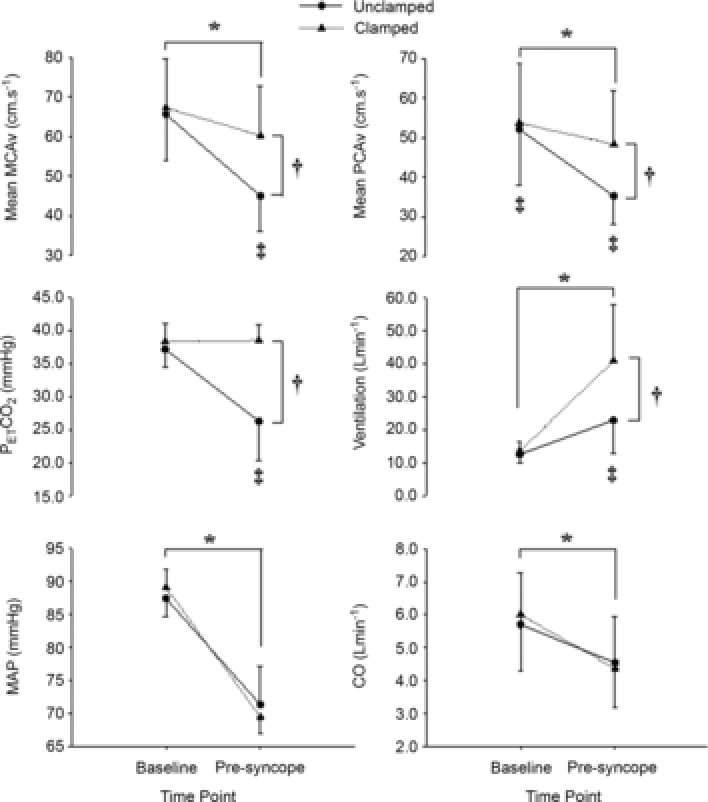
Mean change in mean middle cerebral artery (MCAv) and posterior cerebral artery (PCAv) blood flow velocity, end-tidal carbon dioxide ( ), minute ventilation, mean arterial blood pressure (MAP) and cardiac output (CO) from baseline to pre-syncope in study 1. *Main effect for time, independent of experimental trial; baseline significantly different from pre-syncope (P < 0.0001). †Main effect for experimental trial, independent of time point; clamped trial significantly different from unclamped trial (P < 0.0001). ‡Significant interaction between time point and experimental trial; mean PCAv in the clamped trial significantly different from the unclamped trial at baseline; mean PCAv, mean MCAv and
  in the clamped trial were significantly different from the unclamped trial at pre-syncope (P < 0.0001).
Figure 1. Mean tolerance time to pre-syncope in study 1.
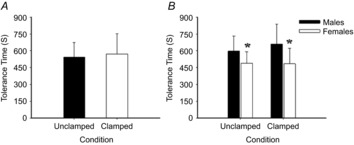
Mean tolerance time to pre-syncope in the unclamped (uncontrolled) and clamped (normocapnic) trials (A), and comparison between sexes (B). *Significant main effect for sex; females significantly lower than males (P = 0.001).
Table 1.
Absolute cardiorespiratory and cerebrovascular measures at baseline and pre-syncope in the unclamped and clamped trail (study 1)
| Baseline |
Pre-syncope |
|||||
|---|---|---|---|---|---|---|
| Variables | Unclamped | Clamped | Unclamped | Clamped | Significance | |
| Cardiovascular | SBP (mmHg) | 120 ± 11 | 123 ± 8 | 90 ± 17 | 93 ± 14 | * |
| DBP (mmHg) | 71 ± 8 | 72 ± 6 | 62 ± 15 | 61 ± 11 | * | |
| TPRi (mmHg l min−1) | 16.7 ± 5.3 | 15.8 ± 4.0 | 16.9 ± 5.5 | 18.5 ± 6.8 | ||
| HR (beats min−1) | 62 ± 11 | 64 ± 11 | 121 ± 26 | 115 ± 25 | * | |
| SV (ml) | 92.4 ± 25.0 | 95.8 ± 26.8 | 37.9 ± 11.1 | 35.8 ± 13.0 | * | |
| Cerebrovascular | SMCAv (cm s−1) | 98 ± 17 | 99 ± 18 | 69 ± 12 | 87 ± 15§ | *,†,‡ |
| DMCAv (cm s−1) | 48 ± 10 | 50 ± 11# | 33 ± 9 | 47 ± 12§ | *,†,‡ | |
| MCA CVRi (mmHg cm s−1) | 1.33 ± 0.24 | 1.30 ± 0.23 | 1.71 ± 0.77 | 1.25 ± 0.37§ | †,‡ | |
| SPCAv (cm s−1) | 79 ± 23 | 81 ± 23# | 54 ± 13 | 70 ± 17§ | *,†,‡ | |
| DPCAv (cm s−1) | 39 ± 10 | 40 ± 11 | 26 ± 6 | 38 ± 12§ | *,†,‡ | |
| PCA CVRi (mmHg cm s−1) | 1.86 ± 0.46 | 1.84 ± 0.43 | 1.81 ± 0.57 | 1.36 ± 0.36§ | †,‡ | |
| Respiratory | Breathing frequency (breaths min−1) | 16 ± 3 | 14 ± 3# | 23 ± 10 | 41 ± 17§ | *,†,‡ |
| Tidal volume (l min−1) | 0.82 ± 0.20 | 0.98 ± 0.21# | 1.15 ± 0.39 | 1.76 ± 0.51§ | *,†,‡ | |
Values are mean ± SD. Abbreviations: SBP, systolic blood pressure; DBP, diastolic blood pressure; TPRi, total peripheral resistance index; SV, stroke volume; SMCAv, systolic middle cerebral artery velocity; DMCAv, diastolic middle cerebral artery velocity; MCA CVRi, middle cerebral artery cerebral vascular resistance index; SPCAv, systolic posterior cerebral artery velocity; DPCAv, diastolic posterior cerebral artery velocity; PCA CVRi, posterior cerebral artery cerebral vascular resistance index.
Significant main effect for measurement point (baseline differs from pre-syncope in both trails; P < 0.0001);
significant main effect for experimental condition (unclamped differs from clamped at baseline and pre-syncope; P < 0.0001);
significant interaction effect (P ≤ 0.001):
baseline difference between experimental conditions,
pre-syncope differs between experimental conditions (P ≤ 0.001).
Significant interaction (P ≤ 0.001) effects between measurement points (baseline vs. pre-syncope) and experimental trial (isocapnia vs. poikilocapnia) were evident; when compared with the poikilocapnic trial, baseline mean PCAv was 2 ± 0 cm s−1 (+4%; P = 0.03) higher in the isocapnic trial (Table1 and Fig.2). At pre-syncope, mean MCAv, MCA CVRi, mean PCAv, PCA CVRi and ventilation were, respectively, 15 ± 4 cm s−1(+34%; P < 0.001), 0.42 ± 0.25 mmHg cm s−1 (+29%; P < 0.001), 13 ± 6 cm s−1 (+37%; P < 0.001), 0.63 ± 0.40 mmHg cm s−1 (+26%; P < 0.001) and 18 ± 17 l min−1 (+200%; P < 0.001) higher in the isocapnic trial, when compared to the uncontrolled trial (Table1 and Fig.2). Overall, pre-syncopal symptoms scores (out of 70) associated with pre-syncope did not differ between the isocapnic trial (26 ± 15) and uncontrolled trials (26 ± 15; P = 0.93).
Sex differences
Compared to males, independent of experimental trial, tolerance time was 30% shorter in females (628 ± 159 s vs. 487 ± 118 s, respectively; P = 0.001; Fig.1B). Independent of time point (baseline vs. pre-syncope), and females had a lower SV (−21.8 ± 9.0 ml; 40%; P < 0.001), CO (−1.6 ± 0.3 l min−1; −36%; P < 0.001),  (−1.8 ± 0.8 mmHg; 5%; P < 0.001), ventilation (−4.5 ± 3.4 l min−1; 5%; P = 0.04), and a higher TPRi (+5.6 ± 1.1 mmHg l min−1; 29%: P = 0.002), when compared with the males (Table2 and Fig.3).
Table 2.
Absolute cardiorespiratory and cerebrovascular measures at baseline and pre-syncope in males and females (study 1)
| Baseline |
Pre-syncope |
|||||
|---|---|---|---|---|---|---|
| Variables | Females | Males | Females | Males | Significance | |
| Cardiovascular | SBP (mmHg) | 119 ± 9 | 124 ± 10 | 91 ± 13 | 91 ± 17 | |
| DBP (mmHg) | 72 ± 7 | 71 ± 7 | 63 ± 12 | 61 ± 15 | ||
| TPRi (mmHg l min−1) | 18.3 ± 4.3 | 14.2 ± 4.1 | 21.3 ± 6.0 | 14.1 ± 3.9 | * | |
| Cerebrovascular | SMCAv (cm s−1) | 100 ± 17 | 96 ± 17 | 82 ± 13 | 75 ± 18 | |
| DMCAv (cm s−1) | 51 ± 11 | 47 ± 10 | 43 ± 11 | 37 ± 14 | ||
| MCA CVRi (mmHg cm s−1) | 1.27 ± 0.19 | 1.38 ± 0.26 | 1.34 ± 0.38 | 1.47 ± 0.54 | ||
| SPCAv (cm s−1) | 81 ± 21 | 78 ± 25 | 62 ± 13 | 62 ± 20 | ||
| DPCAv (cm s−1) | 41 ± 10 | 38 ± 11 | 33 ± 9 | 31 ± 13 | ||
| PCA CVRi (mmHg cm s−1) | 1.77 ± 0.34 | 1.94 ± 0.52 | 1.81 ± 0.48 | 2.01 ± 0.87 | ||
| Respiratory | Ventilation (l min−1) | 12.2 ± 3.1 | 13.9 ± 2.1 | 28.4 ± 12.1 | 35.8 ± 19.8 | * |
| Breathing frequency (breaths min−1) | 15 ± 3 | 15 ± 3 | 23 ± 5 | 21 ± 9 | ||
| Tidal volume (l min−1) | 0.85 ± 0.25 | 0.96 ± 0.17 | 1.27 ± 0.44 | 1.64 ± 0.57 | * | |
Values are mean ± SD. Abbreviations: SBP, systolic blood pressure; DBP, diastolic blood pressure; TPRi, total peripheral resistance index; SMCAv, systolic middle cerebral artery velocity; DMCAv, diastolic middle cerebral artery velocity; MCA CVRi, middle cerebral artery cerebral vascular resistance index; SPCAv, systolic posterior cerebral artery velocity; DPCAv, diastolic posterior cerebral artery velocity; PCA CVRi, posterior cerebral artery cerebral vascular resistance index.
Females significantly difference from males (P ≤ 0.04).
Figure 3. Sex differences in the mean change in cardiorespiratory variables and cerebral blood flow velocity with pre-syncope in study 1.
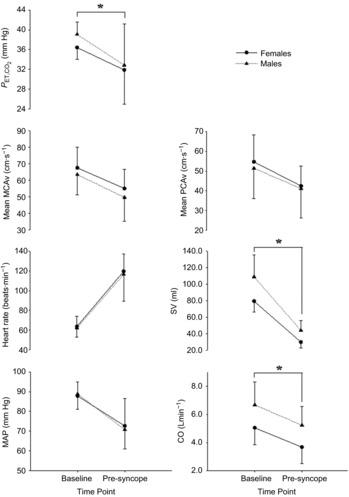
Mean change in mean middle cerebral artery blood flow velocity (MCAv), end-tidal carbon dioxide ( ), minute ventilation, mean arterial blood pressure (MAP), heart rate. Stroke volume (SV) and cardiac output (CO) from baseline to pre-syncope in study 1. *Females significantly different from males.
Study 1B
 at rest (normocapnia) was 40.7 ± 1.8 mmHg and decreased to 22.6 ± 5.0 mmHg following hyperventilation (P = 0.002); these values matched those found at pre-syncope in the poikilocapnic trial of study 1, to within 1–2 mmHg. Compared to normocapnia, gCBF and CDO2 decreased from 40 ± 5 ml min−1 to 25 ± 5 ml min−1 (relative decrease 29%; P = 0.01) and from 108 ± 14 ml·100 g min−1 to 71 ± 15 ml 100 g min−1 (relative decrease 28%; P = 0.02), respectively, whereas cerebral O2 extraction increased from 34 ± 4% to 53 ± 10% (relative increase, 56%; P = 0.02) in response to hypocapnia (Fig.4). In response to hypocapnia, HR increased from 61 ± 7 beats min−1 at rest to 82 ± 7 beats min−1 (P < 0.001), whereas, MCAv and PCAv decreased from 69 ± 10 cm s−1 and 46 ± 3 cm s−1 at rest to 44 ± 5 cm s−1 and 28 ± 6 cm s−1 (P ≤ 0.006), respectively (Fig.4). MAP was unchanged with hypocapnia.
Figure 4. Mean change in cardiorespiratory variables and cerebral blood flow, cerebral delivery of oxygen and cerebral oxygen extraction at rest with hypocapnia in study 1B.
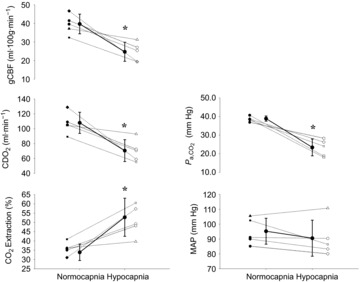
Mean ± SD (continuous line) and individual change (dotted lines) in global cerebral blood flow (gCBF), cerebral delivery of oxygen (CDO2), arterial carbon dioxide ( ), cerebral oxygen (O2) extraction and mean arterial blood pressure (MAP) from normocapnia to hypocapnia in study 1B. *Hypocapnia significantly different from normocapnia (P < 0.001).
Study 2 – role of cerebral perfusion on orthostatic tolerance
At baseline, significant interaction effects between time and experimental trial (P ≤ 0.001) were evident. Baseline mean MCAv was 18 ± 2 cm s−1(31%; P < 0.001) lower in the INDO trial, when compared with the placebo trial (Table3 and Fig.5). However, OT in the placebo trial (1112 ± 144 s) was not significantly different from the INDO trial (1142 ± 200 s; P = 0.74). Significant main effects for time point were evident, independent of experimental trial (placebo vs. INDO). For example, when compared with baseline, decreases in MAP (−23%), mean MCAv (−28%), CO (–58%), SV (−32%) and  (−13.5 ± 7.0 mmHg; 33%) were evident at pre-syncope (P ≤ 0.003; Table3 and Fig.5). At this point, elevations in HR (+113%), TPRi (+86%), and MCVRi (+45%) also occurred.
Table 3.
Absolute cardiorespiratory and cerebrovascular measures at baseline and pre-syncope in the placebo and indomethacin trails (study 2)
| Baseline |
Pre-syncope |
|||||
|---|---|---|---|---|---|---|
| Variables | Placebo | Indomethacin | Placebo | Indomethacin | Significance | |
| Cardiovascular | SBP (mmHg) | 133 ± 14 | 133 ± 14 | 89 ± 10 | 96 ± 15 | * |
| DBP (mmHg) | 76 ± 8 | 74 ± 7 | 60 ± 9 | 64 ± 12 | * | |
| TPRi (mmHg l min−1) | 10.0 ± 2.1 | 10.1 ± 3.5 | 19.3 ± 6.7 | 18.0 ± 4.7 | * | |
| HR (beats min−1) | 56 ± 8 | 51 ± 6 | 116 ± 25 | 111 ± 23 | * | |
| SV (ml) | 67.8 ± 29.7 | 67.4 ± 28.4 | 45.0 ± 7.9 | 47.2 ± 11.1 | * | |
| Cerebrovascular | SMCAv (cm s−1) | 88 ± 9 | 66 ± 6# | 58 ± 7 | 53 ± 3 | *,†,‡ |
| DMCAv (cm s−1) | 44 ± 5 | 27 ± 4# | 27 ± 9 | 25 ± 5 | *,†,‡ | |
| MCA CVRi (mmHg cm s−1) | 1.62 ± 0.20 | 2.37 ± 0.38 | 1.93 ± 0.38 | 2.20 ± 0.30 | * | |
| Respiratory | Breathing frequency (breaths min−1) | 15 ± 4 | 15 ± 4 | 17 ± 6 | 18 ± 6 | |
| Tidal volume (l min−1) | 0.76 ± 0.18 | 0.74 ± 0.20 | 1.21 ± 0.51 | 1.06 ± 0.44 | ||
Values are mean ± SD. Abbreviations: SBP, systolic blood pressure; DBP, diastolic blood pressure; TPRi, total peripheral resistance index; HR, heart rate; SV, stroke volume; SMCAv, systolic middle cerebral artery velocity; DMCAv, diastolic middle cerebral artery velocity; MCA CVRi, middle cerebral artery cerebral vascular resistance index; SPCAv, systolic posterior cerebral artery velocity; DPCAv, diastolic posterior cerebral artery velocity; PCA CVRi, posterior cerebral artery cerebral vascular resistance index.
Significant main effect for measurement point (baseline differs from pre-syncope in both experiment conditions; P < 0.001).
Significant main effect for experimental condition (placebo differs from indomethacin; P < 0.001);
significant interaction effect (P ≤ 0.001):
baseline difference between experimental conditions (P < 0.001).
Figure 5. Mean change in cardiorespiratory variables and cerebral blood flow velocity with pre-syncope in study 2.
Mean change in mean middle cerebral artery blood flow velocity (MCAv), end-tidal carbon dioxide ( ), minute ventilation, mean arterial blood pressure (MAP) and cardiac output (CO) from baseline to pre-syncope in study 2. *Main effect for time, independent of experimental trial; baseline significantly different from pre-syncope (P < 0.0001). †Main effect for experimental trial, independent of time point, clamped trial significantly different from unclamped trial (P < 0.0001). ‡Significant interaction between time point and experimental trial; mean MCAv in the clamped trial was significantly different from the unclamped trial at baseline (P < 0.0001).
Study 2B
Compared to pre-INDO, gCBF and CDO2 decreased by 37% and 36%, respectively, whereas, cerebral O2 extraction increased from 34 ± 3% to 57 ± 4% (relative increase, 68%) post-INDO (P ≤ 0.02; Fig.6). Compared with pre-INDO (68 ± 7 cm s−1), MCAv decreased following INDO (46 ± 8 cm s−1; P < 0.001). Heart rate, MAP and  were unaltered following INDO.
Figure 6. Mean change in cardiorespiratory variables and cerebral blood flow, cerebral delivery of oxygen and cerebral oxygen extraction at rest following indomethacin in study 2B.
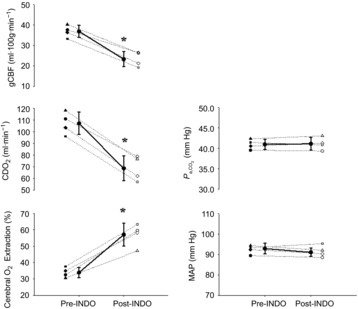
Mean ± SD (continuous line) and individual (dotted lines) baseline change in global cerebral blood flow (gCBF), cerebral delivery of oxygen (CDO2), arterial carbon dioxide ( ), cerebral oxygen (O2) extraction and mean arterial blood pressure (MAP) following administration of indomethacin (NDO); study 2A. *Post-INDO significantly difference from pre-INDO (P < 0.001).
Discussion
The aim of this study was to independently examine the effect of hyperventilatory-induced hypocapnia, and cerebral hypoperfusion at rest on OT. The main finding from study 1 was that, despite a ∼35% greater reduction in cerebral perfusion at pre-syncope in the presence of hypocapnia, OT was not impaired. The mechanism explaining this comparable OT is likely to be a compensatory elevation (∼56%) in cerebral oxygen extraction and/or the effect of hypocapnia and cerebral ischaemia acting to maintain blood pressure (Del Pozzi et al. 2014). Two secondary observations were that: (1) ventilation levels preceding pre-syncope in the isocapnic trial was elevated by ∼76% compared to the uncontrolled trial and; (2) sex differences in OT were apparent, probably due to greater reductions in CO and SV in females rather than CBF regulation. The primary finding of study 2 was that despite a 31% reduction in resting MCAv following INDO ingestion, OT was unaltered. Secondary to this, the cerebral hypoperfusion induced at rest via INDO ingestion is associated with a 68% increase in cerebral oxygen extraction. Collectively, cerebral hypoperfusion either at rest (post-INDO) or induced by hypocapnia at pre-syncope does not influence OT, findings that are attributable to compensatory increases in cerebral O2 extraction.
Effect of hypocapnia on OT
Contrary to our hypothesis, the prevention of hyperventilatory-induced hypocapnia during orthostatic stress did not prolong OT, despite a higher cerebral perfusion at eventual pre-syncope. To our knowledge, only Blaber et al. (2001) have previously investigated the effect of an isocapnic (normocapnic) clamp on OT, and the isocapnic clamp was found to improve OT in four out of five participants, when compared to an uncontrolled condition (poikilocapnic). This improvement was associated with a higher resting MCAv (+18%). In the current study, mean PCAv was 4% higher at rest in the isocapnic trial, yet MCAv was not significantly different, and OT was unaltered. The discrepancy in resting MCAv between the current study and that of Blaber et al. (2001) is perhaps due to the lower sample size, non-steady-state orthostatic stress, and/or methodological issues related to the manual off-line analysis of MCAv (which results in more variability of this measure) employed by Blaber et al.
In the isocapnic trial, blood flow velocity in the MCA and PCA at pre-syncope was ∼34% and 37% higher, respectively, than in the poikilocapnic trial, and this is in agreement with the findings by Blaber et al. (2001) who reported a 28% rise in MCAv at orthostatic intolerance during an isocapnic clamp. It is well known that CBF is highly sensitive to changes in  , and the development of hypocapnia in the absence of hypotension has previously been associated with the onset of syncope and associated symptoms (Naschitz et al. 1997) induced by cerebral hypoperfusion via cerebral vasoconstriction (Kety & Schmidt, 1946; Immink et al. 2013). For example, a 2% reduction in CBF occurs per mmHg reduction in
  , based on volumetric measures of blood flow in the vertebral and internal carotid arteries (as well as MCAv and PCAv; Willie et al. 2012). Compared to the isocapnic trial,
  at pre-syncope was ∼12 mmHg lower in the uncontrolled trial; therefore, based on our previous findings (Willie et al. 2012), although regional differences were not apparent, this decline in
  would account for ∼24% of the decrease in intra-cranial velocity, thus leaving ∼10–13% of the drop in MCAv and PCAv unaccounted for. Interestingly, in the isocapnic trial, the decline in MCAv and PCAv at pre-syncope was 10% and 8%, respectively; therefore, given the successful clamp of
  in this trial, the decline in CBF appears to be attributed to the development of arterial hypotension. It is important to highlight that there is evidence to suggest that the cerebrovascular reactivity to
  has been shown to be diminished with progressive hypotension (Harper & Glass, 1965; Ainslie et al. 2012; Willie et al. 2014), thus the above estimation of
  contribution to the decline in MCAv and PCAv may be overestimated. Together, these findings indicate that hyperventilatory-induced hypocapnia has the ability to lower the CBF threshold for loss of consciousness by ∼66%, yet this contribution does not appear sufficient to provoke syncope onset. It appears that the additional decline in CBF (∼33%) is mediated via the development of hypotension, and this appears to be the most important factor in determining cerebral hypoperfusion preceding syncope (see ‘Cerebral autoregulation’ below).
Heightened ventilation during isocapnic lower body negative pressure
The associated reductions in MAP with progressive LBNP proffered an expected increase in ventilation. Indeed, unloading the baroreflex (i.e. reducing MAP) potentiates the chemoreflex and increases ventilation (Heistad et al. 1974). Compared with the poikilocapnia trial in study 1, ventilation at pre-syncope was ∼18 ± 13 l min−1 (76%; Fig.2) higher in the isocapnia trial; heighten ventilation during orthostatic stress under isocapnia conditions, or following CO2 supplementation has also been reported by Blaber et al. (2001) and Howden et al. (2004). Despite trial differences in background  and ventilation in study 1, the between-trial decline in MAP was identical (Fig.2). These findings can be theoretically explained by similar sympathetic nerve activity (SNA), although of different derivation; that is, the reduction in
  in the poikilocapnic trial would have attenuated the chemoreflex induced SNA (Marshall, 1994). In the isocapnic trial, although the chemoreflex contribution to SNA would have been preserved, the increased ventilation would have elicited a reflex SNA inhibition through pulmonary stretch receptors (Coleridge et al. 1965; Weaver, 1977; Somers et al. 1989). In the end, despite the likely elevated ‘respiratory muscle pump’ with hyperventilation (Miller et al. 2005) the finding of similar MAPs and tolerance times across isocapnic and poikilocapnic conditions suggests that heightened ventilation did not act to improve orthostatic tolerance.
Effect of cerebral perfusion on orthostatic tolerance
In study 2, cerebral hypoperfusion was induced through the administration of INDO and, in agreement with previous reports using a range of imaging modalities (Markus et al. 1994; Kastrup et al. 1999; Bruhn et al. 2001; Ivancev et al. 2009), resting MCAv was reduced by more than 30%. In contrast to our hypothesis, however, this reduced ‘CBF reserve’ at rest did not influence OT. No cardiovascular or respiratory differences between the INDO and placebo trial were evident. The decline in MCAv at pre-syncope was much smaller in the INDO trial (16%) compared with the placebo trial (37%). It is important to highlight that in both trials  levels were intentionally uncontrolled, and individuals became similarly hypocapnic in both trials;
  declined by ∼14 mmHg and ∼13 mmHg in the placebo and INDO trial, respectively. Considering the CO2 reactivity of the MCAv reported by Willie et al. (2012), the degree of hypocapnia in the current study would have contributed to a 28% decline in the MCAv; thus, the remaining 9% decline in MCAv appears to be attributable to arterial hypotension, a finding highly consistent with study 1. Given that the decline in MAP was comparable between the placebo and INDO trials, it may be reasonable to suggest that ∼9% of the pre-syncopal decline in MCAv in the INDO trial was also due to the development of arterial hypotension. It has previously been shown in humans that INDO blunts the cerebrovascular vasoconstrictor response to hypocapnia (Markus et al. 1994; Fan et al. 2010) by ∼40–50%; thus, for the same reduction in
  , the decline in MCAv would be approximately half of that observed in the placebo trial. Additionally, INDO is a potent and reversible cyclooxygenase 1 and 2 enzyme inhibitor that has been shown to increase cerebral vascular resistance (Wennmalm et al. 1984; Hohimer et al. 1985), thus any additive vasoconstriction evoked by the development of hypocapnia was probably blunted following INDO. Moreover, given that cerebral reactivity to changes in
  is blunted with arterial hypotension (Harper & Glass, 1965; Willie et al. 2014) the attenuated contribution of hypocapnia to cerebral hypoperfusion was an expected finding in the INDO trial.
Cerebral autoregulation and orthostatic tolerance
Cerebral autoregulation (CA) is the ability of the cerebrovasculature to compensate for changes in perfusion pressure such that CBF is to some extent buffered against change in MAP (reviewed in Willie et al. 2014). We recently reanalysed 41 studies in healthy humans reporting concurrently steady-steady state changes in MAP and CBF for the slope of the % CBF–% MAP relationship. In the hypotensive range, the average slope was found to be 0.8 ± 0.8 (Numan et al. 2014). The current study is one of the only studies with a large sample size that examined the effect of hypotension on CBF whilst controlling for the confounding influence of both hypocapnia and pharmacological intervention (e.g. Liu et al. 2013). We observed a 0.4% MCAv decrease per mmHg decrease in MAP, half the slope estimated from the reanalysis of all previous studies (Numan et al. 2014). We speculate this to be a function of the influence of vasoactive agents used in the majority of previous studies.
Oxygen delivery, extraction and OT
Following both experiments, on a sub-group of participants, we extended our findings to examine how hypocapnia (severity-matched with study 1 on an individual basis) or cerebral hypoperfusion (prior to and following INDO in study 2) altered cerebral oxygen delivery and extraction. Based on the arterial–venous oxygen differences, the findings were highly consistent: despite reductions in oxygen delivery induced by hypocapnia or cerebral hypoperfusion, the brain extracts more oxygen to compensate for the reduction in delivery. We acknowledge that these measures were only made at rest and extrapolation to pre-syncope should be done cautiously. Nevertheless, we sought to examine the effects of changes in CBF in the absence of other circulatory adjustments induced by LBNP. Although common symptoms of syncope were reported in both study 1 and study 2, no participants lost consciousness due to the ethical cut-off just prior to syncope. Once the capacity of the brain to extract oxygen is maximized, further decreases in oxygen delivery must ultimately result in loss of consciousness. An earlier study documented cerebral oxygen extraction increases from 44% at rest to 77% (McHenry et al. 1961) during profound hypotension. On the basis of this study, it was suggested that once CA capacity is maximized, any further reductions in MAP produce a linear decrease in CBF, after which cerebral oxygen extraction must necessarily compensate for all further decreases in cerebral oxygen delivery (Schumann et al. 1998; Derdeyn et al. 2002). Although the absolute increase in cerebral oxygen extraction with hypocapnia (+19%) and cerebral hypoperfusion (+23%) were less than observed by McHenry et al. (1961) (+33%), it is important to note that, unlike the data of McHenry et al., the current data were taken at rest and in the absence of hypotension. Additionally, because of the older hypertensive (MAP = 156 mmHg) population, lack of  measures, and large BP reduction (75%) at syncope in the study by McHenry et al. (1961)), we must compare the findings cautiously. Nevertheless, the comparable extraction data may indicate that reduction in CBF or oxygen delivery, or both, independent of arterial hypotension, is the key factor that elicits the compensatory elevations in cerebral oxygen extraction.
It would therefore seem possibly that cerebral oxygen extraction maybe potentially be a deciding factor of OT; as soon as oxygen delivery declines and extraction is maximized, loss of consciousness is imminent. On the other hand, given that systemic perfusion pressure (i.e. MAP) is one of the key determinants of cerebral oxygen delivery, it is important to highlight that despite the varied intervention between trials in studies 1 and 2, the decline in MAP was comparable; therefore, the effectiveness of the baroreflex and its influence upon cerebral oxygen delivery (via maintaining cerebral perfusion pressure) may also be a deciding factor of OT. The multifaceted nature (baroreflex effectiveness to maintain perfusion pressure and oxygen delivery vs. compensatory extraction) of vasovagal syncope is clearly highlighted.
Sex-related differences
Consistent with previous findings (el-Bedawi & Hainsworth, 1994; Franke et al. 2003; Fu et al. 2004; Meendering et al. 2005; Fong et al. 2007), a secondary finding of study 1 was that OT was 30% lower in females compared to males (independent of trial condition i.e. conditions of isocapnia or poikilocapnia). In the current study, both females and males at pre-syncope experienced an average CO drop of 1.4 l; however, compared to males, CO was ∼32% lower in the females at rest and at pre-syncope. Since HR was comparable between sexes at both time points, this difference was attributed to females having a lower SV (∼37%), supporting the finding of Fu et al. (2004). Despite the reduction in OT in females, we show for the first time the absence of sex differences in CBF-related parameters, indicating similar cerebrovascular regulation at pre-syncope. This finding is not fully corroborated by Wang et al. (2010), who reported a larger reduction in the PCAv (−24 ± 9%) than in the MCAv (−18 ± 7%) in females during 70 deg HUT despite very small (∼1%) alterations in blood pressure at this point. The findings by Wang et al. (2010) were interpreted to suggest that women have less efficient autoregulation in the PCA compared to the MCA (Wang et al. 2010). This regional difference was not evident in the current study; however, important between-study differences exist. Namely, individuals in the Wang et al. (2010) study were not all taken to pre-syncope, and BP in the females was ∼19% lower than males, a difference which was not evident in the current study. Our findings indicate similar CBF regulation at pre-syncope in females. That females reached critical levels of cerebral hypoperfusion sooner than males can be explained by their lower CO reserve.
Methodological considerations
Until recently it has been commonly reported that changes in transcranial Doppler measurements of the middle cerebral artery is a reliable index of CBF changes as measured by magnetic resonance or ultrasound during modest levels of LBNP (Serrador et al. 2000) or hypocapnia (Giller et al. 1993; Willie et al. 2012). However, these measures have not been conducted with more severe hypotension in combination with hypocapnia and pre-syncope. Moreover, consistent with ultrasound recordings in the internal carotid artery (Willie et al. 2012), recent evidence with high strength magnetic resonance imaging has shown that the MCA does indeed constrict with marked hypocapnia and dilate with hypercapnia (Coverdale et al. 2014). During hypocapnia, Coverdale et al. (2014) reported that a 13 mmHg in  resulted in an 8% reduction in the cross-sectional area of the MCA, equating to a
  –cross-section area relationship of ∼0.04 mm2 mmHg–1. The level of hypocapnia reported by Coverdale et al., is entirely comparable with the level of hypocapnia induced at pre-syncope in non-isocapnic trials presented in this study (study 1: unclamped trial; study 2: placebo trial and INDO trial), with a mean study drop of 13 mmHg. Based on the change in MCA cross-sectional area with hypocapnia as reported by Coverdale et al. (2014), and the change in MCAv velocity in the pre-syncope trials of the current study, we have calculated that the MCAv data in the current study underestimated true MCA flow by approximately 10% rather than 7% as shown by Coverdale et al. (2014). The slightly larger underestimation of MCA flow in the current study might be due to the added hypotension. Indeed, our experimental design yielded MAP differences of ∼22 mmHg during the hypocapnic stimuli, while MAP remained relatively constant in the study by Coverdale and co-workers. It is currently unknown how MCA cross-sectional area changes with combined hypotension and hypocapnia. Nevertheless, this is an important finding, but does not change the interpretation of our conclusions which are largely based on OT time.
Beat-to-beat measurement of arterial BP were measured using non-invasive finger photoplethysmography (finometer), to rule out potential inaccuracy associated with this method, manual sphygmomanometer measurements of BP were taken and any baseline differences were accounted for. Moreover, previous work within our laboratory has found good agreement between photoplethysmography with direct intra-arterial measurements of BP during the progressive LBNP protocol to pre-syncope (Thomas et al. 2009a).
Intentionally, our experiments were conducted on otherwise healthy young subjects without history of syncope or POTS; as such, our results can only be generalized to this population. The possibility that there could be a differential pattern of haemodynamic and cerebrovascular responses in individuals who are prone to syncope is acknowledged; however, this would seem unlikely based on earlier studies highlighting that hypotension-induced reductions in CBF is, to a point, compensated by increases in oxygen extraction (McHenry et al. 1961; Derdeyn et al. 2002). As such, and as highlighted in the lower OT in females (Fig 1B), we suggest that our findings in otherwise healthy individuals reflect a ‘normal’ continuum of these cardiovascular responses to orthostasis. The end of this continuum (Ramirez-Marrero et al. 2008) may well represent and be classified clinically by autonomic disorders associated with marked orthostatic intolerance. Interestingly, in patients with POTS, there is some evidence to support the hypothesis that sustained hypocapnia and cerebral ischaemia produce sympathoexcitation, tachycardia, and elevations in blood pressure (Del Pozzi et al. 2014). Since reductions in MCAv were greater in this study than in patients with POTS (Ocon et al. 2009; Del Pozzi et al. 2014), a speculative possibility is that some cerebral ischaemia may act to maintain blood pressure and therefore OT in the poikilocapnic condition.
Conclusion
In the context of the current experimental design, cerebral hypoperfusion either at rest or induced by hypocapnia at pre-syncope does not impact on OT time. These findings are probably attributable to a compensatory increase in cerebral oxygen extraction. Once cerebral oxygen extraction is maximized the onset of syncope is probably imminent, a possibility that warrants future study during syncope per se.
Glossary
- ANOVA
analysis of variance
- BP
blood pressure
- CA
cerebral autoregulation
- CBF
cerebral blood flow
- CDO2
cerebral delivery of oxygen
- CO
cardiac output
- CVCi
cerebrovascular vascular conductance index
- CVRi
cerebrovascular resistance index
- DBP
diastolic blood pressure
- DMCAv
diastolic middle cerebral artery velocity
- DPCAv
diastolic posterior cerebral artery velocity
- gCBF
global CBF
- HR
heart rate
- HUT
head up tilt
- INDO
indomethacin
- LBNP
lower body negative pressure
- MAP
mean arterial blood pressure
- MCA CVRi
middle cerebral artery cerebral vascular resistance index
- MCAv
middle cerebral artery velocity
- OT
orthostatic tolerance

arterial carbon dioxide
- PCA CVRi
posterior cerebral artery cerebral vascular resistance index

end-tidal carbon dioxide

end-tidal oxygen
- POTS
postural tachycardia syndrome
- PCAv
posterior cerebral artery
- SBP
systolic blood pressure
- SD
standard deviation
- SMCAv
systolic middle cerebral artery velocity
- SPCAv
systolic posterior cerebral artery velocity
- SV
stroke volume
- TPRi
total peripheral resistance index
Key points
Vasovagal syncope (a common form of fainting) is frequently associated with excessive breathing and leads to reductions in carbon dioxide (hypocapnia) and cerebral hypoperfusion. The prevention of hypocapnia during orthostatic stress has been shown to improve orthostatic tolerance, but it still remains to be quantified in a larger population, with a more sustained orthostatic stress.
Resting brain blood flow has been shown to impact orthostatic tolerance; however, the importance of resting brain blood flow per se in the pathophysiology of vasovagal syncope has not been clearly explicated.
Our findings show that cerebral hypoperfusion either at rest or induced by hypocapnia at pre-syncope do not impact on orthostatic tolerance, probably due to a compensatory increase in oxygen extraction of the brain.
Additional information
Competing interests
None declared.
Author contributions
All experimental testing was performed with in the Centre of Heart Lung and Vascular Heath at the University of British Columbia, Okanagan campus. N.C.S.L.: conception and design of the experiments, collection, analysis and interpretation of data, drafting the article or revising it critically for important intellectual content. A.R.B.: conception and design of the experiments, collection, analysis and interpretation of data, drafting the article or revising it critically for important intellectual content. D.B.M: data collection, analysis and interpretation of data, drafting the article or revising it critically for important intellectual content: K.W.W.: data collection, revising article critically for important intellectual content. K.J.S.: data collection, revising article critically for important intellectual content. C.K.W.: collection, analysis and interpretation of data, revising article critically for important intellectual content. M.L.S.: conception and design of the experiments, collection, analysis and interpretation of data, revising article critically for important intellectual content. T.N.: data collection, analysis, revising article critically for important intellectual content. S.A.M.: data collection, analysis, revising article critically for important intellectual content. G.E.F.: revising it critically for important intellectual content. J.M.S.: drafting the article and revising it critically for important intellectual content. P.N.A.: conception and design of the experiments, collection, analysis and interpretation of data, drafting the article and revising it critically for important intellectual content. All authors approved the final version of the manuscript and all qualify for authorship.
Funding
P.N.A. and the work conducted in this project were supported by a Canada Research Chair in Cerebrovascular Physiology and Natural Sciences and Engineering Research Council of Canada Discovery Grant. N.C.S.L. was supported by a post-doctoral fellowship from the Heart and Stroke Foundation of Canada.
References
- Ainslie PN, Lucas SJ, Fan JL, Thomas KN, Cotter JD, Tzeng YC. Burgess KR. Influence of sympathoexcitation at high altitude on cerebrovascular function and ventilatory control in humans. J Appl Physiol. 2012;113:1058–1067. doi: 10.1152/japplphysiol.00463.2012. &. [DOI] [PubMed] [Google Scholar]
- Ainslie PN, Shaw AD, Smith KJ, Willie CK, Ikeda K, Graham J. Macleod DB. Stability of cerebral metabolism and substrate availability in humans during hypoxia and hyperoxia. Clin Sci (Lond) 2014;126:661–670. doi: 10.1042/CS20130343. &. [DOI] [PubMed] [Google Scholar]
-
Bain AR, Smith KJ, Lewis NC, Foster GE, Wildfong KW, Willie CK, Hartley GL, Cheung SS. Ainslie PN. Regional changes in brain blood flow during severe passive hyperthermia: effects of
 and extracranial blood flow. J Appl Physiol. 2013;115:653–659. doi: 10.1152/japplphysiol.00394.2013. &. [DOI] [PubMed] [Google Scholar]
 - Bruhn H, Fransson P. Frahm J. Modulation of cerebral blood oxygenation by indomethacin: MRI at rest and functional brain activation. J Magn Reson Imaging. 2001;13:325–334. doi: 10.1002/jmri.1047. &. [DOI] [PubMed] [Google Scholar]
- Blaber AP, Bondar RL, Moradshahi P, Serrador JM. Hughson RL. Inspiratory CO2 increases orthostatic tolerance during repeated tilt. Aviat Space Environ Med. 2001;72:985–991. &. [PubMed] [Google Scholar]
- Coleridge HM, Coleridge JC. Luck JC. Pulmonary afferent fibres of small diameter stimulated by capsaicin and by hyperinflation of the lungs. J Physiol. 1965;179:248–262. doi: 10.1113/jphysiol.1965.sp007660. &. [DOI] [PMC free article] [PubMed] [Google Scholar]
- Convertino VA, Rickards CA, Lurie KG. Ryan KL. Hyperventilation in response to progressive reduction in central blood volume to near syncope. Aviat Space Environ Med. 2009;80:1012–1017. doi: 10.3357/asem.2598.2009. &. [DOI] [PubMed] [Google Scholar]
- Coverdale NS, Gati JS, Opalevych O, Perrotta A. Shoemaker JK. Cerebral blood flow velocity underestimates cerebral blood flow during modest hypercapnia and hypocapnia. J Appl Physiol. 2014 doi: 10.1152/japplphysiol.00285.2014. &, DOI: 10.1152/japplphysiol.00285.2014. [DOI] [PubMed] [Google Scholar]
- Del Pozzi AT, Schwartz CE, Tewari D, Medow MS. Stewart JM. Reduced cerebral blood flow with orthostasis precedes hypocapnic hyperpnea, sympathetic activation, and postural tachycardia syndrome. Hypertension. 2014;63:1302–1308. doi: 10.1161/HYPERTENSIONAHA.113.02824. &. [DOI] [PMC free article] [PubMed] [Google Scholar]
- Derdeyn CP, Videen TO, Yundt KD, Fritsch SM, Carpenter DA, Grubb RL. Powers WJ. Variability of cerebral blood volume and oxygen extraction: stages of cerebral haemodynamic impairment revisited. Brain. 2002;125:595–607. doi: 10.1093/brain/awf047. &. [DOI] [PubMed] [Google Scholar]
- el-Bedawi KM. Hainsworth R. Combined head-up tilt and lower body suction: a test of orthostatic tolerance. Clin Auton Res. 1994;4:41–47. doi: 10.1007/BF01828837. &. [DOI] [PubMed] [Google Scholar]
- Fan J-L, Burgess K, Thomas K, Peebles K, Lucas S, Lucas R, Cotter J. Ainslie P. Influence of indomethacin on ventilatory and cerebrovascular responsiveness to CO2 and breathing stability: the influence of PCO2 gradients. Am J Physiol Regul Integr Comp Physiol. 2010;298:R1648–R1658. doi: 10.1152/ajpregu.00721.2009. &. [DOI] [PubMed] [Google Scholar]
- Fan J-L, Burgess K, Thomas K, Peebles K, Lucas S, Lucas R, Cotter J. Ainslie P. Influence of indomethacin on the ventilatory and cerebrovascular responsiveness to hypoxia. Eur J Appl Physiol. 2011;111:601–610. doi: 10.1007/s00421-010-1679-0. &. [DOI] [PubMed] [Google Scholar]
- Finnerty F, Witkin L. Fazekas J. Cerebral hemodynamics during cerebral ischemia induced by acute hypotension. J Clin Invest. 1954;33:1227–1232. doi: 10.1172/JCI102997. &. [DOI] [PMC free article] [PubMed] [Google Scholar]
- Fong KJ, Arya M. Paloski WH. Gender differences in cardiovascular tolerance to short radius centrifugation. J Gravit Physiol. 2007;14:P15–P19. &. [PubMed] [Google Scholar]
- Foster GE, Ainslie PN, Stembridge M, Day TA, Bakker A, Lucas SJ, Lewis NC, MacLeod DB. Lovering AT. Resting pulmonary haemodynamics and shunting: a comparison of sea-level inhabitants to high altitude Sherpas. J Physiol. 2014;592:1397–1409. doi: 10.1113/jphysiol.2013.266593. &. [DOI] [PMC free article] [PubMed] [Google Scholar]
- Franke WD, Johnson CP, Steinkamp JA, Wang R. Halliwill JR. Cardiovascular and autonomic responses to lower body negative pressure: do not explain gender differences in orthostatic tolerance. Clin Auton Res. 2003;13:36–44. doi: 10.1007/s10286-003-0066-x. &. [DOI] [PubMed] [Google Scholar]
- Fu Q, Arbab-Zadeh A, Perhonen MA, Zhang R, Zuckerman JH. Levine BD. Hemodynamics of orthostatic intolerance: implications for gender differences. Am J Physiol Heart Circ Physiol. 2004;286:H449–H457. doi: 10.1152/ajpheart.00735.2002. &. [DOI] [PubMed] [Google Scholar]
- Giller CA, Bowman G, Dyer H, Mootz L. Krippner W. Cerebral arterial diameters during changes in blood pressure and carbon dioxide during craniotomy. Neurosurgery. 1993;32:737–741. &; discussion: 741–732. [PubMed] [Google Scholar]
- Grubb B, Gerard G, Roush K, Temesy-Armos P, Montford P, Elliott L, Hahn H. Brewster P. Cerebral vasoconstriction during head-upright tilt-induced vasovagal syncope. Circulation. 1991;84:1157–1164. doi: 10.1161/01.cir.84.3.1157. &. [DOI] [PubMed] [Google Scholar]
- Harper AM. Glass HI. Effect of alterations in the arterial carbon dioxide tension on the blood flow through the cerebral cortex at normal and low arterial blood pressures. J Neurol Neurosurg Psychiatry. 1965;28:449–452. doi: 10.1136/jnnp.28.5.449. &. [DOI] [PMC free article] [PubMed] [Google Scholar]
- Heistad DD, Abboud FM, Mark AL. Schmid PG. Interaction of baroreceptor and chemoreceptor reflexes. Modulation of the chemoreceptor reflex by changes in baroreceptor activity. J Clin Invest. 1974;53:1226–1236. doi: 10.1172/JCI107669. &. [DOI] [PMC free article] [PubMed] [Google Scholar]
- Hohimer A, Richardson B, Bissonnette J. Machida C. The effect of indomethacin on breathing movements and cerebral blood flow and metabolism in the fetal sheep. J Dev Physiol. 1985;7:217–228. &. [PubMed] [Google Scholar]
- Howden R, Lightfoot JT, Brown SJ. Swaine IL. The effects of breathing 5% CO2 on human cardiovascular responses and tolerance to orthostatic stress. Exp Physiol. 2004;89:465–471. doi: 10.1113/expphysiol.2004.027250. &. [DOI] [PubMed] [Google Scholar]
- Immink RV, Pott FC, Secher NH. Van Lieshout JJ. Hyperventilation, cerebral perfusion and syncope. J Appl Physiol. 2013;116:844–851. doi: 10.1152/japplphysiol.00637.2013. &. [DOI] [PubMed] [Google Scholar]
- Ivancev V, Bakovic D, Obad A, Breskovic T, Palada I, Joyner MJ. Dujic Z. Effects of indomethacin on cerebrovascular response to hypercapnea and hypocapnea in breath-hold diving and obstructive sleep apnea. Respir Physiol Neurobiol. 2009;166:152–158. doi: 10.1016/j.resp.2009.03.001. &. [DOI] [PubMed] [Google Scholar]
- Kastrup A, Happe V, Hartmann C. Schabet M. Gender-related effects of indomethacin on cerebrovascular CO2 reactivity. J Neurol Sci. 1999;162:127–132. doi: 10.1016/s0022-510x(98)00288-3. &. [DOI] [PubMed] [Google Scholar]
- Kety SS. Schmidt CF. The effects of active and passive hyperventilation on cerebral blood flow, cerebral oxygen consumption, cardiac output, and blood pressure of normal young men. J Clin Invest. 1946;25:107–119. &. [PubMed] [Google Scholar]
- Kraaier V, Van Huffelen A, Wieneke G, Van der Worp H. Bär P. Quantitative EEG changes due to cerebral vasoconstriction. Indomethacin versus hyperventilation-induced reduction in cerebral blood flow in normal subjects. Electroencephalogr Clin Neurophysiol. 1992;82:208–212. doi: 10.1016/0013-4694(92)90169-i. &. [DOI] [PubMed] [Google Scholar]
- LeLorier P, Klein GJ, Krahn A, Yee R, Skanes A. Shoemaker JK. Combined head-up tilt and lower body negative pressure as an experimental model of orthostatic syncope. J Cardiovasc Electrophysiol. 2003;14:920–924. doi: 10.1046/j.1540-8167.2003.03065.x. &. [DOI] [PubMed] [Google Scholar]
- Levine BD, Giller CA, Lane LD, Buckey JC. Blomqvist CG. Cerebral versus systemic hemodynamics during graded orthostatic stress in humans. Circulation. 1994;90:298–306. doi: 10.1161/01.cir.90.1.298. &. [DOI] [PubMed] [Google Scholar]
- Lewis NC, Ainslie PN, Atkinson G, Jones H, Grant EJ. Lucas SJ. The effect of time-of-day and sympathetic alpha1-blockade on orthostatic tolerance. Chronobiol Int. 2012;29:882–890. doi: 10.3109/07420528.2012.699121. &. [DOI] [PubMed] [Google Scholar]
- Lewis NC, Atkinson G, Lucas SJ, Grant EJ, Jones H, Tzeng YC, Horsman H. Ainslie PN. Diurnal variation in time to presyncope and associated circulatory changes during a controlled orthostatic challenge. Am J Physiol Regul Integr Comp Physiol. 2010;299:R55–R61. doi: 10.1152/ajpregu.00030.2010. &. [DOI] [PubMed] [Google Scholar]
- Liu J, Zhu YS, Hill C, Armstrong K, Tarumi T, Hodics T, Hynan LS. Zhang R. Cerebral autoregulation of blood velocity and volumetric flow during steady-state changes in arterial pressure. Hypertension. 2013;62:973–979. doi: 10.1161/HYPERTENSIONAHA.113.01867. &. [DOI] [PMC free article] [PubMed] [Google Scholar]
- McHenry LC, Jr, Fazekas JF. Sullivan JF. Cerebral hemodynamics of syncope. Am J Med Sci. 1961;241:173–178. doi: 10.1097/00000441-196102000-00004. &. [DOI] [PubMed] [Google Scholar]
- Markus HS, Vallance P. Brown MM. Differential effect of three cyclooxygenase inhibitors on human cerebral blood flow velocity and carbon dioxide reactivity. Stroke. 1994;25:1760–1764. doi: 10.1161/01.str.25.9.1760. &. [DOI] [PubMed] [Google Scholar]
- Marshall JM. Peripheral chemoreceptors and cardiovascular regulation. Physiol Rev. 1994;74:543–594. doi: 10.1152/physrev.1994.74.3.543. [DOI] [PubMed] [Google Scholar]
- Martinon Torres F, Rodriguez Nunez A, Fernandez Cebrian S, Eiris Punal J, Perez Munuzuri A. Martinon Sanchez J. The relation between hyperventilation and pediatric syncope. J Pediat. 2001;138:894–897. doi: 10.1067/mpd.2001.113359. &. [DOI] [PubMed] [Google Scholar]
- Meendering JR, Torgrimson BN, Houghton BL, Halliwill JR. Minson CT. Menstrual cycle and sex affect hemodynamic responses to combined orthostatic and heat stress. Am J Physiol Heart Circ Physiol. 2005;289:H631–H642. doi: 10.1152/ajpheart.00029.2005. &. [DOI] [PubMed] [Google Scholar]
- Miller JD, Pegelow DF, Jacques AJ. Dempsey JA. Skeletal muscle pump versus respiratory muscle pump: modulation of venous return from the locomotor limb in humans. J Physiol. 2005;563:925–943. doi: 10.1113/jphysiol.2004.076422. &. [DOI] [PMC free article] [PubMed] [Google Scholar]
- Naschitz JE, Gaitini L, Mazov I, Eridzhanyan L, Keren D, Sabo E, Yeshurun D, Hardoff D. Jaffe M. The capnography-tilt test for the diagnosis of hyperventilation syncope. QJM. 1997;90:139–145. doi: 10.1093/qjmed/90.2.139. &. [DOI] [PubMed] [Google Scholar]
- Novak V, Spies JM, Novak P, McPhee BR, Rummans TA. Low PA. Hypocapnia and cerebral hypoperfusion in orthostatic intolerance. Stroke. 1998;29:1876–1881. doi: 10.1161/01.str.29.9.1876. &. [DOI] [PubMed] [Google Scholar]
- Numan T, Bain AR, Hoiland R, Smirl JD, Lewis NC. Ainslie PN. Static autoregulation in humans: a review and reanalysis. Med Eng Phys. 2014 doi: 10.1016/j.medengphy.2014.08.001. &, DOI: 10.1016/j.medengphy.2014.08.001. [DOI] [PubMed] [Google Scholar]
- Ocon AJ, Medow MS, Taneja I, Clarke D. Stewart JM. Decreased upright cerebral blood flow and cerebral autoregulation in normocapnic postural tachycardia syndrome. Am J Physiol Heart Circ Physiol. 2009;297:H664–H673. doi: 10.1152/ajpheart.00138.2009. &. [DOI] [PMC free article] [PubMed] [Google Scholar]
- Porta C, Casucci G, Castoldi S, Rinaldi A. Bernardi L. The influence of respiratory instability during neurocardiogenic presyncope on cerebro- and cardiovascular dynamics. Heart. 2008;94:1433–1439. doi: 10.1136/hrt.2006.114223. &. [DOI] [PubMed] [Google Scholar]
- Ramirez-Marrero FA, Charkoudian N, Hart EC, Schroeder D, Zhong L, Eisenach JH. Joyner MJ. Cardiovascular dynamics in healthy subjects with differing heart rate responses to tilt. J Appl Physiol. 2008;105:1448–1453. doi: 10.1152/japplphysiol.90796.2008. &. [DOI] [PMC free article] [PubMed] [Google Scholar]
- Saltzman H, Heyman A. Sieker H. Correlation of clinical and physiologic manifestations of sustained hyperventilation. N Eng J Med. 1963;268:1431–1436. doi: 10.1056/NEJM196306272682602. &. [DOI] [PubMed] [Google Scholar]
- Schumann P, Touzani O, Young AR, Morello R, Baron JC. MacKenzie ET. Evaluation of the ratio of cerebral blood flow to cerebral blood volume as an index of local cerebral perfusion pressure. Brain. 1998;121:1369–1379. doi: 10.1093/brain/121.7.1369. &. [DOI] [PubMed] [Google Scholar]
- Serrador JM, Hughson RL, Kowalchuk JM, Bondar RL. Gelb AW. Cerebral blood flow during orthostasis: role of arterial CO2. Am J Physiol Regul Integr Comp Physiol. 2006;290:R1087–R1093. doi: 10.1152/ajpregu.00446.2005. &. [DOI] [PubMed] [Google Scholar]
- Serrador JM, Picot PA, Rutt BK, Shoemaker JK. Bondar RL. MRI measures of middle cerebral artery diameter in conscious humans during simulated orthostasis. Stroke. 2000;31:1672–1678. doi: 10.1161/01.str.31.7.1672. &. [DOI] [PubMed] [Google Scholar]
- Somers VK, Mark AL, Zavala DC. Abboud FM. Influence of ventilation and hypocapnia on sympathetic nerve responses to hypoxia in normal humans. J Appl Physiol. 1989;67:2095–2100. doi: 10.1152/jappl.1989.67.5.2095. &. [DOI] [PubMed] [Google Scholar]
- Stewart JM. Common syndromes of orthostatic intolerance. Pediatrics. 2013;131:968–980. doi: 10.1542/peds.2012-2610. [DOI] [PMC free article] [PubMed] [Google Scholar]
- Stewart JM, Rivera E, Clarke DA, Baugham IL, Ocon AJ, Taneja I, Terilli C. Medow MS. Ventilatory baroreflex sensitivity in humans is not modulated by chemoreflex activation. Am J Physiol Heart Circ Physiol. 2011;300:H1492–H1500. doi: 10.1152/ajpheart.01217.2010. &. [DOI] [PMC free article] [PubMed] [Google Scholar]
- Thijs RD, van den Aardweg JG, Reijntjes RH, van Dijk JG. van Lieshout JJ. Contrasting effects of isocapnic and hypocapnic hyperventilation on orthostatic circulatory control. J Appl Physiol. 2008;105:1069–1075. doi: 10.1152/japplphysiol.00003.2008. &. [DOI] [PubMed] [Google Scholar]
- Thomas KN, Cotter JD, Galvin SD, Williams MJ, Willie CK. Ainslie PN. Initial orthostatic hypotension is unrelated to orthostatic tolerance in healthy young subjects. J Appl Physiol. 2009a;107:506–517. doi: 10.1152/japplphysiol.91650.2008. &. [DOI] [PubMed] [Google Scholar]
- Thomas KN, Galvin SD, Williams MJ, Willie CK. Ainslie PN. Identical pattern of cerebral hypoperfusion during different types of syncope. J Hum Hypertens. 2009b;24:458–466. doi: 10.1038/jhh.2009.93. &. [DOI] [PubMed] [Google Scholar]
- Van Lieshout J, Wieling W, Karemaker J. Secher N. Syncope, cerebral perfusion, oxygenation. J Appl Physiol. 2003;94:833–848. doi: 10.1152/japplphysiol.00260.2002. &. [DOI] [PubMed] [Google Scholar]
- Wang YJ, Chao AC, Chung CP, Huang YJ. Hu HH. Different cerebral hemodynamic responses between sexes and various vessels in orthostatic stress tests. J Ultrasound Med. 2010;29:1299–1304. doi: 10.7863/jum.2010.29.9.1299. &. [DOI] [PubMed] [Google Scholar]
- Weaver LC. Cardiopulmonary sympathetic afferent influences on renal nerve activity. Am J Physiol Heart Circ Physiol. 1977;233:H592–H599. doi: 10.1152/ajpheart.1977.233.5.H592. [DOI] [PubMed] [Google Scholar]
- Wennmalm A, Carlsson I, Edlund A, Eriksson S, Kaijser L. Nowak J. Central and peripheral haemodynamic effects of non-steroidal anti-inflammatory drugs in man. Arch Toxicol Suppl. 1984;7:350–359. doi: 10.1007/978-3-642-69132-4_58. &. [DOI] [PubMed] [Google Scholar]
- Wesseling KH, Jansen JR, Settels JJ. Schreuder JJ. Computation of aortic flow from pressure in humans using a nonlinear, three-element model. J Appl Physiol. 1993;74:2566–2573. doi: 10.1152/jappl.1993.74.5.2566. &. [DOI] [PubMed] [Google Scholar]
- Willie CK, Colino FL, Bailey DM, Tzeng YC, Binsted G, Jones LW, Haykowsky MJ, Bellapart J, Ogoh S, Smith KJ, Smirl JD, Day TA, Lucas SJ, Eller LK. Ainslie PN. Utility of transcranial Doppler ultrasound for the integrative assessment of cerebrovascular function. J Neurosci Methods. 2011;196:221–237. doi: 10.1016/j.jneumeth.2011.01.011. &. [DOI] [PubMed] [Google Scholar]
- Willie CK, Macleod DB, Shaw AD, Smith KJ, Tzeng YC, Eves ND, Ikeda K, Graham J, Lewis NC, Day TA. Ainslie PN. Regional brain blood flow in man during acute changes in arterial blood gases. J Physiol. 2012;590:3261–3275. doi: 10.1113/jphysiol.2012.228551. &. [DOI] [PMC free article] [PubMed] [Google Scholar]
- Willie CK, Tzeng YC, Fisher JA. Ainslie PN. Integrative regulation of human brain blood flow. J Physiol. 2014;592:841–859. doi: 10.1113/jphysiol.2013.268953. &. [DOI] [PMC free article] [PubMed] [Google Scholar]