

Abstract
It is unknown whether loading of the lower limbs through additional storage of fat mass as evident in obesity would promote muscular adaptations similar to those seen with resistance exercise. It is also unclear whether ageing modulates any such adjustments. This study aimed to examine the relationships between adiposity, ageing and skeletal muscle size and architecture. A total of 100 untrained healthy women were categorised by age into young (Y) (mean ± SD: 26.7 ± 9.4 years) vs. old (O) (65.1 ± 7.2 years) and body mass index (BMI) classification (underweight, normal weight, overweight and obese). Participants were assessed for body fat using dual energy x-ray absorptiometry, and for gastrocnemius medialis (GM) muscle architecture (skeletal muscle fascicle pennation angle and length) and size [GM muscle volume and physiological cross-sectional area (PCSA)] using B-mode ultrasonography. GM fascicle pennation angle (FPA) in the obese Y females was 25% greater than underweight (P = 0.001) and 25% greater than normal weight (P = 0.001) individuals, while O females had 32 and 22% greater FPA than their underweight (P = 0.008) and normal weight (P = 0.003) counterparts. Furthermore, FPA correlated with body mass in both Y and O females (Y r = 0.303; P < 0.001; O r = 0.223; P = 0.001), yet no age-related differences in the slope or r-values were observed (P > 0.05). Both GM muscle volume (P = 0.003) and PCSA (P = 0.004) exhibited significant age × BMI interactions. In addition, muscle volume and PCSA correlated with BMI, body mass and fat mass. Interestingly, ageing reduced both the degree of association in these correlations (P < 0.05) and the slope of the regressions (P < 0.05). Our findings partly support our hypotheses in that obesity-associated changes in GM PCSA and volume differed between the young and old. The younger GM muscle adapted to the loading induced by high levels of body mass, adiposity and BMI by increasing its volume and increasing its pennation angle, ultimately enabling it to produce higher maximum torque. Such an adaptation to increased loading did not occur in the older GM muscle. Nonetheless, the older GM muscle FPA increased to a similar extent to that seen in young GM muscle, an effect which partly explains the relatively enhanced absolute maximum torque observed in obese older females.
Keywords: adiposity, ageing, muscle volume, obesity, physiological cross-sectional area
Introduction
Obesity in both young and old individuals has been shown to induce a loading effect on skeletal muscles of the lower limbs (Lafortuna et al. 2013), increasing absolute maximal voluntary contraction (MVC) torque in obese compared with both normal and underweight individuals (Rolland et al. 2004; Maffiuletti et al. 2007; Tomlinson et al., 2014). A plausible explanation for higher absolute strength may be attributed to greater fat-free mass (FFM) seen in obese individuals (Maffiuletti et al. 2007). However, no previous study has quantified physiological cross-sectional area (PCSA) or muscle architectural component differences in the pennate anti-gravity muscles of the lower limb in obese and non-obese individuals. This is key, as PCSA, more than FFM, allows for the identification of intrinsic muscle quality (strength per unit of PCSA) differences, where fascicle length and pennation angle (i.e. architecture) effects are highlighted.
The potential impact of using muscle-specific PCSA measures rather than whole limb estimates of FFM may explain the apparent discrepancy within the literature on the currently reported impact of obesity on muscle mass. Blimkie et al. (1990) reported no difference between obese and non-obese adolescents in quadriceps anatomical cross-sectional area (ACSA) using CT. This was reiterated by Abdelmoula et al. (2012) from estimated thigh muscle mass using DEXA. In contrast, Maffiuletti et al. (2007) reported 18% greater fat-free mass in obese adults using bioelectrical impedance, whereas previous authors (Rolland et al. 2004) reported similarly increased leg muscle mass using DEXA in an elderly obese population. PCSA is directly proportional to the maximum force generated by skeletal muscle (Lieber & Friden, 2000; Maganaris et al. 2001). Therefore using PCSA as a measure of muscle size would improve data comparison accuracy over ACSA and/or estimations of lean mass utilised in previous studies, as highlighted in the paragraph above. Indeed, ACSA and lean mass estimates would potentially underestimate PCSA (volume/fascicle length; Alexander & Vernon, 1975), thereby leading to an inaccurate estimation of intrinsic skeletal muscle quality.
Ageing, and specifically sarcopenia, is characterised by reduced muscle PCSA, and fascicle pennation angle and length (Morse et al. 2005a). Slowing down the effects of ageing on skeletal muscle is achievable through resistance training and sustained hypergravity (Brown et al. 1990; Ferri et al. 2003; Reeves et al. 2004b; Klentrou et al. 2007; Morse et al. 2007). In contrast to the benefits of resistance exercise or simulated hypergravity, excess adiposity does not appear to be enough of a loading stimulus to mitigate the detrimental functional consequences of obesity in the elderly (e.g. difficulties in walking, climbing stairs and rising from a chair; Rolland et al. 2009). Additionally, a condition that has been shown to exacerbate functional limitations, known as ‘sarcopenic obesity’, is characterised by the age-related loss of muscle mass and strength plus greater intramuscular fat infiltration (Baumgartner, 2000). These increases in fat infiltration coupled with sarcopenia in the elderly are reported to lead to higher levels of pro-inflammatory cytokines associated with muscle catabolism (Schrager et al. 2007), and hence potentially greater prevalence of decreased skeletal muscle mass.
To date, no study has examined the combined effect of sarcopenia and obesity in the elderly, on muscle architecture. This is a patently important area of study, as a further loss of sarcomeres in parallel in the obese, would detrimentally affect maximal force production, thus highlighting the need to target this population for specific counter-measures.
The primary aim of the present study was to examine the degree of any association between BMI (or adiposity per se, i.e. irrespective of BMI status) and muscle architecture (fascicle length and pennation angle), as well as PCSA. A second aim was to determine whether the effects of ageing and adiposity (i.e. continued adiposity from younger to older age) were additive on these variables. It was hypothesised that: (i) muscle PCSA in both obese young and old would be greater than in lean, normal weight and overweight individuals; (ii) muscle fascicle pennation angle and length in obese young and old would be greater than in lean, normal weight and overweight individuals; and (iii) the slope of the relationship between adiposity, BMI, or body mass and PCSA, muscle volume, or architecture, would be lower in the older individuals than in their younger counterparts, denoting a faster rate of changes with increased ageing.
Method
Participants
A total of 100 untrained females volunteered to take part in this study and were categorised by age into either Young (Y) 18–49 years old or Old (O) 50–80 years old (Table 1). Participants were then sub-categorised into four body mass index (BMI) classifications [BMI (kg) stature−2 (m)] into Underweight (BMI < 20), Normal (BMI 20–24.9), Overweight (BMI 25–29.9) and Obese (BMI > 30). The principal exclusion criteria were issues with lower limb muscles/joints affecting mobility or ability to exert maximum torque. It should be noted here that use of non-steroidal anti-inflammatory drugs was also an exclusion criterion. In addition, although three study participants had controlled type II diabetes mellitus, they did not in fact display any characteristics of peripheral neuropathy, such as motor dysfunction and weakness. Physical activity status was screened by questionnaire and participants were excluded if they self-reported as habitually undertaking structured exercise for more than 3 h per week.
Table 1.
Descriptive variables for BMI classifications in both young and old age classifications. Data are presented as mean ± SD
| Young (18–49) | Underweight (n = 13) | Normal (n = 13) | Overweight (n = 9) | Obese (n = 17) | BMI effect | Ageing effect |
|---|---|---|---|---|---|---|
| Age (years) | 23.0 ± 6.7 | 23.2 ± 7.9 | 23.6 ± 8.0 | 30.9 ± 10.7 | P = 0.002 | P = 0.001 |
| BMI (kg m−2) | 18.8 ± 0.9 | 21.6 ± 1.1 | 28.1 ± 2.4 | 35.2 ± 4.4 | P < 0.001 | P = 0.625 |
| Body fat % | 26.5 ± 3.9 | 30.4 ± 3.5 | 38.7 ± 5.9 | 45.3 ± 3.9 | P < 0.001 | P = 0.002 |
| Fat Mass (kg) | 13.7 ± 2.2 | 17.2 ± 2.7 | 28.5 ± 6.8 | 43.2 ± 7.3 | P < 0.001 | P = 0.166 |
| Appendicular skeletal muscle mass (ASM) (kg) | 15.8 ± 1.8 | 16.1 ± 2.6 | 18.7 ± 2.7 | 21.3 ± 3.5 | P < 0.001 | P < 0.001 |
| ASM/height2 (kg m−2) | 9.4 ± 0.9 | 9.8 ± 1.1 | 11.5 ± 1.4 | 12.8 ± 1.8 | P < 0.001 | P < 0.001 |
| Old (50–80) | Underweight (n = 4) | Normal (n = 15) | Overweight (n = 18) | Obese (n = 11) | BMI Effect | Ageing Effect |
|---|---|---|---|---|---|---|
| Age (years) | 63.8 ± 5.7 | 63.5 ± 7.7 | 68.2 ± 4.8 | 62.5 ± 9.0 | P = 0.183 | P = 0.001 |
| BMI (kg m−2) | 19.1 ± 0.8 | 22.2 ± 1.0 | 27.3 ± 1.2 | 34.1 ± 5.7 | P < 0.001 | P = 0.625 |
| Body fat % | 26.5 ± 2.1 | 36.0 ± 3.6 | 42.9 ± 3.3 | 46.1 ± 5.0 | P < 0.001 | P = 0.002 |
| Fat mass (kg) | 12.5 ± 2.0 | 19.9 ± 2.9 | 29.8 ± 3.4 | 40.9 ± 11.3 | P < 0.001 | P = 0.166 |
| ASM (kg) | 14.4 ± 1.2 | 13.9 ± 1.2 | 15.2 ± 1.6 | 18.5 ± 3.7 | P = 0.001 | P < 0.001 |
| ASM/height2 (kg m−2) | 9.0 ± 0.7 | 8.7 ± 0.6 | 9.4 ± 0.9 | 11.4 ± 1.8 | P = 0.001 | P < 0.001 |
Participants gave written informed consent to this study prior to undertaking any assessment, which was approved by the local university Ethics committee.
Body composition measure
A dual energy x-ray absorptiometry (DEXA) scanner (Hologic Discovery: Vertec Scientific Ltd, UK) was used to ascertain 12-h fasted whole body composition. Participants lay in a supine position, avoiding any contact between the trunk and the appendicular mass during a 7-min scanning procedure (whole body procedure, EF 8.4 μSv). Appendicular skeletal muscle mass (ASM) was estimated from the DEXA as the total muscle mass of both the upper and lower limbs. The appendicular skeletal muscle mass index was then calculated using the following calculation: ASM height−2 (kg m−2).
Muscle architecture
Muscle architecture of the gastrocnemius medialis (GM) was measured using B-mode ultrasonography (AU5 Harmonic, Esaote Biomedica, Genoa, Italy) both at rest and during a graded maximal MVC over 6 s. Participants were seated in an isokinetic dynamometer (Cybex Norm, Cybex International, New York, NY, USA) with their hip at an 85° angle, dominant leg extended, and their foot secured to the footplate of the dynamometer. Participants were strapped into the dynamometer using non-extending straps at the hip, distal thigh and chest to reduce extraneous movements.
Resting fascicle pennation angle (FPA) and fascicle length (Lf) were measured with the probe (7.5 MHz linear array probe, 38 mm wide) positioned at 50% of the GM muscle length, at mid muscle belly in the sagittal plane as shown in Fig. 1. Participants were then asked to perform a ramped MVC over 6 s, where the change in both FPA and Lf were recorded on the capturing software (adobe premier pro Version 6, Adobe Systems Software, Ireland). Both resting and maximal images (the latter synchronised with torque outputs using a square wave signal generator) were extrapolated from the capturing software and analysed using imagej (1.45 s; National Institutes of Health, Bethesda, MD, USA). Three clearly visible fascicles within the capturing window, defined from the deep to the superficial aponeurosis, were analysed and the mean values of Lf and FPA were recorded. FPA was defined as the angle of the fascicular path from the superficial to the deep aponeuroses (datum line) of the GM muscle. Linear extrapolation was used on fascicles that extended beyond the edge of the screen. Extrapolation was only undertaken if 60% of the chosen fascicle was visible within the scanning window in line with previous methodology examining muscle architecture of the GM in both a young and old population (Morse et al. 2005a).
Fig. 1.
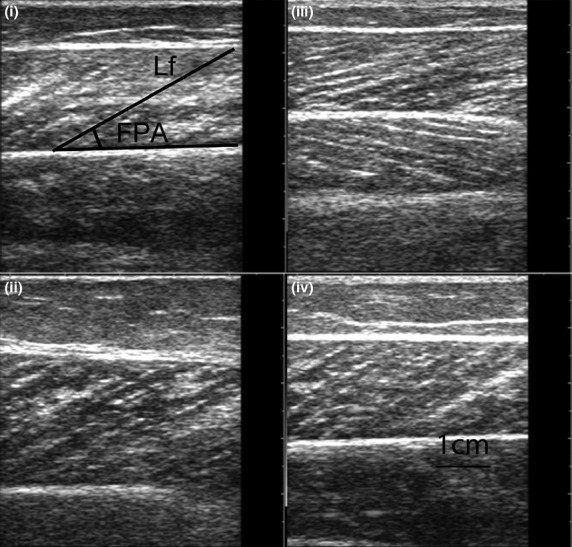
Representative sagittal plane sonographs of the gastrocnemius medialis at 50% of its muscle length in a (i) young normal weight female, (ii) young obese female, (iii) old normal weight female and (iv) old obese female (FPA = fascicle pennation angle; Lf = fascicle length).
Muscle volume
GM muscle volume was calculated using the truncated cone method through the construction of several ACSAs taken at discrete muscle sites (25, 50 and 75% of GM length) using B-mode ultrasonography (AU5 Harmonic, Esaote Biomedica). Participants lay in the prone position with their ankle positioned in neutral (90° angle, referred here as 0°). B-mode ultrasonography was then used to ascertain the proximal insertion (0% of total length) and distal insertion (100% of total length) of the GM, where discrete muscle sites (0, 25, 50, 75 and 100% of length) were marked from the medial to lateral border of the GM. Thin strips (2 mm) of micropore tape (3M, Bracknell, UK) were placed axially 3–4 cm apart, transversally along the nominated muscle lengths (see Fig. 2). The micropore tape was utilised as an echo-absorptive marker in the schematic reconstruction of ACSAs using photo editing software (adobe photoshop; Version 10). During recording of the ACSA, the ultrasound probe (7.5 MHz linear array probe, 38 mm wide) was held perpendicular to the GM on its medial border and moved along a designated marked pathway to its lateral border to ensure the probe was kept perpendicular to the GM during the whole scanning procedure. The probe was moved steadily across the leg with a constant light pressure to avoid compression of the dermal surface (and hence the muscle) during scanning. This procedure was repeated twice at each muscle site for reliability purposes.
Fig. 2.
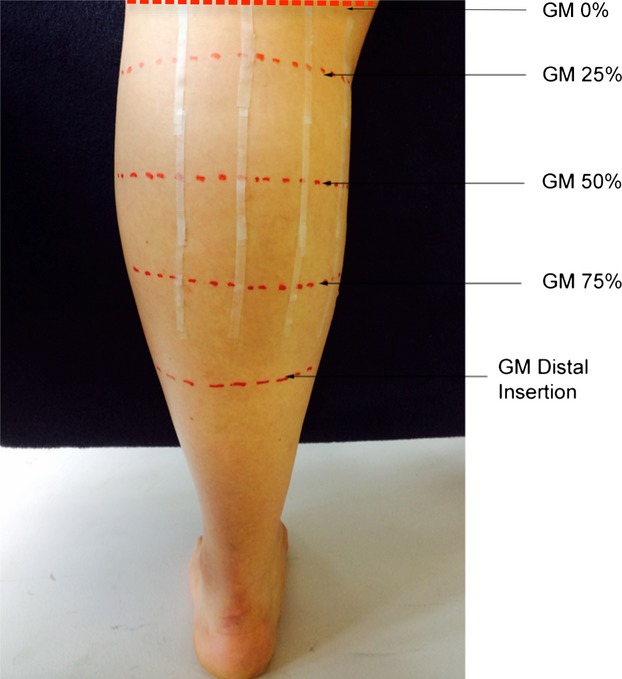
Schematic detailing the anatomical markings at the discrete muscle lengths along the gastrocnemius medialis (GM) muscle length (25, 50 and 75%) and placement of the micropore tape. The GM insertion distal constitutes the 100% muscle length and the GM proximal insertion, the 0% length.
Using the ‘shadows’ cast by the micropore tape as well as anatomical markers, individual transverse frames were extracted offline from each ultrasound recording to reconstruct GM ACSAs at each of the three muscle lengths of interest (Fig. 3) (Reeves et al. 2004a). Following this manual reconstruction of the three ACSAs at 25, 50 and 75% of muscle length, the areas of the complete transverse ACSAs were undertaken using the analysis software imagej (1.45s; National Institutes of Health). To calculate the total muscle volume, an area of 0.5 cm2 was used as a standard measure for 0 and 100% positions along the GM muscle length. Muscle volume was then calculated using the truncated cone method (there were four cones in total):
Fig. 3.
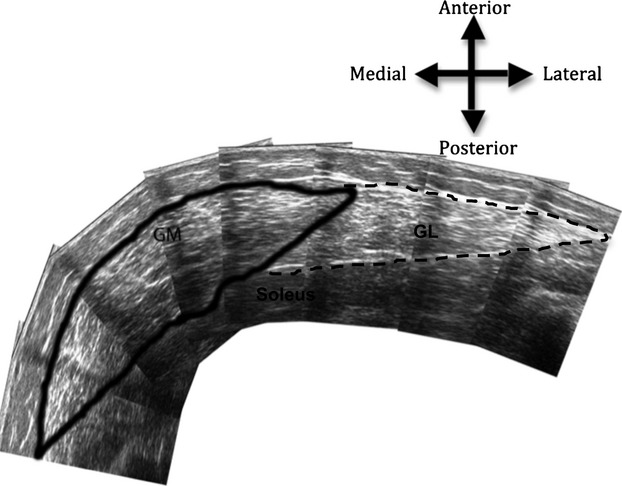
Reconstructed axial plane scans of the gastrocnemius medialis (GM) anatomical cross-sectional area at 50% of muscle length using ultrasonography.
where R1 = radius of the base ACSA; R2 = radius of the top ACSA; h = distance between segments; R = √(ACSA/π), where π = 3.142.
PCSA was then subsequently calculated using the ratio between GM Lf to muscle volume [PCSA = GM muscle volume (cm3)/Lf (cm)].
Reliability
The reliability in the measurement of both muscle architectural characteristics (muscle fascicle pennation angle and length) and GM ACSA was measured in 10 participants (Y = 5; O = 5; BMI range = 17.6–36.7 Kg/m2) on two different days (separated by at least 48 hrs) by the same investigator.
The intra class coefficients (absolute agreement) for all the measurements were high and significant for all of the assessment techniques (muscle fascicle pennation angle rest – 0.997, muscle fascicle pennation angle max – 0.997, muscle fascicle length rest – 0.996, muscle fascicle length max 0.993, GM ACSA 25% length – 0.998, GM ACSA 50% length – 0.999, GM ACSA 75% length – 0.998). It is notable that the measurements of the ACSAs used in the construction of muscle volume are reliable and demonstrate strong agreement with MRI-obtained values (Reeves et al. 2004a).
Statistical analyses
Statistical analyses were carried out using spss (Version 19, SPSS Inc., Chicago, IL, USA). To determine parametricity, Kolmogorov–Smirnov (Y participants) or Shapiro–Wilk (O participants) (normal distribution) and Levene's tests (homogeneity of variance) were utilised. If parametric assumptions were met (FPA, Lf, Lf/muscle length, GM muscle volume and GM PCSA), a factorial 2 × 4 anova (Age × BMI) was utilised with post hoc Bonferroni correction for pairwise comparisons. Where parametric assumptions were breached (age, BMI, fat mass, ASM and ASM height−2) a Mann–Whitney or Kruskal–Wallis test was utilised as appropriate. Pearson correlations described the relationships between measures of muscle architecture, with body mass, fat mass, total lean mass, body fat % and BMI. Comparison of the regression coefficients and slopes were conducted using z-transformations and the Student's t-statistic. It should be noted that some participants did not complete all tests due to faults during data capture, hence the data on regressions utilises fewer samples than the complete cohort of 100 participants (see Results Table 3). Data are reported as mean ± SD and statistical significance was accepted when P ≤ 0.05. Study power (β) and effect size (pε2) are also reported.
Table 3.
Pearson correlations, z transformation of r and Student's t statistic between gastrocnemius medialis (GM) muscle volume and physiological cross-sectional area (PCSA) and fascicle pennation angle (FPA) vs. a series of descriptive variables in young and old untrained females
| Young | Old | |||||||
|---|---|---|---|---|---|---|---|---|
| n | r value | slope | n | r value | Slope | Correlation co-efficient Z-transformation of r | Ageing effect Student's t statistic | |
| GM muscle volume vs. BM | 50 | 0.82*** | 3.15 | 45 | 0.47** | 1.19 | 2.39* | 3.15* |
| GM muscle volume vs. FM | 50 | 0.76*** | 4.54 | 45 | 0.40** | 1.52 | 2.37* | 3.90* |
| GM muscle volume vs. BMI | 50 | 0.75*** | 8.23 | 45 | 0.43** | 3.13 | 2.07* | 3.51* |
| GM PCSA vs. BM | 49 | 0.81*** | 0.86 | 45 | 0.45** | 0.32 | 2.45* | 2.61* |
| GM PCSA vs. FM | 49 | 0.75*** | 1.24 | 45 | 0.39** | 0.41 | 2.34* | 3.77* |
| GM PCSA vs. BMI | 49 | 0.72*** | 2.17 | 45 | 0.39** | 0.80 | 2.02* | 3.26* |
| FPA (rest) vs. BM | 51 | 0.50*** | 0.73 | 48 | 0.49** | 0.89 | 0.03 | −4.79* |
| FPA (rest) vs. FM | 51 | 0.47*** | 0.11 | 48 | 0.48** | 0.13 | 0.07 | 0.50 |
| FPA (rest) vs. BMI | 51 | 0.53*** | 0.22 | 48 | 0.52*** | 0.27 | −0.02 | 0.55 |
| FPA (max) vs. BM | 51 | 0.60*** | 0.16 | 48 | 0.52*** | 0.15 | 0.43 | 0.26 |
| FPA (max) vs. FM | 51 | 0.55*** | 0.23 | 48 | 0.47** | 0.20 | 0.36 | 0.35 |
| FPA (max) vs. BMI | 51 | 0.57*** | 0.43 | 48 | 0.50*** | 0.40 | 0.43 | 0.21 |
BM, body mass; BMI, body mass index; FM, fat mass.
P < 0.05,
P < 0.01,
P < 0.001, If Z > 1.96, P < 0.05; Z > 2.58, P < 0.01, Student's t statistic significance if t falls outside ± 1.96, P < 0.05.
Results
Body composition
Table 1 displays descriptive values for age, BMI, body fat%, ASM and ASM height−2 (m) for Y and O females categorised by BMI.
Muscle pennation angle
Muscle FPA at rest revealed a main effect of age (P = 0.036; pε2 = 0.047; β = 0.556) and BMI (P < 0.001; pε2 = 0.337; β = 1.000), but no significant age × BMI interaction (P = 0.190; pε2 = 0.053; β = 0.413). However, Y obese had 16 and 24% larger muscle FPA at rest than Y underweight (P = 0.020) and Y normal weight (P < 0.001) individuals, whereas O obese had 38% and 20% larger muscle FPA at rest than Y underweight (P = 0.001) and Y normal weight (P = 0.005) individuals (Table 2).
Table 2.
Displays GM skeletal muscle characteristics (GM muscle architecture, GM anatomical cross-sectional area, GM muscle volume and GM physiological cross-sectional area) in both young and old BMI classifications. Data are presented as mean ± SD
| Young | Old | Young BMI effect | Old BMI effect | Ageing effect | |||||||
|---|---|---|---|---|---|---|---|---|---|---|---|
| Underweight (n = 13) | Normal (n = 13) | Overweight (n = 9) | Obese (n = 17) | Underweight (n = 4) | Normal (n = 15) | Overweight (n = 18) | Obese (n = 11) | ||||
| GM muscle architecture | |||||||||||
| FPA (°) – Rest | 18.8 ± 2.5 | 17.6 ± 2.9 | 21.3 ± 2.9 | 21.6 ± 2.3 | 15.5 ± 1.0 | 17.9 ± 2.2 | 19.9 ± 2.8 | 21.4 ± 2.7 | U N/Ob | U N/Ob | P = 0.036 |
| FPA (°) - Ma× | 28.4 ± 5.6 | 28.3 ± 3.9 | 31.4 ± 4.4 | 35.2 ± 4.6 | 24.5 ± 3.5 | 26.4 ± 3.2 | 29.3 ± 4.6 | 32.3 ± 3.6 | U N/Ob | U N/Ob | P = 0.005 |
| Lf (cm) - Rest | 5.2 ± 0.6 | 5.3 ± 0.4 | 5.5 ± 0.8 | 5.7 ± 0.7 | 5.7 ± 0.4 | 5.4 ± 0.7 | 5.4 ± 1.0 | 5.4 ± 0.7 | - | - | P = 0.537 |
| Lf (cm) – Ma× | 3.7 ± 0.7 | 3.6 ± 0.4 | 3.9 ± 0.6 | 3.7 ± 0.6 | 4.1 ± 0.4 | 4.0 ± 0.7 | 3.9 ± 0.6 | 3.9 ± 0.5 | - | - | P = 0.063 |
| GM muscle size | |||||||||||
| GM 25% ACSA (cm2) | 8.4 ± 2.3 | 8.7 ± 2.1 | 13.8 ± 5.0 | 14.0 ± 2.8 | 11.2 ± 2.0 | 9.7 ± 2.0 | 10.2 ± 2.1 | 9.7 ± 2.5 | U N/Ob | - | P = 0.020 |
| GM 50% ACSA (cm2) | 12.1 ± 1.9 | 13.1 ± 2.6 | 17.1 ± 4.2 | 21.3 ± 4.7 | 12.4 ± 1.4 | 13.7 ± 2.3 | 14.8 ± 3.6 | 16.9 ± 4.0 | U N/Ob | - | P = 0.110 |
| GM 75% ACSA (cm2) | 8.1 ± 1.8 | 8.9 ± 1.9 | 11.3 ± 2.1 | 14.0 ± 2.9 | 10.8 ± 2.4 | 8.5 ± 1.8 | 8.5 ± 2.3 | 10.5 ± 2.4 | U N O/Ob | U/Ob | P < 0.001 |
| GM Muscle Volume (cm3) | 180.4 ± 38.7 | 185.0 ± 37.9 | 257.5 ± 83.9 | 319.4 ± 56.9 | 182.4 ± 27.1 | 194.0 ± 40.1 | 200.1 ± 39.4 | 226.3 ± 48.7 | U N/Ob | - | P = 0.010 |
| GM PCSA (cm2) | 50.0 ± 11.9 | 52.1 ± 12.0 | 67.8 ± 17.0 | 88.5 ± 18.3 | 44.5 ± 8.1 | 49.3 ± 11.2 | 51.3 ± 10.3 | 59.3 ± 13.5 | U N O/Ob | - | P < 0.001 |
ACSA, anatomical cross-sectional area; FPA, fascicle pennation angle; Lf, fascicle length; N, normal weight; O, overweight; Ob, obese; PCSA, physiological cross-sectional area; U, underweight.
Muscle FPA during a maximum isometric contraction revealed a main effect of age (P = 0.005; pε2 = 0.083; β = 0.813) and BMI (P < 0.001; pε2 = 0.302; β = 1.000), but no significant age × BMI interaction (P = 0.883; pε2 = 0.007; β = 0.090). However, Y obese had 25% larger muscle FPA during a maximum isometric contraction than Y underweight (P = 0.001) and Y normal weight (P = 0.001) individuals, whereas O obese had 32% and 22% larger muscle FPA during a maximum isometric contraction than Y underweight (P = 0.008) and Y normal weight (P = 0.003) individuals (Table 2).
Muscle fascicle length
Muscle Lf at rest revealed no significant effects of age (P = 0.537; pε2 = 0.004; β = 0.094), BMI (P = 0.789; pε2 = 0.011; β = 0.116) or age × BMI interaction (P = 0.227; pε2 = 0.041; β = 0.339) (Table 2).
Similarly, muscle Lf during a maximum isometric contraction revealed no significant effects of age (P = 0.063; pε2 = 0.037; β = 0.461), BMI (P = 0.376; pε2 = 0.021; β = 0.185) or age × BMI interaction (P = 0.653; pε2 = 0.017; β = 0.158) (Table 2).
Muscle anatomical cross-sectional area
GM ACSA at 25% of muscle length revealed a main effect of BMI (P < 0.001; pε2 = 0.217; β = 0.988), an age effect (P = 0.020; pε2 = 0.061; β = 0.650), and an age × BMI interaction (P = 0.001; pε2 = 0.179; β = 0.961). This translated to Y obese having 68% and 61% greater GM ACSA than Y underweight (P < 0.001) and Y normal weight (P < 0.001) individuals, whereas O obese individuals did not have significantly greater ACSA than their underweight, normal weight and overweight counterparts (P > 0.05) at that site (Table 2).
GM ACSA at 50% of muscle length revealed a main effect of BMI (P < 0.001; pε2 = 0.365; β = 1.000), no significant age effect (P = 0.110; pε2 = 0.029; β = 0.359) and no age × BMI interaction (P = 0.059; pε2 = 0.081; β = 0.617). This translated to Y obese having 76% and 62% greater GM ACSA than Y underweight (P < 0.001) and Y normal weight (P < 0.001) individuals, whereas O obese individuals did not have significantly greater ACSA than their underweight, normal weight and overweight counterparts (P > 0.05) (Table 2).
GM ACSA at 75% of muscle length revealed a main effect of BMI (P < 0.001; pε2 = 0.371; β = 1.000) as well as an age effect (P < 0.001; pε2 = 0.144; β = 0.968), but no age × BMI interaction (P = 0.062; pε2 = 0.080; β = 0.609). More specifically, Y obese had 74%, 58% and 24% greater GM ACSA than Y underweight (P < 0.001), Y normal weight (P < 0.001) and Y overweight (P = 0.048) individuals, whereas O obese individuals only had 2% lower ACSA than their underweight counterparts (P = 0.046) (Table 2).
Muscle volume
GM muscle volume data revealed a main effect of age (P = 0.010; pε2 = 0.074; β = 0.745), BMI (P < 0.001; pε2 = 0.354; β = 1.000) and an age × BMI interaction (P = 0.003; pε2 = 0.145; β = 0.897). Thus, Y obese had 77% and 73% greater GM muscle volume than Y underweight (P < 0.001) and Y normal weight (P < 0.001) individuals, whereas O obese individuals did not have significantly greater GM muscle volume than their underweight, normal weight and overweight counterparts (P > 0.05) (Table 2).
Muscle physiological cross-sectional area
GM PCSA revealed a main effect of age (P < 0.001; pε2 = 0.185; β = 0.992), BMI (P < 0.001; pε2 = 0.371; β = 1.000) and an age × BMI interaction (P = 0.004; pε2 = 0.141; β = 0.882). Specifically, Y obese had 77%, 70% and 31% larger GM PCSA than Y underweight (P < 0.001), Y normal weight (P < 0.001) and Y overweight (P = 0.017) individuals, whilst O obese individuals did not have significantly larger GM PCSA than their underweight, normal weight and overweight counterparts (P > 0.05) (Table 2).
Associations between muscle architecture and body composition according to age
Muscle FPA during a maximum isometric contraction and FM were correlated in both the Y (P < 0.001; r2 = 0.303) and O (P = 0.001; r2 = 0.223) age groups, with similar slopes in the two age groups (Fig. 4A). Similar correlations were observed during resting conditions between skeletal muscle FPA and FM in both Y (P < 0.001; r2 = 0.223) and O (P = 0.001; r2 = 0.225) groups, with similar slopes for the two age groups (Table 3).
Fig. 4.
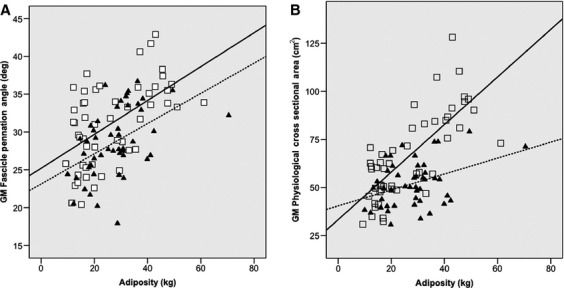
Displays the impact of fat mass on gastrocnemius medialis (GM) fascicle pennation angle during maximum isometric contraction and GM physiological cross-sectional area in both young (□ —— A: r2 = 0.303; P < 0.001; B: r2 = 0.569; P < 0.001) and old (▴ —— A: r2 = 0.223; P = 0.001; B: r2 = 0.149; P = 0.009) females.
There were strong positive associations between GM muscle volume and body mass, fat mass and BMI in both Y and O groups (Table 3). Ageing decreased the strength of the associations, in that both the correlation coefficients and the slopes of the regressions were less strong in the O group (P < 0.05, Table 3).
There were strong positive associations between PCSA and body mass, fat mass and BMI in both Y (P < 0.001) and O groups (P = 0.009) (Table 3, Fig. 4B). Ageing affected both the correlation coefficient in these associations (P < 0.05) and the slope of the regressions (P < 0.05, Table 3).
Discussion
Our data support the hypothesis that high body mass [and/or high BMI and/or high levels of adiposity (absolute fat mass)] acts as a loading stimulus to the GM muscle, particularly in the young. Indeed, GM muscle PCSA, volume and fascicle pennation angle were significantly higher in young obese women than in their normal weight counterparts. Interestingly, even though GM muscle FPA was found to increase, muscle Lf did not change with BMI. This effect, functionally, would translate into a potential for increased force but not increased speed of contraction with obesity.
Irrespective of BMI, there were no significant differences in muscle Lf between Y and O individuals. However, as expected, Y individuals had significantly higher GM PCSA, GM muscle volume and muscle FPA compared with O individuals. Interestingly, there were significant differences in the positive association between PCSA and BMI, and between body mass and fat mass, in Y compared with O individuals. This suggests that the loading stimulus of high body mass (and particularly associated with high levels of adiposity) is partially blunted in the O cohort, possibly through higher levels of circulating pro-inflammatory cytokines and/or lower anabolic growth hormones previously associated with ageing and obesity (Schrager et al. 2007).
Muscle architecture
To our knowledge, this is the first study to compare muscle architecture in non-obese vs. obese human adults. This study confirms previous reports (Narici et al. 2003) that muscle FPA decreases with age (Table 2) but that muscle Lf does not change with age or BMI classification (Table 2).
It was found that muscle FPA at rest and during maximum muscle contraction increases with BMI classification in both Y (rest 15, 23 and 1%; max 25, 25 and 13%) and O (rest 38, 20 and 8%; max 32, 22 and 10%) individuals (for underweight, normal, overweight people, respectively, Table 2). An increase in FPA allows for more sarcomeres to be arranged in parallel, which in humans suggests hypertrophy at the single fibre level (Clark et al. 2011). This in turn enables an increase in MVC torque, as long as an increase in FPA does not exceed 45°, when the resultant force resolved at the tendon becomes negative (Alexander & Vernon, 1975; Degens et al. 2009). This finding is emphasised in Fig. 4A, demonstrating that as fat mass increases, muscle FPA in both Y (r2 = 0.303; P < 0.001) and O (r2 = 0.223; P = 0.001) individuals increases. Within this association there were no differences in the slope of the regression or comparison of the correlation coefficients between age categories (P > 0.05), suggesting that the loading effect of adiposity on muscle FPA is similar in Y and O individuals. These increases in FPA both at rest and during maximal contraction reflect the responses seen in bodybuilders, who chronically load their musculature with weight with the aim of increasing muscle mass, and who have been shown to possess a greater FPA when compared with normal weight controls (Kawakami et al. 1993).
Whether the obesity-mediated beneficial increases in FPA allow more contractile material between the aponeuroses [which is likely to be indicative of fibre hypertrophy as observed in diet-induced obesity in pigs (Clark et al. 2011)], and whether this effect is the same in both Y and O obese individuals, remains to be confirmed. Alternatively, obesity could cause pseudo-hypertrophy, whereby excessive fat infiltrates the muscle, thus artificially increasing muscle thickness and altering the fascicle pennation angle. Fat infiltration has previously been reported in the skeletal musculature of the elderly (Borkan et al. 1983; Visser et al. 2005; Delmonico et al. 2009) and is linked to a lowering of the intrinsic force-generating capacity of the whole muscle (Morse et al. 2005b).
There were no differences in muscle Lf either between Y and O individuals (P = 0.063) or BMI sub-categories (P = 0.376). As this was the first study to examine the effect of adiposity on muscle fascicle geometry, there appears to be no research to compare the effect of adiposity on Lf. Nevertheless, it is notable that research examining the ageing response on fascicle geometry, reports varying results in the gastrocnemius. For instance, Kubo et al. (2003) reported that neither GM muscle FPA (r = −0.112; P > 0.05) nor Lf (r = −0.109; P > 0.05) change as a result of ageing, whereas Morse et al. (2005a) revealed that both gastrocnemius lateralis muscle FPA (−13%) and Lf (−16%) were significantly smaller with ageing. Briefly, the physiological implication of a shortened Lf is a decrease in the number of sarcomeres in series, with a potential twofold effect: (i) an alteration to the working range of the muscle, where this unit may adapt by exhibiting a change in its force–length relationship, shifting to a shorter muscle length for peak force; and (ii) a decrease in the muscle-shortening velocity, and ultimately the muscle maximum power generation capacity. This cascade of effects would potentially cause problems for an obese or elderly population in activities such as locomotion and tasks involving the need to apply forces and relatively high velocities (such as getting up from a chair to answer the doorbell).
In the current study, the mean (across all BMI categories) GM muscle FPA during a maximum contraction decreased significantly with ageing (−8%), similar to the −16% ageing-related FPA decrease reported by Morse et al. (2005a), suggesting a loss of sarcomeres in parallel. A dissociation between fascicle length and pennation angle changes is not unique to the present study. For instance, a 12-month resistance-training program in the elderly highlighted increases in muscle FPA (12 vs. 19%) but no alterations in muscle Lf (Morse et al. 2007).
Muscle size
Prior to the present study, there appeared to be no information on the effect of body composition on PCSA. Our data, which employed an accurate, non-invasive measure of muscle size, revealed main effects of BMI (P < 0.001) and ageing (P < 0.001), as well as a BMI × age interaction (P = 0.004) for PCSA differences. Thus, we demonstrate that adiposity places a loading stimulus similar to that attained with resistance training in Y individuals (Erskine et al. 2010), more so than in O individuals (Morse et al. 2007) (Table 2). However, within the older cohort, the blunted response may be explained by the older muscle being unable to adapt to the load placed upon the musculature. These findings support the work by Lafortuna et al. (2013), who reported that absolute lower limb muscle volume increased along the continuum of increasing BMI from normal weight to obese individuals. However, Lafortuna et al. (2013) used a small sample (n = 18) as well as narrower age range (32–76-year-old females) in comparison with the present study.
In addition to the BMI × age interaction, the slopes of the regressions between BMI, body mass or adiposity and PCSA were steeper in Y vs. O (Table 3 Fig. 4B) individuals, thus highlighting the lower response to the loading effect from body mass/adiposity in the older cohort. The plasticity of the younger muscle appears to adapt structurally similarly to a resistance-trained muscle but the older musculature is unable to adapt to the loading. Reduced muscle mass is a known characteristic of sarcopenia in the elderly (Roubenoff, 1999) and is demonstrated in this study (−20% normal BMI O vs. normal BMI Y) even though the O females did not match the sarcopenic criterion (9.6 ± 1.5 kg m−2 in this group vs. ≤5.67 kg m−2 standard; Baumgartner et al. 1998). However, the decreased GM PCSA was exacerbated in the obese O females (assuming a linear regression when compared with their underweight, normal weight and overweight counterparts). A plausible rationale for the greater loss in PCSA between Y and O obese individuals may be explained through higher levels of circulating pro-inflammatory cytokines seen in both obese and sarcopenic obese individuals (Hotamisligil et al. 1995; Schrager et al. 2007). Increases in inflammatory cytokines such as interlukin-6 (IL-6) and tumour necrosis factor α (TNF-α) have been shown to correlate negatively with muscle strength and lower muscle mass in the elderly (Visser et al. 2002). High levels of these specific cytokines expressed by adipose tissue seen in obesity (Schrager et al. 2007) are reported to increase catabolic activity of skeletal muscle (Roubenoff et al. 1997). In addition to increased catabolic activity, reduced anabolic signalling of growth hormones such as insulin-like growth factor-1 are reported in both elderly (Bucci et al. 2013) and severely obese male and females (Williams et al. 1984). Therefore, the potential synergistic action of increased catabolism and decreased anabolism may explain ‘combined ageing and obesity’-induced losses in GM muscle tissue content, which are over and above expected ‘normal ageing’-related decrements.
Future research would need to confirm the co-existence of high pro-inflammatory cytokine milieux, with decreased anabolic potential, in ageing-with-obesity. Based on such endocrine investigations into pro-inflammatory cytokines such as TNF-α and IL-6, it would then be possible to substantiate the interaction of the two factors (ageing and obesity), in blunting the myogenic response associated with increased mechanical loading (in this case, through additional body fat), observed in this study.
Conclusion
This study demonstrates for the first time that PCSA and FPA of the GM adapts to the loading stimulus of high BMI and/or adiposity in obese young and old females. Increases in GM PCSA and volume when correlated with either BMI and body or fat mass differed between the young and old obese females. The younger muscle mass was seen to adapt to the loading created by high levels of BMI and/or adiposity by increasing GM muscle volume and pennation angle to produce higher maximum torque. This adaptation, however, does not appear to occur in older obese persons. Nonetheless, the older cohort increased their FPA to the same extent as the young women, which may explain an increase in maximum torque in the obese old relative to other BMI/adiposity classifications of older women. These findings are suggestive of differential rate of skeletal muscle ageing, dependent on a person's body composition. Therefore, there is a case for implementing different exercise and/or nutrition interventions according to the somatotype and age of the individual concerned.
Acknowledgments
The authors are ever indebted to every one of the participants in this study for their time and adherence to the pre-test conditions. Dave Tomlinson is the postgraduate student who carried out the day-to-day experiments, data analyses and produced the first manuscript draft. Robert Erskine, Keith Winwood and Christopher Morse are members of the supervision team for Dave Tomlinson and were instrumental in the study design, protocol refinements and data interpretation. Gladys Onambele is the director of studies, who trained Dave Tomlinson, finalised the study design and protocols, and oversaw data analyses as well as all manuscript drafts.
Conflict of interest
The authors confirm that they have no conflicts of interest to declare.
References
- Abdelmoula A, Martin V, Bouchant A, et al. Knee extension strength in obese and nonobese male adolescents. Appl Physiol Nutr Metab. 2012;37:269–275. doi: 10.1139/h2012-010. [DOI] [PubMed] [Google Scholar]
- Alexander RM, Vernon A. The dimensions of knee and ankle muscles and the forces they exert. J Hum Move Stud. 1975;1:115–123. [Google Scholar]
- Baumgartner RN. Body composition in healthy aging. Ann N Y Acad Sci. 2000;904:437–448. doi: 10.1111/j.1749-6632.2000.tb06498.x. [DOI] [PubMed] [Google Scholar]
- Baumgartner RN, Koehler KM, Gallagher D, et al. Epidemiology of sarcopenia among the elderly in New Mexico. Am J Epidemiol. 1998;147:755–763. doi: 10.1093/oxfordjournals.aje.a009520. [DOI] [PubMed] [Google Scholar]
- Blimkie CJ, Sale DG, Bar-Or O. Voluntary strength, evoked twitch contractile properties and motor unit activation of knee extensors in obese and non-obese adolescent males. Eur J Appl Physiol Occup Physiol. 1990;61:313–318. doi: 10.1007/BF00357619. [DOI] [PubMed] [Google Scholar]
- Borkan GA, Hults DE, Gerzof SG, et al. Age changes in body composition revealed by computed tomography. J Gerontol. 1983;38:673–677. doi: 10.1093/geronj/38.6.673. [DOI] [PubMed] [Google Scholar]
- Brown AB, McCartney N, Sale DG. Positive adaptations to weight-lifting training in the elderly. J Appl Physiol. 1990;69:1725–1733. doi: 10.1152/jappl.1990.69.5.1725. [DOI] [PubMed] [Google Scholar]
- Bucci L, Yani SL, Fabbri C, et al. Circulating levels of adipokines and IGF-1 are associated with skeletal muscle strength of young and old healthy subjects. Biogerontology. 2013;14:261–272. doi: 10.1007/s10522-013-9428-5. [DOI] [PubMed] [Google Scholar]
- Clark BA, Alloosh M, Wenzel JW, et al. Effect of diet-induced obesity and metabolic syndrome on skeletal muscles of Ossabaw miniature swine. Am J Physiol Endocrinol Metab. 2011;300:E848–E857. doi: 10.1152/ajpendo.00534.2010. [DOI] [PMC free article] [PubMed] [Google Scholar]
- Degens H, Erskine RM, Morse CI. Disproportionate changes in skeletal muscle strength and size with resistance training and ageing. J Musculoskelet Neuronal Interact. 2009;9:123–129. [PubMed] [Google Scholar]
- Delmonico MJ, Harris TB, Visser M, et al. Longitudinal study of muscle strength, quality, and adipose tissue infiltration. Am J Clin Nutr. 2009;90:1579–1585. doi: 10.3945/ajcn.2009.28047. [DOI] [PMC free article] [PubMed] [Google Scholar]
- Erskine RM, Jones DA, Williams AG, et al. Resistance training increases in vivo quadriceps femoris muscle specific tension in young men. Acta Physiol. 2010;199:83–89. doi: 10.1111/j.1748-1716.2010.02085.x. [DOI] [PubMed] [Google Scholar]
- Ferri A, Scaglioni G, Pousson M, et al. Strength and power changes of the human plantar flexors and knee extensors in response to resistance training in old age. Acta Physiol Scand. 2003;177:69–78. doi: 10.1046/j.1365-201X.2003.01050.x. [DOI] [PubMed] [Google Scholar]
- Hotamisligil GS, Arner P, Caro JF, et al. Increased adipose tissue expression of tumor necrosis factor-alpha in human obesity and insulin resistance. J Clin Invest. 1995;95:2409–2415. doi: 10.1172/JCI117936. [DOI] [PMC free article] [PubMed] [Google Scholar]
- Kawakami Y, Abe T, Fukunaga T. Muscle-fiber pennation angles are greater in hypertrophied than in normal muscles. J Appl Physiol. 1993;74:2740–2744. doi: 10.1152/jappl.1993.74.6.2740. [DOI] [PubMed] [Google Scholar]
- Klentrou P, Slack J, Roy B, et al. Effects of exercise training with weighted vests on bone turnover and isokinetic strength in postmenopausal women. J Aging Phys Act. 2007;15:287–299. doi: 10.1123/japa.15.3.287. [DOI] [PubMed] [Google Scholar]
- Kubo K, Kanehisa H, Azuma K, et al. Muscle architectural characteristics in women aged 20–79 years. Med Sci Sports Exerc. 2003;35:39–44. doi: 10.1097/00005768-200301000-00007. [DOI] [PubMed] [Google Scholar]
- Lafortuna CL, Tresoldi D, Rizzo G. Influence of body adiposity on structural characteristics of skeletal muscle in men and women. Clin Physiol Funct Imaging. 2013;34:47–55. doi: 10.1111/cpf.12062. [DOI] [PubMed] [Google Scholar]
- Lieber RL, Friden J. Functional and clinical significance of skeletal muscle architecture. Muscle Nerve. 2000;23:1647–1666. doi: 10.1002/1097-4598(200011)23:11<1647::aid-mus1>3.0.co;2-m. [DOI] [PubMed] [Google Scholar]
- Maffiuletti NA, Jubeau M, Munzinger U, et al. Differences in quadriceps muscle strength and fatigue between lean and obese subjects. Eur J Appl Physiol. 2007;101:51–59. doi: 10.1007/s00421-007-0471-2. [DOI] [PubMed] [Google Scholar]
- Maganaris CN, Baltzopoulos V, Ball D, et al. In vivo specific tension of human skeletal muscle. J Appl Physiol. 2001;90:865–872. doi: 10.1152/jappl.2001.90.3.865. [DOI] [PubMed] [Google Scholar]
- Morse CI, Thom JM, Birch KM, et al. Changes in triceps surae muscle architecture with sarcopenia. Acta Physiol Scand. 2005a;183:291–298. doi: 10.1111/j.1365-201X.2004.01404.x. [DOI] [PubMed] [Google Scholar]
- Morse CI, Thom JM, Reeves ND, et al. In vivo physiological cross-sectional area and specific force are reduced in the gastrocnemius of elderly men. J Appl Physiol. 2005b;99:1050–1055. doi: 10.1152/japplphysiol.01186.2004. [DOI] [PubMed] [Google Scholar]
- Morse CI, Thom JM, Mian OS, et al. Gastrocnemius specific force is increased in elderly males following a 12-month physical training programme. Eur J Appl Physiol. 2007;100:563–570. doi: 10.1007/s00421-006-0246-1. [DOI] [PubMed] [Google Scholar]
- Narici MV, Maganaris CN, Reeves ND, et al. Effect of aging on human muscle architecture. J Appl Physiol. 2003;95:2229–2234. doi: 10.1152/japplphysiol.00433.2003. [DOI] [PubMed] [Google Scholar]
- Reeves ND, Maganaris CN, Narici MV. Ultrasonographic assessment of human skeletal muscle size. Eur J Appl Physiol. 2004a;91:116–118. doi: 10.1007/s00421-003-0961-9. [DOI] [PubMed] [Google Scholar]
- Reeves ND, Narici MV, Maganaris CN. Effect of resistance training on skeletal muscle-specific force in elderly humans. J Appl Physiol. 2004b;96:885–892. doi: 10.1152/japplphysiol.00688.2003. [DOI] [PubMed] [Google Scholar]
- Rolland Y, Lauwers-Cances V, Pahor M, et al. Muscle strength in obese elderly women: effect of recreational physical activity in a cross-sectional study. Am J Clin Nutr. 2004;79:552–557. doi: 10.1093/ajcn/79.4.552. [DOI] [PubMed] [Google Scholar]
- Rolland Y, Lauwers-Cances V, Cristini C, et al. Difficulties with physical function associated with obesity, sarcopenia, and sarcopenic-obesity in community-dwelling elderly women: the EPIDOS (EPIDemiologie de l'OSteoporose) Study. Am J Clin Nutr. 2009;89:1895–1900. doi: 10.3945/ajcn.2008.26950. [DOI] [PubMed] [Google Scholar]
- Roubenoff R. The pathophysiology of wasting in the elderly. J Nutr. 1999;129:256S–259S. doi: 10.1093/jn/129.1.256S. [DOI] [PubMed] [Google Scholar]
- Roubenoff R, Freeman LM, Smith DE, et al. Adjuvant arthritis as a model of inflammatory cachexia. Arthritis Rheum. 1997;40:534–539. doi: 10.1002/art.1780400320. [DOI] [PubMed] [Google Scholar]
- Schrager MA, Metter EJ, Simonsick E, et al. Sarcopenic obesity and inflammation in the InCHIANTI study. J Appl Physiol. 2007;102:919–925. doi: 10.1152/japplphysiol.00627.2006. [DOI] [PMC free article] [PubMed] [Google Scholar]
- Tomlinson DJ, Erskine RM, Morse CI, Winwood K, Onambele-Pearson GL. Combined effects of body composition and ageing on joint torque, muscle activation and co-contraction in sedentary women. Age. 2014;36:9652. doi: 10.1007/s11357-014-9652-1. [DOI] [PMC free article] [PubMed] [Google Scholar]
- Visser M, Pahor M, Taaffe DR, et al. Relationship of interleukin-6 and tumor necrosis factor-alpha with muscle mass and muscle strength in elderly men and women: the Health ABC Study. J Gerontol A Biol Sci Med Sci. 2002;57:M326–M332. doi: 10.1093/gerona/57.5.m326. [DOI] [PubMed] [Google Scholar]
- Visser M, Goodpaster BH, Kritchevsky SB, et al. Muscle mass, muscle strength, and muscle fat infiltration as predictors of incident mobility limitations in well-functioning older persons. J Gerontol A Biol Sci Med Sci. 2005;60:324–333. doi: 10.1093/gerona/60.3.324. [DOI] [PubMed] [Google Scholar]
- Williams T, Berelowitz M, Joffe SN, et al. Impaired growth hormone responses to growth hormone-releasing factor in obesity. A pituitary defect reversed with weight reduction. N Engl J Med. 1984;311:1403–1407. doi: 10.1056/NEJM198411293112203. [DOI] [PubMed] [Google Scholar]