Abstract
In this paper we use a simple model of presynaptic neuromodulation of GABA signalling to decipher paired whole-cell recordings of frequency dependent cholinergic neuromodulation at CA1 parvalbumin-containing basket cell (PV BC)-pyramidal cell synapses. Variance-mean analysis is employed to normalize the data, which is then used to estimate parameters in the mathematical model. Various parameterizations and hidden parameter dependencies are investigated using Monte Carlo Markov Chain (MCMC) parameter estimation techniques. This analysis reveals that frequency dependence of cholinergic modulation requires both calcium-dependent recovery from depression and mAChR-induced inhibition of presynaptic calcium entry. A reduction in calcium entry into the presynaptic terminal in the kinetic model accounted for the frequency-dependent effects of mAChR activation.
1 Introduction
Neural computation requires the temporal integration of synaptic events [1]. Postsynaptic excitatory synaptic events that are active within a short time window summate to produce a suprathreshold action potential. However, synaptic integration also occurs within synaptic terminals themselves, in which the probability of neurotransmitter release is tightly regulated by the history of use [68]. This type of synaptic integration, termed short-term synaptic plasticity (STP), occurs on a millisecond to second time scale. At high release probability synapses vesicles are readily released upon repetitive stimulation. If the overall available pool of vesicles at all the synapses is depleted faster than the rate that the vesicles are replenished, the size of the postsynaptic response can decrease, termed synaptic depression [41, 9]. At the opposite extreme, at some types of synapses the release probability is initially low and becomes transiently elevated upon repetitive stimulation, resulting in an increase in the postsynaptic response, termed short-term synaptic facilitation. Facilitation and depression do not appear to be mutually exclusive, and can occur at different time scales within the same synaptic terminal, resulting in complex temporal synaptic dynamics [19].
Mathematical models have been developed to describe STP, specifically of depression, beginning in the 1950s before the discovery of microscopic synaptic vesicles [41]. Later models also included facilitation, but were still largely phenomenological [45, 58, 60]. More recently models have been constructed that are grounded on plausible molecular mechanisms [42, 18]. One important determinant of STP is intracellular calcium [68], because the probability of release is thought to bear directly on calcium dynamics within the presynaptic terminal. Facilitation involves the binding of calcium to presynaptic proteins, causing elevated release probability. A larger postsynaptic response occurs if the synapse is stimulated before calcium has unbound from these presynaptic proteins. At excitatory synapses [18, 53, 23, 32, 66, 49, 64], recovery from synaptic depression is also thought to be accelerated by the presence of calcium. Recent work has identified proteins in the presynaptic terminal that control recovery from synaptic depression [10]. Thus, calcium signaling in the presynaptic terminal plays multiple roles in regulating neurotransmitter release [46]. For a current review of these models see Hennig [31].
Through examination of many types of central synapses, principles of STP have emerged at both excitatory [57, 5] and inhibitory [44, 36, 22, 48] synapses. Repetitive activation of inhibitory synapses often results in synaptic depression [47, 65, 3, 24] in which repetitive activity causes the amplitude of subsequent inhibitory postsynaptic currents (IPSCs) to diminish relative to the initial amplitude. In particular, this feature is prominent at inhibitory synapses that contain the calcium binding protein parvalbumin (PV) [8, 21]. Although synaptic depression appears to have a presynaptic origin, it is not clear whether synaptic depression at PV synapses can be accounted for by vesicular depletion alone [37].
The importance of PV interneurons in network dynamics [48, 33] and the potential for network models to provide insight into network dynamics, make it relevant to mathematically describe the operation and modulation of STP at hippocampal PV synapses. Here, using paired recordings between CA1 PV basket cells and pyramidal cells [39] and a mathematical model unifying synaptic depression and facilitation developed by Dittman [18, 19] and expanded upon by Lee [40], we examine underlying mechanisms of STP at hippocampal CA1 PV basket cell synapses across a broad range of physiologically relevant firing frequencies [59, 35]. Activity-dependent synaptic depression in the data is shown to be completely accounted for by vesicular depletion, with minimal contribution of synaptic facilitation due to the rapid decay of presynaptic calcium concentration. Moreover, our model reveals that calcium-dependent recovery from depression (CDR) is necessary to capture the dynamics at all frequencies, and hence is not a mechanism restricted only to excitatory synapses.
Mathematically we have simplified the existing model in [40], reducing it to a two dimensional discrete dynamical system in the non-dimensionalized variables representing calcium concentration and the fractional size of the readily releasable pool of neurotransmitter vesicles, similar to the work of Dittman and Regehr [18]. We have used Bayesian parameter estimation techniques, sometimes dubbed “MCMC”, for Monte Carlo Markov Chain (with state-of-the-art software, [28]) to determine not only a set of parameters that fit the data, but the hidden dependencies in those parameters. This information (provided graphically) guided our reduction of the model to one with fewer free parameters, but more importantly showed us what aspects of the model are essential for capturing the the dynamics of the data. This has important physiological implications, as mentioned above. Recently, Costa et al. 2013 [15] used MCMC techniques to investigate the utility of the methods in synapse identification via clustering of parameter posterior distributions, and developing experimental protocols that best identify model parameters. Our focus here is on model reduction and the development of insight into physiological mechanisms through parameter estimation. The careful synthesis of modeling, experiments and Bayesian parameter estimation is a mostly unexplored avenue of mathematical neuroscience, bridging the gap between between abstractions that cannot be directly related to experiments, and models of such size and complexity that the estimation of parameters from existing data is simply not possible, rendering their ability to elucidate underlying mechanisms questionable.
Finally, PV interneurons are important targets for neuromodulation, [25, 29, 56, 11, 67], which can control the magnitude of neuronal oscillations [13, 4]. Our model accurately predicts that reduced intracellular calcium is the mechanism underlying presynaptic neuromodulatory effects of muscarinic receptor activation [26]. Given that many network models include PV synapses but lack STP [61, 16, 17], a mathematical description of STP at PV synapses will increase the physiological relevance of computational models of learning and memory.
The paper is organized as follows. In the Methods section we describe the experiments and the methods used in the pre-processing of the data, as well the Bayesian parameter estimation technique. The physiological processes and the mathematical model used are then described, for the mathematical readers who may be unfamiliar with the biological background and model assumptions used by Dittmann and Regehr, and Lee et al. [18], [40]. We also perform mathematical simplifications unique to this paper in this section, and illustrate the underlying premise of a competition between the time scales of the stimulation, recovery of the signaling mechanism between stimulations, and probability of release. The next section contains analysis of the discrete dynamical system and its dependence upon parameters, followed by a section that presents results from both a nonlinear least squares fit of the parameters to the experimental data, and a Bayesian estimation of the distributions of the parameters that drives a reduction of parameters in the model. The last section is a discussion of these results and their physiological implications.
2 Methods
2.1 Experiments
In the experiments that we model in this paper, whole-cell recordings are performed from synaptically connected pairs of neurons in mouse hippocampal slices from GFP-positive PV mice [39]. The presynaptic neuron was a PV basket cell (BC) and the postsynaptic neuron was a CA1 pyramidal cell (PC). Using short, 1-2 ms duration suprathreshold current steps to evoke action potentials in the PV BC from a resting potential of -60 mV, trains of 25 action potentials are evoked at 5, 50, and 100 Hz from the presynaptic PV BC. The consequence in the postsynaptic PC is the activation of GABA-A receptor-mediated inhibitory postsynaptic currents (IPSCs). Upon repetitive stimulation, the amplitude of the synaptically evoked IPSC declines to a steady-state level, which is referred to as multiple-pulse depression (MPD). An illustration of data from this experiment at 50 Hz under control conditions figure 1 a). In figure 1 b) we average over seven cells in both control and muscarine conditions, with the baseline subtracted for each pulse, so that measurement is of the change of response upon stimulation. The error bars measure one unit of standard error. These experiments were conducted with 5, 50 and 100 Hz stimulation pulse trains, in order to test for frequency dependent STP effects. These frequencies span the physiological range. Indeed, network oscillations associated with learning and memory feature PV BCs firing in the gamma range (20-50 Hz) [7].
Figure 1.

a) Response to pulse train stimulus from one cell in control conditions, in pA, picoamps. b) Comparison of response in control and muscarine conditions, averaged over 7 cells, plotted with error bars at one standard deviation of the mean. The baseline for each pulse has been subtracted from each peak, to capture the change in the current upon stimulation. c)Absolute value of the response in control and muscarine conditions, baseline removed as described in b), averaged over 7 cells and normalized by Nq (N number of release sites, q quantal amplitude of single synapse) to have units of “probability of release”, Pr.
Bath application of muscarine activates presynaptic muscarinic acetylcholine receptors (mAChRs) which cause a reduction in response overall, and subsequently the amount of steady state depression in the train. The frequency dependence of this effect at this synapse is the focus of our investigation. For instance, is there any reason to suspect that there is a reduction in depression in the gamma frequency range for either control or mAChR activated trains? If this is so, it could have implications in the study of network behavior, and hence the effect of neuromodulation on learning and memory pathways.
2.2 Variance Mean Analysis
The strength of a synaptic connection will determine the size of the response, and that depends upon the average amplitude of the postsynaptic response to a released vesicle of neurotransmitter, call it Q, measured in units pA. The number of independent release sites that make up the synaptic contact, N, and the probability of transmitter release for this pool of release sites, Pr, will also play a role. The average size of the peak response is thus the product of all three: NPrQ.
The experimental response could then be normalized to represent probability of release (and therefore range between 0 and 1 if it is divided by NQ. To find N and Q in these experiments we employ a technique known as Multiple Probability Fluctuation Analysis [51], though we use the simplest version of these techniques, which in this context is called Variance Mean Analysis [12]. The primary assumption is that the probability of release of a vesicle of neurotransmitter follows a Binomial distribution, with a mean proportional to PrQ. The variance of a Binomial distribution can be written as a function of the mean, and it is a quadratic with coefficients that depend on the exact model used for the transmitter release. If the mean of the synaptic amplitude is μ = PrQ, then the variance of the synaptic amplitude can be derived from binomial theory to be σ2 = μQ(1 − Pr). If the synaptic response is assumed to vary from vesicle to vesicle, then Q must represent the average response, with a corresponding variance, CV. This alters the expression for the variance to σ2 = μQ(1 + CV2 − Pr) [50]. It becomes a quadratic in the mean upon substitution of Pr = μ/Q, resulting in
| (1) |
This is a parabola with a maximum at (1 + CV2)Q, and an initial slope of Q(1 + CV2). If measurements of the mean and variance of the synaptic response can be made for varying probability of release, this dependency can be used to compute Pr and Q. We use this method to find the constants needed to normalize the response trains to have units of “probability of release”.
To achieve differing release probabilities we alter the frequency of synaptic stimulation by pulse trains ([51, 34]). By evoking IPSCs from PV BC synapses at 3 different frequencies (5, 50, and 100 Hz), with 25 pulses in each train, we obtain a wide range of release probability conditions during a stable recording period. The mean and variance of 7 individual IPSCs from each condition were computed. To avoid over-sampling of low release probability conditions, raw variance-mean conditions were binned in 10-25 pA increments of mean. We fit the variance-mean relationship with the quadratic function (Variance-Mean Analysis Programs, AxographX, Sydney, Australia):
| (2) |
where σ is the variance, I is the mean response amplitude, q is the average quantal amplitude, N is the number of independent functional release sites, and CV1 is the intrasite quantal coefficient of variation. In muscarine conditions, the fit was often linear, which enabled only q to be determined. To reduce the number of free parameters, we assumed that N did not vary with frequency, the release probability was uniform, the neurotransmitter concentration (and hence quantal amplitude) was stable, GABAA receptors were not saturated, and conduction failures did not occur. We reduced the number of free parameters further by setting CV1 = 0.3 [12]. Although this has not been tested explicitly at PV BC synapses in the CA1 hippocampus, we felt that these assumptions were reasonably justified given the properties of PV synapses described in the dentate gyrus [37] and cortex [14, 55]. Frequency-dependent changes in average release probability Pn were obtained by the equation
| (3) |
where In is the average IPSC amplitude for each stimulus number n of a 25 stimulus train of action potentials. N and q were obtained from the parabolic fit, and were determined to be N = 12.6 ±3.4 (active release sites) and q = 33.8 ± 4.8 pA (per active release site) [39].
The experimental response trains can then be normalized by Nq to change from units of pA to that of release probability, varying between 0 and 1. See figure 1 c), in which the amplitude of the peak (negative) values of the response have been rescaled by Nq. We also evaluate the maximum release probability from the equation
| (4) |
where Imax is the mean EPSC amplitude in the highest release condition. Pmax was determined to be 0.87 for this synapse in these experiments.
2.3 MCMC Methodology
As data contains measurement errors, the unknowns estimated from the data are necessarily more or less uncertain. A natural question then arises: if measurement noise corrupting the data follows some statistical distribution, what is the distribution of ‘all’ the possible solutions to the parameter estimation procedure? Classical formulas for variances and covariances are available for linear models. The situation is quite different for nonlinear models, analytical formulas for the distributions are no longer available. The only way to proceed is to use computational methods to create samples from the distributions and estimate the distributions as histograms of the samples. As data contains randomness or noise, we might have equally well obtained somewhat different data points, and thus different parameter estimates. There are two main options available. We can perturb the measured data and refit the parameters. Or we may perturb parameters, accept parameter values that give good enough fits to data, rejecting others. In the first option, we directly produce different data values. This leads to variants of Bootstrap methods. In the second approach data is not changed, but the uncertainty of data is taken into account by accepting, roughly speaking, parameters that produce model predictions that fit the data within the noise level of measurements. This approach is the background idea of several Markov chain Monte Carlo, or MCMC methods, for example, see [27]. They allow us to perform the seemingly impossible task of correctly sampling from an unknown distribution. The most common of them is the Metropolis algorithm. The core idea is to employ a user-defined proposal distribution from which candidate samples are drawn, and then either accept or reject the sample, depending on how well the model fits the data. The proposal distribution may be rather arbitrary in principle, but the crucial practical question is how to select it to be efficient for numerical calculations. Several adaptive MCMC sampling methods have been developed for this purpose. Here we use the Delayed-Rejection Adaptive Metropolis ([28]) method to study how well our measurements are able to identify the model parameters.
Bayesian inference and MCMC methods are becoming increasingly popular. See [15] and the references therein for recent related works in neuroscience, and for more discussion on the benefits of MCMC sampling approaches as compared to point estimates of parameters obtained by standard least squares fitting algorithms. We note that the model considered here is different from that discussed in [15]. Also, we show here how the results provided by the MCMC chains can be employed for model reductions: we will first study the identifiability of the original model, then analyze the high-dimensional correlations that remain between the model parameters. Finally, we use this information to derive a reduced model, run the MCMC chains again and arrive at well identified parameters.
3 Model Development
3.1 Physiological Process
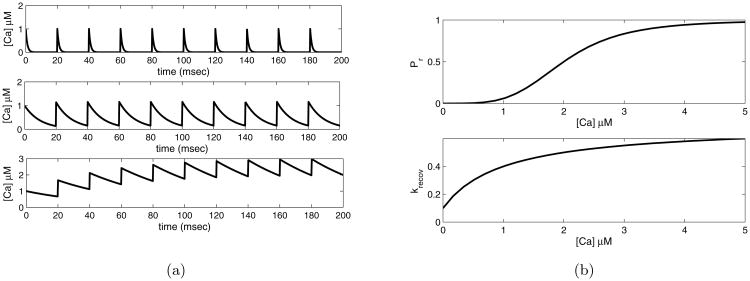
STP at dentate gyrus PV BC synapses has been determined to be of presynaptic origin [29, 2, 37]. Similarly, coefficient of variation and failures analysis indicated that at CA1 PV BC synapses, STP was of presynaptic origin [39]. When an action potential arrives at the BC presynaptic terminal, P/Q-type calcium channels open [30], and an influx of calcium induces exocytosis of vesicles into the synaptic cleft. Presynaptic facilitation occurs if repeated stimulation results in an increase in the amplitude of the postsynaptic response. This a result of an increase in probability of release, which in turn is thought to depend on a build-up in calcium concentration at the presynaptic terminals. If we assume that the calcium concentration in the terminals decays exponentially, the rate of calcium decay relative to the frequency of the stimuli will determine the extent of the accumulation. We illustrate several decay rates for a fixed stimulation frequency and an initial pulse of calcium concentration of the amount δ, in Figure 2. Experimental and modeling work at PV BC synapses has shown tight coupling between presynaptic calcium channels and the exocytosis machinery sensors, whereby a brief (1-2 ms) influx of calcium occurs in the immediate vicinity (10-20 nm) of the exocytosis release machinery [6]. As calcium diffuses outside of the active zone, parvalbumin itself and/or other calcium binding proteins involved in CDR [18, 53, 23, 32, 66, 49, 64] may bind to calcium, thereby influencing the shape of the calcium transient.
Figure 2.
a) Calcium concentration over a time course of pulses, frequency of 50 Hz. Top: τca = 1 msec, middle: τca = 10 msec, bottom: τca = 50 msec. b) Model parameters as they depend upon presynaptic calcium concentration. Top: dependence of probability of release, Pr, upon calcium concentration. Bottom: rate of recovery from depression krecov, as it depends upon calcium concentration
We define the probability of release (Pr) to be the fraction of a pool of synapses that release vesicles upon the arrival of an action potential at the terminal. Following the work of Lee et al. [40], we postulate that the Pr increases monotonically as function of calcium concentration, in a sigmoidal fashion, to asymptote at some Pmax. The kinetics of the synaptotagmin-2 receptors [33, 52] that bind the incoming calcium suggest a Hill equation with coefficient 4 for this function [20], see figure 2 b) top, for an illustration. The half-height concentration value, K, and Pmax are parameters to be determined from the data.
After releasing vesicles upon stimulation, some fraction of the pool of synapses will not be able to release vesicles again if stimulated within some time interval, e.g. they are in a refractory state. This causes “depression”, a monotonic decay of the amplitude of the response upon repeated stimulation. The synapses do recover, however, and it is thought that the rate of recovery of the synapses from the refractory state depends on the calcium concentration in the presynaptic terminal [18]. Indeed, parameter sensitivity analysis indicates that our data cannot be fit by a constant rate of recovery from depression; therefore another time scale must be introduced. There is also physiological evidence that the rate of recovery is increased by increased calcium concentration at the terminal [18, 53, 23, 32, 66, 49, 64]. In our model we again follow Lee et al., [40], and assume a simple monotonic dependence of rate of recovery on calcium concentration, a Hill equation with coefficient of 1, starting at some kmin, increasing to kmax asymptotically as the concentration increases, with a half height of Krecov. See figure 2b), bottom. Muscarine, binding to presynaptic muscarinic acetylcholine receptors (mAChRs) [29, 56], is thought to cause inhibition of calcium channels, thereby decreasing the amount of calcium that enters the terminal when an action potential arrives [26].
The interplay between the presynaptic probability of release and the rate of the recovery from depression creates a filter for the incoming stimulus train. The synapses can act as a low pass or high pass filter depending on the exact values of the parameters, and indeed, in some instances can display resonance [40]. We will illustrate this in the Analysis section. Neuromodulation by mAChR activation modifies the properties of this filter.
3.2 Model Equations
We simulate the effects of short term plasticity upon IPSC amplitudes in the pulse trains with a model in which both depression due to depletion of vesicles and facilitation from an increase in presynaptic calcium concentration are included, similar to the models of [45] and [58]. In addition, the rate of recovery from depression is also dependent on the presynaptic calcium concentration, which was first introduced by Dittman and Regehr [18], and is further expanded upon by Lee et al. [40]. What follows is an review of this model, with illustrations.
It is assumed that the calcium concentration, [Ca], follows first order decay kinetics to a base concentration, [Ca]base. We have further assumed that [Ca]base = 0, since locally (near the calcium sensors) the concentration of calcium will be quite low in the absence of an action potential. We note here that both these assumptions, as well as the dependence of the release mechanism and recovery mechanism on the same concentration of calcium, are most likely gross oversimplifications of the actual mechanisms that take place in the presynaptic terminal. That said, the experiments are not such that any finer resolution of the calcium dependence of the processes or time scales are resolvable. Our purpose is to develop a minimal model that describes the observable processes. With this caveat we continue, and the evolution equation for [Ca] is simply
| (5) |
where τCa is the calcium decay time constant, measured in msec−1. Upon pulse stimulation, presynaptic voltage-gated calcium channels open, and the concentration of calcium at the terminal increases rapidly by an amount δ (measured in μM): [Ca] → [Ca] + δ at the time of the pulse. A sample time course of [Ca] over multiple pulses is shown in fig. 2. Note that calcium build-up is possible over a train of pulses if the decay time is long enough relative to the inter-pulse interval.
The solution to the equation for calcium concentration can be simplified by defining a new time scale, τ = t/τCa. We also non-dimensionalize the calcium concentration by rescaling it by the value of δ in the control case, δc, and defining C = [CA]/δc. After a stimulus occurring at a time t = 0, which results in an increase in C by an amount Δ = δ/δc, the concentration of calcium is
| (6) |
In the control case this further simplifies to
| (7) |
The peak of the postsynaptic IPSC is presumed to be proportional to the total number of release sites that receive stimulation Ntot, which are also ready to release (Rrel), e.g. NtotRrel, multiplied by the probability of release Prel. That is, peak IPSC ∼ NtotRrelPrel. Prel and Rrel are both fractions of the total, and thus range between 0 and 1. Without loss of generality, we consider peak IPSC proportional to RrelPrel, and study the interplay of stimulation frequency and rates of calcium decay and recovery from depression, the rate of the return of the variable Rrel to unity.
Both the probability of release and recovery from depression depend on the presynaptic calcium concentration, illustrated in Figure 2. As mentioned above, the mechanism of vesicle binding and release depends upon calcium binding synaptotagmin-2, which obeys a Hill equation with coefficient 4, thus Prel does so accordingly:
| (8) |
At this point we can make our first contact with the experimental data. The mean-variance analysis allowed us to make a calculation of Pmax, the maximum probability of release for a set of responses.
For this synapse, it was calculated to be 0.87, which occurs (on average) for the first IPSC in the train, at maximal recovery from depression when the coefficient of variation was lowest [39].
The rate of recovery of the release sites is krecov
| (9) |
The variable Rrel is governed by the ordinary differential equation
| (10) |
which can be solved exactly for Rrel(t).
| (11) |
Prel is also a function of time as it follows the concentration of calcium after a stimulus.
We are interested in capturing the peak value of the IPSC only, so we can construct a discrete dynamical system (or “map”) that describes PrelRrel upon repetitive stimulation. Given an inter-spike interval of T, the calcium concentration after a stimulus is C(T) + Δ, and the peak IPSC is proportional to Prel(T)Rrel(T), which depend upon C. After the release Rrel is reduced by the fraction of sites that released vesicles, e.g. Rrel → Rrel − PrelRrel = Rrel(1 − Prel). This value is used as the initial condition in the solution to the ODE for Rrel(t). In this way a two dimensional map (in C and R) from one peak value to the next can be constructed. To simplify the formulas we let P = Prel and R = Rrel. The map is
| (12) |
| (13) |
| (14) |
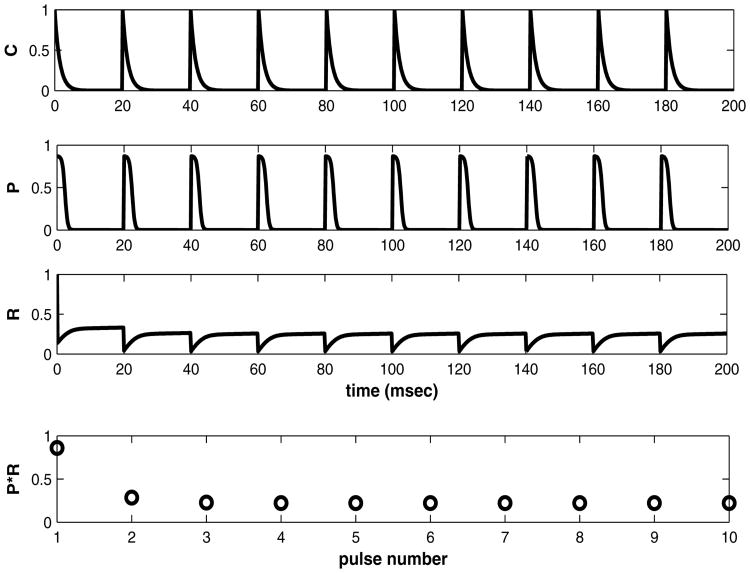
The peak value upon the nth stimulus is RnPn, where Rn is the value of the reserve pool before the release reduces it by the fraction (1 − Pn). The time course of the variables in between stimuli can be followed by graphing the functions C(t), P(t), Rrel(t) vs. t for multiple stimuli. See figure 3. The initial conditions in this figure are C(0) = 0; R(0) = 1, and the stimulation frequency is 50 Hz. Parameters for the model are summarized in Table I.
Figure 3.
a) C(t) vs. time (msec). b) P(t), a function of C(t), plotted vs. time (msec). c) R(t) vs. time (msec), d) peak value = P(t)R(t) vs. stimulus numbe.
Table I. Parameter Description.
| parameter | description |
|---|---|
| Δ | increase in the amount of calcium relative to that seen under control conditions |
| Pmax | maximum probability of release |
| K | half calcium concentration value for probability of release function |
| kmin | minimum rate of recovery of synapses |
| ΔK | maximum minus minimum rate of recovery of synapses |
| Kr | half calcium concentration value for rate of recovery function |
| τCa | decay constant for calcium |
4 Analysis
We can solve for the fixed point, or equilibrium, of the map directly, which represents the peak IPSC response over long time. The result is:
| (15) |
| (16) |
| (17) |
where
| (18) |
We can now compute the dependency of the fixed point on T (inter-spike interval), and the physiological parameters. From the graphs and the expressions for the fixed point, it is evident that there are two distinct ranges of dependence on T, namely e−T and e−kminT. To expose these dependencies we examine the limits of the expression for the fixed point as T approaches zero and infinity.
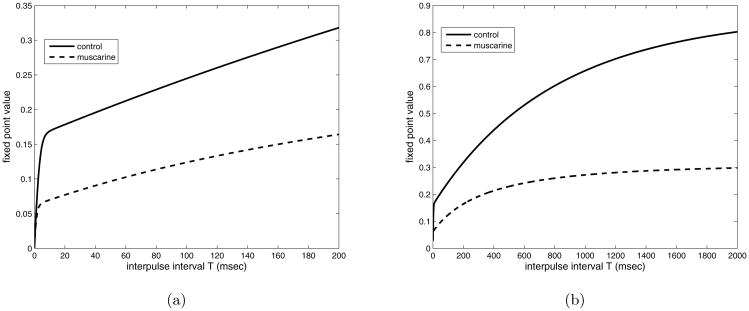
As T limits on infinity, C̄ approaches Δ, and P̄ = PmaxΔ4/(Δ4+K4) = Pmax/(1+K4/Δ4) which we will call P∞. For long inter-spike intervals relative to τCa, the pool of available synapses will be completely replenished, hence R̄ approaches 1, which is clear from the limit of the expression for R̄. Hence the fixed point will asymptote on . The peak response of the cell is determined by Pmax and the relative values of Δ and K. If Pmax is determined from the variance-mean analysis, then in this limit the fixed point determines the increase in calcium (Δ) relative to K. As T approaches zero, C̄ → ∞, so P̄ → Pmax, but R̄ approaches zero, so the fixed point will also be zero. These facts explain the y intercept and horizontal asymptote of the graphs in figure 4. To more fully understand the dependence of the equilibrium on inter-pulse interval, which clearly has two distinct profiles, further approximations must be made.
Figure 4.
Fixed point of the map for parameters found by fitting the experimental data (see section 5), for varying inter-pulse interval, T. Both control and muscarine values of Δ (1.0 and 0.17 respectively) are plotted. a) T = [0, 200] msec, b) T = [0,2000] msec.
If the concentration of calcium decays to zero fast compared to the inter-spike interval (e.g. T large), the initial rapid increase in the rate of recovery from depression is very short-lived. For most of the interval the rate of recovery will be kmin. Hence we approximate the behavior of R by the solution to the ODE
| (19) |
or R(t) = 1 − (1 − R0)e−kmint. The map for R is then
| (20) |
and the fixed point is found to be
| (21) |
As T grows large, P̄ → P∞, so an approximation for the fixed point in this limit is
| (22) |
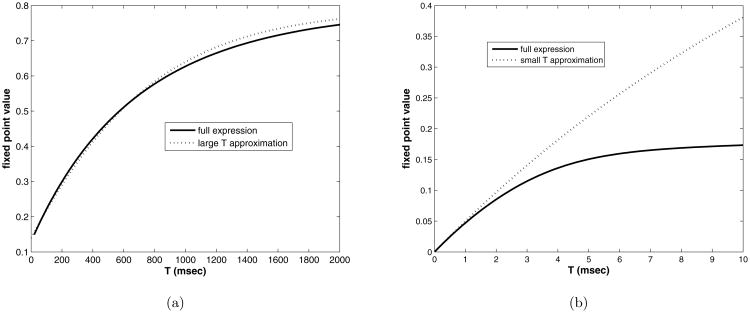
Note that it now contains only one rate of recovery from depression, namely kmin. In figure 5 a) we compare the full expression with this approximation, and see that the limit is approached at the same rate. The decay rate for large T is thus kmin.
Figure 5.
Fixed point value vs. interpulse interval, T, a) T = [0, 2000] msec, b) T = [0, 10] msec, compared with the asymptotic expressions (dotted lines).
For small T, the fixed point decreases to zero, and equals zero for T = 0. In the limit as T → 0 we make the approximation that the rate of recovery is constant at kmax = kmin + Δk, because C̄ → ∞, which will force krecov(C̄) to kmax. Similarly, P̄ → Pmax. Using these values in P̄R̄ wearrive at:
| (23) |
In figure 5 b) we compare this with the full expression over the range T = [0, 10] with the control parameter set. There is reasonable agreement for T < 2.0, establishing the simpler expression as useful in both limits, T → 0 and T → ∞.
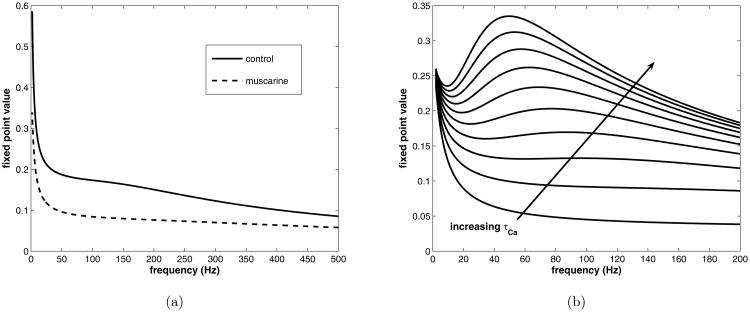
In figure 6 a) we compare the control and muscarine parameter sets, plotting the fixed point vs. the frequency instead of inter-pulse interval. The reduction in the size of the equilibrium upon the addition of muscarine is expected, and for high frequencies, the fixed point tends to zero (data not shown) as it must. Also as expected, the fixed point decays quickly over the first 50 HZ or so, and then proceeds to decay more slowly toward zero for larger frequencies. Thus, not surprisingly, the presynaptic mechanism acts as a low pass filter.
Figure 6.
Plotting fixed point vs. frequency (Hz) for control and muscarine (reduced calcium influx) conditions. a) τCa = 1.5 msec, control compared with muscarine, with physiological parameter values. b) Control condition only with τCa ranging from 1.0 to 20 milliseconds.
It is possible to have “resonance” phenomena with this map, that is, a certain frequency value will produce a larger fixed point than others nearby, but the time scale of calcium decay must be very large. This enables an interplay between calcium enhanced rate of recovery and probability of release. Accordingly, as the time scale is increased, a local maximum in the fixed point vs. frequency graph appears, see figure 6 b). In this figure fixed point vs. frequency is plotted for τCa varying from 1.0 to 20.0 milliseconds. For a decay time greater than about 10 milliseconds, a maximum appears near what could be considered a gamma frequency, around 60-70 Hz. The peak in frequency requires a significant build-up of calcium concentration in the terminal over a pulse train to occur at these frequencies. Because the model of the terminal is very simplified, it is best to interpret this more generally as the need for a mechanism that causes the probability of release, not just the rate of recovery, to depend upon frequency.
We can also compute the eigenvalues of the map, which govern the rate at which the response will decay to the fixed point starting near by. To so so we express the map in a more general fashion:
| (24) |
| (25) |
where f(C) = Ce−T + Δ and . The Jacobianof the map is
which simplifies to
The matrix being lower triangular, the eigenvalues for the map are the diagonal entries, evaluated at the fixed point, (C̄, R̄). The first eigenvalue is , and the associated eigenvector is (1, 1). This part of the map represents rapid decay of the calcium to zero, giving an initial quick collapse of the calcium, followed by a slower decay to the fixed point in R along the eigen-direction of the second eigenvalue, namely (0, 1). This eigenvalue is found by evaluating at the fixed point, with the result:
| (26) |
Recall that , and P(C̄) < 1. Hence 0 < λ2 ≤ 1 and λ1 ≪ λ2 as e−T≪ e−kminT for the values of kmin that we are considering. We note also that for small values of Δk, λ2 ≅ e−kminT, making the two different time scales obvious. The fixed point C̄, R̄ is thus an attracting node with two distinct decay rates, T and kminT.
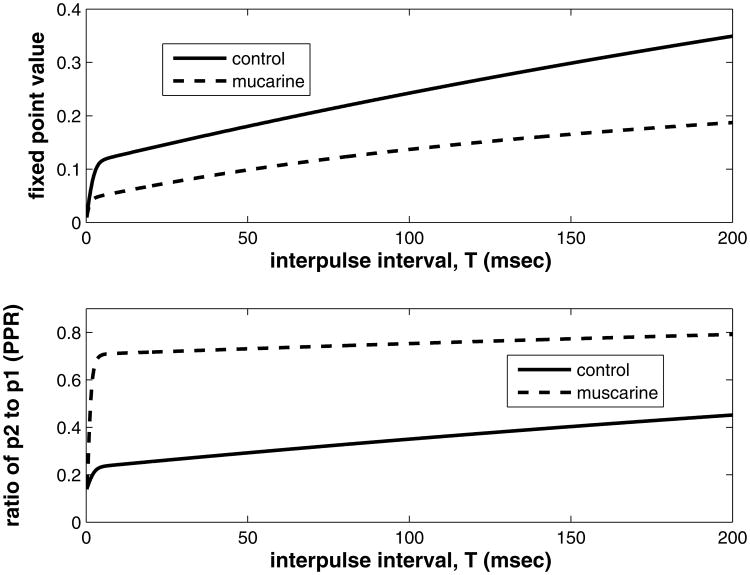
We can use these calculations to draw some conclusions about the effect of muscarine on paired pulse and multiple pulse depression in this data set. The fixed point is a measure of multiple pulse depression (MPD) and the observed eigenvalue, λ2, determines how fast the peaks drop to the equilibrium value. We plot fixed point for the control and muscarine case vs. interpulse interval in figure 7, top. Both muscarine and control cases show an increase of fixed point with increasing interpulse interval. The steepest growth (making it the most sensitive range for frequency changes) happens between 0 and 10 millisecond, or greater than 100 Hz, well beyond the gamma frequency range. Muscarine decreases the fixed point almost uniformly compared to the control, supporting the hypothesis that MPD is increased by the activation of muscarinic receptors.
Figure 7.
Comparing effect of muscarine on the fixed point (top) and paired pulse ratio (p2/p1) (bottom). Physiological parameter set is used (fit from data, see next section). Interpulse interval is varied over the range used in the experiments.
An expression for the ratio between the second and first peak (paired pulse ratio, PPR) can be derived using the eigenvalue and the equation for the fixed point. It is:
| (27) |
where p1 = Δ4Pmax/(Δ4 + K4). The PPR determines the amount of PPD, a smaller PPR meaning more PPD. The dependence of PPR on interpulse interva1, T and Δ is shown in figure 7 (bottom) for the control and muscarine values of Δ (1.0 and 0.172 respectively). It is clear that muscarine increases PPR from control across the range shown, which implies a smaller PPD. Similar to the fixed point vs. T plot, there is a sharp boundary layer at zero through about 5 or 10 milliseconds, beyond which the dependence on T is approximately linear. The presence of the boundary layer indicates an asymptotic approximation could be constructed for these quantities as well, but as this is outside the range physiologically plausible frequencies, it is left for another investigation.
We may thus conclude that while activating muscarinic receptors further depresses the response of these synapses in MPD, it reduces the rate of decay in the initial part of the train, increasing the paired pulse ratio, which means PPD is reduced. The analysis of the model mechanism explains the experimental findings for both long and short train responses.
5 Parameter Estimation
5.1 Simple fitting with initial guesses guided by physiology
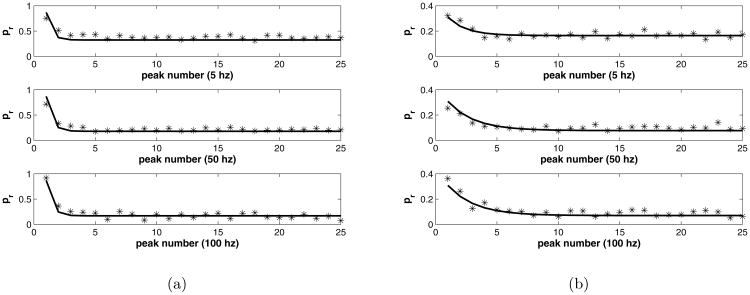
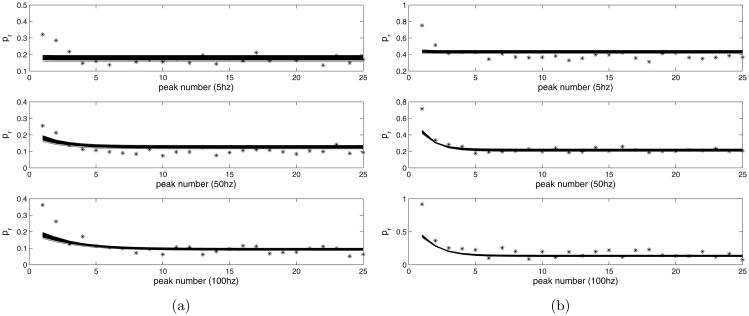
The rescaled data were fitted to the map using the Matlab package lsqnonlin, which performs a constrained optimization, allowing us to restrict the parameter ranges to be non-negative. See figure 8 for the result. The value of Pmax = 0.87 was determined by Variance-Mean analysis. The common fitted parameter values for both data sets are as follows:
Figure 8.
a) Control peaks fitted with model, Δ = 1 compared with data. b) Muscarine peaks fitted with model, Δ = 0.17, compared with data.
| parameter | fitted value |
| K | 0.2 |
| kmin | 0.0017 1/msec |
| kmax | 0.0517 1/msec |
| Kr | 0.1 |
| τCa | 1.5 msec |
The control data set was assigned Δ = 1, which can be done without loss of generality, and the muscarine data set has the fitted value of Δ = 0.17. From this result it is clear that the size of the spike in calcium during a stimulation event must be much reduced to fit the data from the muscarine experiments. This is in accordance with the idea that mAChR activation reduces calcium ion influx at the terminal.
We also quickly discovered that despite non-dimensionalizing, this was not a unique set of parameters. Many variations could be found that fit the data with equal accuracy. For instance, changing the decay rate of calcium could be balanced by varying kmin or the profile of the calcium dependence of the recovery rate. This calls into question the validity of conclusions we make about the physical system based on the model. We explore these dependencies in the next section.
5.2 Results of MCMC parameter estimation
The aim of this section is to critically evaluate the extent to which experimental data is able to determine the model parameters. The combination of a nonlinear model, a multitude of parameters, and noisy data, creates the danger of over-fitting. A least squares fit might be able to produce a good fit to data, but other, quite different parameter combinations might do so as well. Indeed, we will see that a reduction of parameters is needed for the present model with this data set.
We first summarize the model, data and parameters to be estimated. The data used for parameters estimates consists of 6 measurement sets, as given by 3 different stimulation frequencies 5 Hz, 50Hz and 100Hz, both for the control and the muscarine cases. In terms of our model, the data are the normalized size of the pulse, which is given by the product of the release probability P at that time and the available fraction of the synapse pool R. The calcium concentration we call C, and each pulse creates a discontinuous ‘jump’ for C and R, after which we compute the continuous decrease and increase of C and R. The respective values at the end of the pulse interval are then added to the discontinuous increments to get the new initial values after the next pulse. Only the initial values of the product PR are used for parameter estimation. Since each train consists of 25 pulses, the model is given by a loop over n = 1,2, ¨,24 of the map equations given in Section 3.2 above.
The data points themselves are mean values from several repeated experiments, so we may reasonably well assume that the measurement noise is independent and normally distributed. The standard deviation for the measurement noise was estimated from the time variation in the equilibrium value of the data (see figure 1), as we may assume them to represent repetitions from the same source.
We study the same parameters as those above, θ = (K, kmin, Δk, Kr,τ, Δ). Recall that Δ is the ratio of the the influx of calcium under muscarine conditions and control conditions, and as such is set to 1 for the control condition data fits. We start the sampling at the minimum LSQ point found above, and initially use a Gaussian proposal distribution with a diagonal covariance matrix. During the sampling the proposal covariance is then automatically tuned by the adaptive MCMC algorithm.
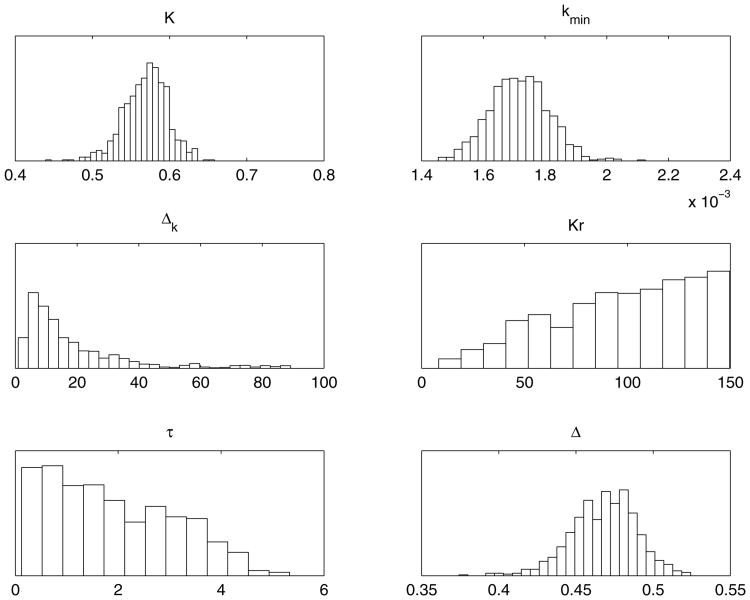
We employed no prior distributions for the parameters, except positivity and certain large upper bounds. The results of an MCMC chain with 100000 samples are presented below. The histograms in figure 9 exhibit the one-dimensional marginal samples of the individual parameters. We can see that the distributions of some of the parameters are well defined but three of them are not.
Figure 9.
One dimensional histograms of the parameters K, kmin, δk, Kr, τ, Δ
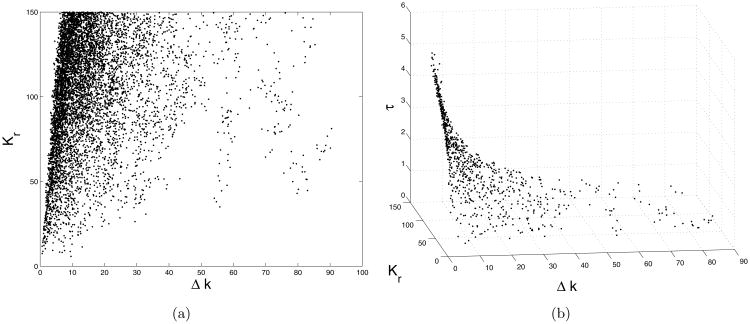
The 2D and 3D scatter plots in figures 10 a) and 10 b) reveal that there is a strong nonlinear correlation between the parameters Δk, Kr and τ: all the accepted samples lie on a thin ‘surface’ in 3D. In order to arrive at a parametrization that is better identified by the measurements, we re-parameterize the model by introducing a new parameter as the ratio α = Δk/Kr. Indeed, the 2D scatter plot 10 a) indicates that only this ratio might be identifiable, not the values of Δk and Kr separately. As for the model, this means that the dependency of R on the calcium concentration remains linear:
Figure 10.
a) Two dimensional scatter plot of the sampled values of Δk and Kr b) Three dimensional scatter plot of the sampled values of Δk, Kr, τ.
| (28) |
This, in turn, leads to somewhat simplified equations for the expression of R(t):
| (29) |
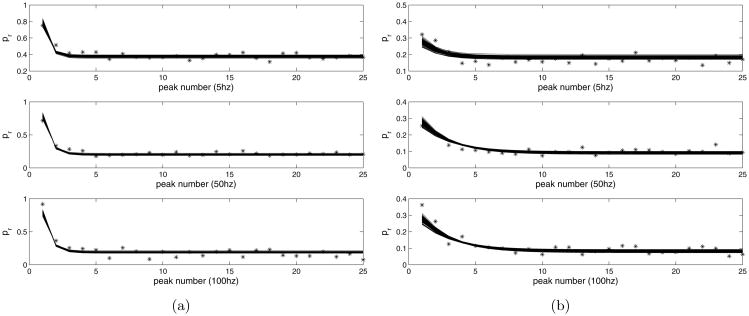
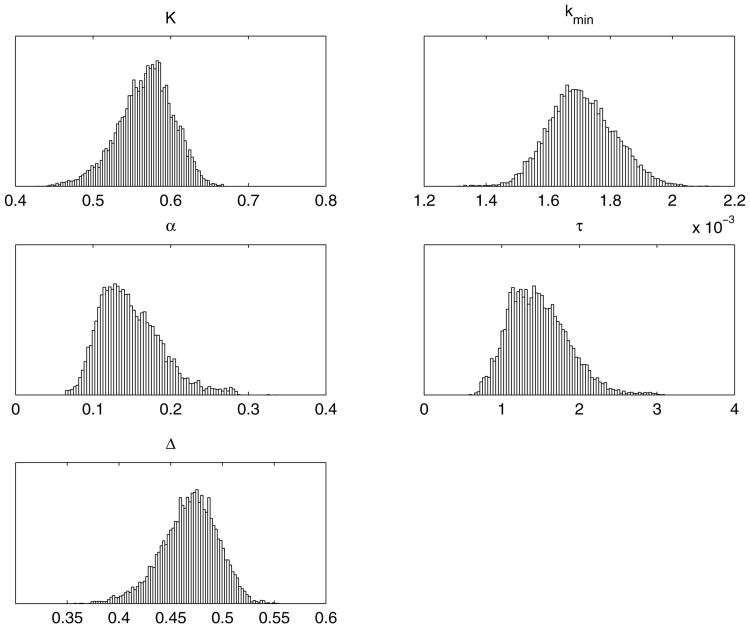
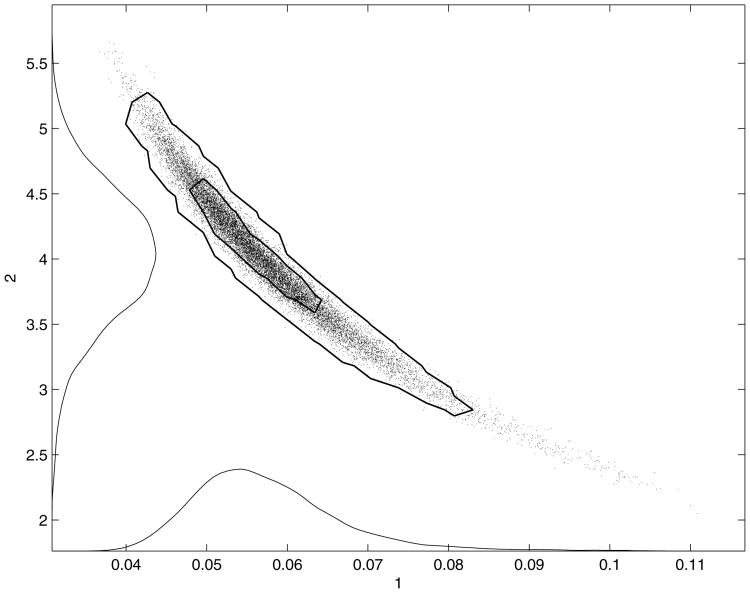
Next, we run a new MCMC sampling employing the model with the reduced parameters θ = (K, kmin, α, τ, Δ). The results are given in the figures 11 a), 11 b), and 12. We can see that the model fits the data with the same accuracy as before, but the parameters are better identified now. The rather strong ‘banana’ style nonlinear correlation between the new parameter α and τ remains, however (see figure 13). This might be inevitable as the present experimental setting couples the parameters: α gives the linear dependency (28) of the recovery rate k on the calcium concentration C, while τ determines the decay rate of C by C(t) = C0e−t/τ. So, the larger τ is, the slower C decays, and the equation (28) allows smaller values for the coefficient α, respectively. This correlation is also revealed by the formula (29). Nevertheless, as separately shown in figure 12, the values of the parameters are bounded. Recall that no priors for the parameters were used, other than positivity and large upper bounds, as figure 10 a) demonstrates.
Figure 11.
a)The sampled fits to control data, using the reduced model. b)The sampled fits to the muscarine data, using the reduced model.
Figure 12.
One dimensional histograms of the parameters K, kmin, α,τ, Δ.
Figure 13.
Two dimensional scatter plot of the parameters α, τ.
The dependency of the recovery rate k on the calcium concentration has been discussed in the literature, see [40]. We might still try to reduce the model by assuming calcium independent k (i.e., set Δk/Kr = 0 in the above equation). The corresponding fits created by MCMC runs are shown in figures 14 a) and 14 b). We can see that the model is not able to fit the data in this case. We conclude that our data is able to confirm the dependency, as well give reasonable lower and upper bounds for a linear model parameter. However, a strong correlation remains with the calcium decay rate. This is hardly surprising, given the exponent of kminτ in the expressions.
Figure 14.
a)The sampled fits to control data, using calcium independent recovery rate k b) The sampled fits to muscarine data, using calcium independent recovery rate k.
6 Discussion
In this paper we have developed a model for synaptic depression that is simple enough to analyze thoroughly, yet retains the major components of earlier models. We can compute analytic expressions requilibrium response values and determine how they depend on the parameters in the model for Sufficient conditions for resonance in the frequency response are implied by the result that calcium accumulation is necessary to create a local maximum in the response vs. frequency function. We determined that a variable rate of recovery, one that depends on the stimulation frequency through the decay rate of calcium concentration, is necessary to capture the response over successive pulses at the three frequencies measured. Exploration of the dynamics of the model indicates it can capture a wide range of observed responses of cells to stimulation at varying frequencies.
It is of physiological interest to compare the reduction in size of the second pulse from the first pulse (paired pulse depression or PPD) and the steady state response value (multiple pulse depression, or MPD). The expressions for the equilibrium capture the dependence of MPD on the parameters in the model, while the eigenvalue in the direction of R determines the decay to the equilibrium and can be observed in PPD. Both phenomena are mechanistically explained in this single model, rather than the two separate physiological mechanisms proposed in [37]. The effect of adding muscarine and activating presynaptic mAChRs was similarly explained by the calcium dependent recovery from depression mechanism, along with a reduced absolute level of calcium influx upon stimulation, leading to a decrease in overall probability of release and reduced size of the response. No additional alterations to the model were required to fit the response in muscarine conditions at 5, 50 and 100 Hz. Additional presynaptic effects of mAChR activation that might explain a reduction in release, such as activation of a presynaptic inward rectifier channel or a direct effect of mAChRs on the neurotransmitter release machinery, cannot be excluded. However, mAChR-induced inhibition of neurotransmitter release through hyperpolarization of the presynaptic terminal seems unlikely [43, 38]. These additional potential mechanisms were not necessary to account for the synaptic effects observed in the muscarine condition. We note here that the model fit also reflects the fact that calcium dependent facilitation occurs on a very fast time scale, indeed, the lingering calcium only plays a role in determining the rate of recovery from depression. At these stimulation frequencies the amount of calcium present at the time of the second pulse is negligible and does not change the probability of release, which is solely determined by the amount of calcium that enters the presynaptic terminal during a stimulation event. This indicates that the tight coupling of the calcium ion channel and the neurotransmitter release machinery found in the GABAergic presynaptic terminals of basket cell-granule cell synapses in the dentate gyrus [6] is also found at these synapses. For a review, see [33].
The application of MCMC in parameter estimation allows us to make these statements with assurance, and also revealed a dependence in the parameters that might otherwise have been missed. A further simplification of the model was made, reducing the functional dependence of the recovery rate of the synapse on calcium to linear and increasing. We note here that our research runs in parallel with the recent work of Costa et al. [15], and we hope in future to implement their techniques. In particular, we plan to use their experimental protocols that should better identify parameters in our future work.
We can then move forward with confidence in the model, and state that the activation of the mAChRs by muscarine causes a reduction in the influx of calcium which then reduces the size of the response and the rate of recovery. The model also predicts that response facilitation through calcium build-up is not present in these experiments. Nevertheless, we have validated that PPD can be reduced even when MPD is left intact. We predict that presynaptic neuromodulation at high release probability synapses will filter incoming input in a way that optimizes pairs of release events at short intervals, while sustained activity in the presence of muscarine weakens synaptic transmission by slowing the rate of calcium dependent recovery, creating a smaller equilibrium response. Therefore, the same underlying physiological mechanism can create very different filtering characteristics in synaptic transmission.
We recognize that this model is a very coarse approximation of the mechanism of presynaptic signalling. In particular, the bundling of calcium dependent probability of release and recovery does not reflect the actual vesicle release train of events. We have shown, however, that including that level of detail would not yield any addition information from the data set. The data can be fit by a model that has a probability of release determined only by the initial influx of calcium, and as such cannot experience facilitation, while the variable rate of recovery, dependent upon a decaying concentration of calcium, is required to capture the frequency dependence of the depression seen in the pulse trains. A more complicated model might include two pools of calcium, one for the release mechanism and another for the recovery of the vesicles, but no further insight could be gained because the additional parameters could not be fitted uniquely. New experiments would have to be designed to uncover the values of these parameters.
Thus we conclude by saying this paper demonstrates the utility of our combined experimental/dynamical model/Bayesian parameter estimation approach to understanding time series from electrophysical experiments. Some of the hidden variables in the processes can be recovered, while others cannot. The results can then guide the development of future experimentation and modeling.
Footnotes
Publisher's Disclaimer: This is a PDF file of an unedited manuscript that has been accepted for publication. As a service to our customers we are providing this early version of the manuscript. The manuscript will undergo copyediting, typesetting, and review of the resulting proof before it is published in its final citable form. Please note that during the production process errors may be discovered which could affect the content, and all legal disclaimers that apply to the journal pertain.
Contributor Information
Emily Stone, Department of Mathematical Sciences, The University of Montana, Missoula, MT 59812.
Heikki Haario, Department of Mathematics and Physics, Lappeenranta University of Technology, Lappeenranta, Finland.
J. Josh Lawrence, Department of Biomedical and Pharmaceutical Sciences, The University of Montana, Missoula, MT 59812.
References
- 1.Abbott LF, Regehr WG. Synaptic computation. Nature. 2004;431(7010):796–803. doi: 10.1038/nature03010. [DOI] [PubMed] [Google Scholar]
- 2.Bartos M, Vida I, Frotscher M, Geiger JR, Jonas P. Rapid signaling at inhibitory synapses in a dentate gyrus interneuron network. The Journal of neuroscience. 2001;21(8):2687–2698. doi: 10.1523/JNEUROSCI.21-08-02687.2001. [DOI] [PMC free article] [PubMed] [Google Scholar]
- 3.Bartos M, Vida I, Frotscher M, Meyer A, Monyer H, Geiger JRP, Jonas P. Fast synaptic inhibition promotes synchronized gamma oscillations in hippocampal interneuron networks. Proceedings of the National Academy of Sciences of the United States of America. 2002;99(20):13222–13227. doi: 10.1073/pnas.192233099. [DOI] [PMC free article] [PubMed] [Google Scholar]
- 4.Bartos M, Vida I, Jonas P. Synaptic mechanisms of synchronized gamma oscillations in inhibitory interneuron networks. Nature Reviews Neuroscience. 2007;8(1):45–56. doi: 10.1038/nrn2044. [DOI] [PubMed] [Google Scholar]
- 5.Blackman AV, Abrahamsson T, Costa RP, Lalanne T, Sjstrm PJ. Target-cell-specific short-term plasticity in local circuits. Frontiers in Synaptic Neuroscience. 2013;5:11. doi: 10.3389/fnsyn.2013.00011. [DOI] [PMC free article] [PubMed] [Google Scholar]
- 6.Bucurenciu I, Kulic A, Schwaller B, Frotscher, Jonas P. Nanodomain coupling between Ca2+ channels and Ca2+ sensors promotes fast and efficient transmitter release at a cortical GABAergic synapse. Neuron. 2008;57:536–545. doi: 10.1016/j.neuron.2007.12.026. [DOI] [PubMed] [Google Scholar]
- 7.Buzsaki G, Wang XJ. Mechanisms of Gamma Oscillations. Annual Reviews of Neuroscience. 2012;35:203–225. doi: 10.1146/annurev-neuro-062111-150444. [DOI] [PMC free article] [PubMed] [Google Scholar]
- 8.Caillard O, Moreno H, Schwaller B, Llano I, Celio MR, Marty A. Role of the calcium-binding protein parvalbumin in short-term synaptic plasticity. Proceedings of the National Academy of Sciences of the United States of America. 2000;97(24):13372–13377. doi: 10.1073/pnas.230362997. [DOI] [PMC free article] [PubMed] [Google Scholar]
- 9.Chance FS, Nelson SB, Abbott LF. Synaptic depression and the temporal response characteristics of V1 cells. The Journal of Neuroscience : the Official Journal of the Society for Neuroscience. 1998;18(12):4785–4799. doi: 10.1523/JNEUROSCI.18-12-04785.1998. [DOI] [PMC free article] [PubMed] [Google Scholar]
- 10.Chen Z, Cooper B, Kalla S, Varoqueaux F, Young SM. The Munc13 proteins differentially regulate readily releasable pool dynamics and calcium-dependent recovery at a central synapse. Journal of Neuroscience. 2013;33(19):8336–8351. doi: 10.1523/JNEUROSCI.5128-12.2013. [DOI] [PMC free article] [PubMed] [Google Scholar]
- 11.Chiang PH, Yeh WC, Lee CT, Weng JY, Huang YY, Lien CC. M(1)-like muscarinic acetylcholine receptors regulate fast-spiking interneuron excitability in rat dentate gyrus. Neuroscience. 2010;169(1):39–51. doi: 10.1016/j.neuroscience.2010.04.051. [DOI] [PubMed] [Google Scholar]
- 12.Clements JD, Silver R. Unveiling synaptic plasticity: a new graphical and analytical approach. Trends in Neuroscience. 2000;23:105–113. doi: 10.1016/s0166-2236(99)01520-9. [DOI] [PubMed] [Google Scholar]
- 13.Cobb SR, Buhl EH, Halasy K, Paulsen O, Somogyi P. Synchronization of neuronal activity in hippocampus by individual GABAergic interneurons. Nature. 1995;378(6552):75–78. doi: 10.1038/378075a0. [DOI] [PubMed] [Google Scholar]
- 14.Connelly WM, Lee G. Modulation and function of the autaptic connections of layer V fast spiking interneurons in the rate neocortex. J Physiology. 2010;588:2047–2063. doi: 10.1113/jphysiol.2009.185199. [DOI] [PMC free article] [PubMed] [Google Scholar]
- 15.Costa RP, Sjöström PJ, van Rossum MCW. Probabilistic inference of short-term plasticity in neocortical microcircuits. Frontiers in Comp Neuroscience. 2013;7:1–12. doi: 10.3389/fncom.2013.00075. [DOI] [PMC free article] [PubMed] [Google Scholar]
- 16.Cutsuridis V, Cobb S, Graham BP. Encoding and retrieval in a model of the hippocampal CA1 microcircuit. Hippocampus. 2010;20(3):423–446. doi: 10.1002/hipo.20661. [DOI] [PubMed] [Google Scholar]
- 17.Cutsuridis V, Hasselmo M. GABAergic contributions to gating, timing, and phase precession of hippocampal neuronal activity during theta oscillations. Hippocampus. 2012;22(7):1597–1621. doi: 10.1002/hipo.21002. [DOI] [PubMed] [Google Scholar]
- 18.Dittman JS, Regehr WG. Calcium dependence and recovery kinetics of presynaptic depression at the climbing fiber to Purkinje cell synapse. J Neuroscience. 1998;18:61476162. doi: 10.1523/JNEUROSCI.18-16-06147.1998. [DOI] [PMC free article] [PubMed] [Google Scholar]
- 19.Dittman JS, Kreitzer AC, Regehr WG. Interplay between facilitation, depression, and residual calcium at three presynaptic terminals. The Journal of Neuroscience : the Official Journal of the Society for Neuroscience. 2000;20(4):1374–1385. doi: 10.1523/JNEUROSCI.20-04-01374.2000. [DOI] [PMC free article] [PubMed] [Google Scholar]
- 20.Dodge FA, Rahamimoff R. Co-operative action a calcium ions in transmitter release at the neuromuscular junction. The Journal of Physiology. 1967;193(2):419432. doi: 10.1113/jphysiol.1967.sp008367. [DOI] [PMC free article] [PubMed] [Google Scholar]
- 21.Eggermann E, Jonas P. How the “slow” Ca(2+) buffer parvalbumin affects transmitter release in nanodomain-coupling regimes. Nature Neuroscience. 2012;15(1):20–22. doi: 10.1038/nn.3002. [DOI] [PMC free article] [PubMed] [Google Scholar]
- 22.Freund TF, Katona I. Perisomatic inhibition. Neuron. 2007;56(1):33–42. doi: 10.1016/j.neuron.2007.09.012. [DOI] [PubMed] [Google Scholar]
- 23.Fuhrmann G, Cowan A, Segev I, Tsodyks M, Stricker C. Multiple mechanisms govern the dynamics of depression at neocortical synapses of young rats. The Journal of Physiology. 2004;557(Pt 2):415–438. doi: 10.1113/jphysiol.2003.058107. [DOI] [PMC free article] [PubMed] [Google Scholar]
- 24.Garlarreta M, Hestrin S. Frequency-dependent synaptic depression and the balance of excitation and inhibition in the neocortex. Nature Neuroscience. 1998;1:587594. doi: 10.1038/2822. [DOI] [PubMed] [Google Scholar]
- 25.Glickfeld LL, Scanziani M. Distinct timing in the activity of cannabinoid-sensitive and cannabinoid-insensitive basket cells. Nature Neuroscience. 2006;9(6):807–815. doi: 10.1038/nn1688. [DOI] [PMC free article] [PubMed] [Google Scholar]
- 26.Gonzalez JC, Lignani G, Maroto M, Baldelli P, Hernandez-Guijo JM. Presynaptic Muscarinic Receptors Reduce Synaptic Depression and Facilitate its Recovery at Hippocampal GABAergic Synapses. Cerebral Cortex. 2014;24(7):1818–1831. doi: 10.1093/cercor/bht032. [DOI] [PubMed] [Google Scholar]
- 27.Haario H, Saksman E, Tamminen J. An adaptive Metropolis algorithm. Bernoulli. 2001;7:223242. [Google Scholar]
- 28.Haario H, Laine M, Mira A, Saksman E. DRAM: Efficient adaptive MCMC. Stat Comput. 2006;16:339354. [Google Scholar]
- 29.Hefft S, Kraushaar U, Geiger JRP, Jonas P. Presynaptic short-term depression is maintained during regulation of transmitter release at a GABAergic synapse in rat hippocampus. The Journal of Physiology. 2002;539(1):201–208. doi: 10.1113/jphysiol.2001.013455. [DOI] [PMC free article] [PubMed] [Google Scholar]
- 30.Hefft S, Jonas P. Asynchronous GABA release generates long-lasting inhibition at a hippocampal interneuron-principal neuron synapse. Nature Neuroscience. 2005;8(10):1319–1328. doi: 10.1038/nn1542. [DOI] [PubMed] [Google Scholar]
- 31.Hennig MH. Theoretical models of synaptic short term plasticity. Frontiers in Computational Neuroscience. 2013;7:45. doi: 10.3389/fncom.2013.00045. [DOI] [PMC free article] [PubMed] [Google Scholar]
- 32.Hosoi NN, Sakaba TT, Neher EE. Quantitative analysis of calcium-dependent vesicle recruitment and its functional role at the calyx of Held synapse. The Journal of Neuro-science. 2007;27(52):14286–14298. doi: 10.1523/JNEUROSCI.4122-07.2007. [DOI] [PMC free article] [PubMed] [Google Scholar]
- 33.Hu H, Gan J, Jonas P. Fast-spiking, parvalbumin+ GABAergic interneurons: From cellular design to microcircuit function. Science. 2014;345(6196):1255263. doi: 10.1126/science.1255263. [DOI] [PubMed] [Google Scholar]
- 34.Hull C, Isaacson JS, Scanziani M. Postsynaptic mechanisms govern the differential excitation of cortical neurons by thalamic inputs. Journal of Neuroscience. 2009;29:9127–9136. doi: 10.1523/JNEUROSCI.5971-08.2009. [DOI] [PMC free article] [PubMed] [Google Scholar]
- 35.Klausberger T, Magill PJ, Mrton LF, Roberts JDB, Cobden PM, Buzski G, Somogyi P. Brain-state- and cell-type-specific firing of hippocampal interneurons in vivo. Nature. 2003;421(6925):844–848. doi: 10.1038/nature01374. [DOI] [PubMed] [Google Scholar]
- 36.Somogyi P, Klausberger T. Defined types of cortical interneurone structure space and spike timing in the hippocampus. The Journal of Physiology. 2005;562(1):9–26. doi: 10.1113/jphysiol.2004.078915. [DOI] [PMC free article] [PubMed] [Google Scholar]
- 37.Kraushaar U, Jonas P. Efficacy and stability of quantal GABA release at a hip-pocampal interneuron-principal neuron synapse. The Journal of Neuroscience : the Official Journal of the Society for Neuroscience. 2000;20(15):5594–5607. doi: 10.1523/JNEUROSCI.20-15-05594.2000. [DOI] [PMC free article] [PubMed] [Google Scholar]
- 38.Kulik A, Vida I, Fukazawa Y, Guetg N, Kasugai Y, Marker CL, et al. Compartment-dependent colocalization of Kir3.2-containing K+ channels and GABAB receptors in hippocampal pyramidal cells. Journal of Neuroscience. 2006;26(16):4289–4297. doi: 10.1523/JNEUROSCI.4178-05.2006. [DOI] [PMC free article] [PubMed] [Google Scholar]
- 39.Lawrence J, Haario H, Stone E. Presynaptic Cholinergic neuromodulation alters the temporal dynamics of short-term depression at CA1 parvalbumin positive basket cell synapses. Journal of Neurophysiology, under revision. 2014 doi: 10.1152/jn.00167.2014. [DOI] [PMC free article] [PubMed] [Google Scholar]
- 40.Lee C, Anton M, Poon C, McRae G. A kinetic model unifying presynaptic short-term facilitation and depression. J Computational Neuroscience. 2009;26:459–473. doi: 10.1007/s10827-008-0122-6. [DOI] [PMC free article] [PubMed] [Google Scholar]
- 41.Liley AW, North KA. An electrical investigation of effects of repetitive stimulation on mammalian neuromuscular junction. Journal of Neurophysiology. 1953;16(5):509–527. doi: 10.1152/jn.1953.16.5.509. [DOI] [PubMed] [Google Scholar]
- 42.Lu T, Trussell LO. Inhibitory transmission mediated by asynchronous transmitter release. Neuron. 2000;26(3):683–694. doi: 10.1016/s0896-6273(00)81204-0. [DOI] [PubMed] [Google Scholar]
- 43.Luscher C, Jan LY, Stoffel M, Malenka RC, Nicoll RA. G protein-coupled inwardly rectifying K+ channels (GIRKs) mediate postsynaptic but not presynaptic transmitter actions in hippocampal neurons. Neuron. 1997;19(3):687–695. doi: 10.1016/s0896-6273(00)80381-5. [DOI] [PubMed] [Google Scholar]
- 44.Maccaferri G, Roberts JD, Szucs P, Cottingham CA, Somogyi P. Cell surface domain specific postsynaptic currents evoked by identified GABAergic neurones in rat hippocampus in vitro. The Journal of Physiology. 2000;524(1):91–116. doi: 10.1111/j.1469-7793.2000.t01-3-00091.x. [DOI] [PMC free article] [PubMed] [Google Scholar]
- 45.Markram H, Wang Y, Tsodyks M. Differential signaling via the same axon of neocortical pyramidal neurons. Proceedings of the National Academy of Sciences of the United States of America. 1998;95(9):5323–5328. doi: 10.1073/pnas.95.9.5323. [DOI] [PMC free article] [PubMed] [Google Scholar]
- 46.Neher E, Sakaba T. Multiple roles of calcium ions in the regulation of neurotransmitter release. Neuron. 2008;59(6):861–872. doi: 10.1016/j.neuron.2008.08.019. [DOI] [PubMed] [Google Scholar]
- 47.Otis TS, Mody I. Differential activation of GABAA and GABAB receptors by spontaneously released transmitter. Journal of Neurophysiology. 1992;67(1):227–235. doi: 10.1152/jn.1992.67.1.227. [DOI] [PubMed] [Google Scholar]
- 48.Pouille F, Scanziani M. Routing of spike series by dynamic circuits in the hippocampus. Nature. 2004;429(6993):717–723. doi: 10.1038/nature02615. [DOI] [PubMed] [Google Scholar]
- 49.Pyle JL, Kavalali ET, Piedras-Rentera ES, Tsien RW. Rapid reuse of readily releasable pool vesicles at hippocampal synapses. Neuron. 2000;28(1):221–231. doi: 10.1016/s0896-6273(00)00098-2. [DOI] [PubMed] [Google Scholar]
- 50.Reid CA, Clements JD. Postsynaption expression of long-term potentiation in the rat dentate gyrus demonstrated by variance-mean analysis. Journal of Physiology. 1999;518:121–130. doi: 10.1111/j.1469-7793.1999.0121r.x. [DOI] [PMC free article] [PubMed] [Google Scholar]
- 51.Silver RA, Momiyama A, Cull-Candy SG. Locus of frequency dependent depression identified with multiple-probability fluctuation at rat climbing fibre-Purkinje cell synapses. Journal of Physiology. 1998;510:881–902. doi: 10.1111/j.1469-7793.1998.881bj.x. [DOI] [PMC free article] [PubMed] [Google Scholar]
- 52.Sommeijer JP, Levelt CN. Synaptotagmin-2 is a reliable marker for parvalbumin positive inhibitory boutons in the mouse visual cortex. PLOS ONE. 2012;7:e35323. doi: 10.1371/journal.pone.0035323. [DOI] [PMC free article] [PubMed] [Google Scholar]
- 53.Stevens CF, Wesseling JF. Activity-dependent modulation of the rate at which synaptic vesicles become available to undergo exocytosis. Neuron. 1998;21(2):415–424. doi: 10.1016/s0896-6273(00)80550-4. [DOI] [PubMed] [Google Scholar]
- 54.Sylwestrak EL, Ghosh A. Elfn1 regulates target-specific release probability at CA1-interneuron synapses. Science. 2012;338(6106):536–540. doi: 10.1126/science.1222482. [DOI] [PMC free article] [PubMed] [Google Scholar]
- 55.Szabadics J, Tamás G, Soltesz I. Different transmittertransients underlie presynaptic cell tyep specificty of GABAA, slow and GABAA, fast. Nature Proceedings of the National Academy of Science U S A. 2007;104(37):14831–6. doi: 10.1073/pnas.0707204104. [DOI] [PMC free article] [PubMed] [Google Scholar]
- 56.Szabó GG, Holderith N, Gulyás AI, Freund TF, Hájos N. Distinct synaptic properties of perisomatic inhibitory cell types and their different modulation by cholinergic receptor activation in the CA3 region of the mouse hippocampus. The European Journal of Neuroscience. 2010;31(12):2234–2246. doi: 10.1111/j.1460-9568.2010.07292.x. [DOI] [PMC free article] [PubMed] [Google Scholar]
- 57.Tóth K, McBain CJ. Target-specific expression of pre- and postsynaptic mechanisms. The Journal of Physiology. 2000;525(1):41–51. doi: 10.1111/j.1469-7793.2000.00041.x. [DOI] [PMC free article] [PubMed] [Google Scholar]
- 58.Tsodyks MV, Markram H. The neural code between neocortical pyramidal neurons depends on neurotransmitter release probability. Proceedings of the National Academy of Sciences of the United States of America. 1997;94(2):719–723. doi: 10.1073/pnas.94.2.719. [DOI] [PMC free article] [PubMed] [Google Scholar]
- 59.Varga C, Golshani P, Soltesz I. Frequency-invariant temporal ordering of interneuronal discharges during hippocampal oscillations in awake mice. Proceedings of the National Academy of Sciences of the United States of America. 2012;109(40) doi: 10.1073/pnas.1210929109. [DOI] [PMC free article] [PubMed] [Google Scholar]
- 60.Varela JA, Sen K, Gibson J, Fost J, Abbott LF, Nelson SB. A quantitative description of short-trem plasticity at excitatory synapses in layer 2/3 of rat primary visual cortex. J Neuroscience. 1997;17:7926–7940. doi: 10.1523/JNEUROSCI.17-20-07926.1997. [DOI] [PMC free article] [PubMed] [Google Scholar]
- 61.Vida I, Bartos M, Jonas P. Shunting inhibition improves robustness of gamma oscillations in hippocampal interneuron networks by homogenizing firing rates. Neuron. 2006;49(1):107–117. doi: 10.1016/j.neuron.2005.11.036. [DOI] [PubMed] [Google Scholar]
- 62.Gersdorff von H, Schneggenburger R, Weis S, Neher E. Presynaptic depression at a calyx synapse: the small contribution of metabotropic glutamate receptors. The Journal of Neuroscience : the Official Journal of the Society for Neuroscience. 1997;17(21):8137–8146. doi: 10.1523/JNEUROSCI.17-21-08137.1997. [DOI] [PMC free article] [PubMed] [Google Scholar]
- 63.Wang LY, Kaczmarek LK. High-frequency firing helps replenish the readily releasable pool of synaptic vesicles. Nature. 1998;394:384–388. doi: 10.1038/28645. [DOI] [PubMed] [Google Scholar]
- 64.Weis S, Schneggenburger R, Neher E. Properties of a model of Ca++ dependent vesicle pool dynamics and short term synaptic depression. Biophysical Journal. 1999;77(5):2418–2429. doi: 10.1016/S0006-3495(99)77079-7. [DOI] [PMC free article] [PubMed] [Google Scholar]
- 65.Wilcox KS, Dichter MA. Paired pulse depression in cultured hippocampal neurons is due to a presynaptic mechanism independent of GABA-B autoreceptor activation. Neuroscience. 1994;14(3 Pt 2):1775–1788. doi: 10.1523/JNEUROSCI.14-03-01775.1994. [DOI] [PMC free article] [PubMed] [Google Scholar]
- 66.Worden MK, Bykhovskaia M, Hackett JT. Facilitation at the lobster neuromuscular junction: a stimulus-dependent mobilization model. Journal of Neurophysiology. 1997;78(1):417–428. doi: 10.1152/jn.1997.78.1.417. [DOI] [PubMed] [Google Scholar]
- 67.Yi F, Ball J, Stoll KE, Satpute VC, Mitchell SM, Pauli JL, et al. Direct excitation of parvalbumin-positive interneurons by M1 muscarinic acetylcholine receptors: roles in cellular excitability, inhibitory transmission and cognition. The Journal of Physiology. 2014;592(Pt 16):3463–3494. doi: 10.1113/jphysiol.2014.275453. [DOI] [PMC free article] [PubMed] [Google Scholar]
- 68.Zucker RS, Regehr WG. Short-term synaptic plasticity. Annual Review of Physiology. 2002;64:355–405. doi: 10.1146/annurev.physiol.64.092501.114547. [DOI] [PubMed] [Google Scholar]


